

1 Introduction
To help evaluate the performance of a large interdisciplinary, cross-institutional research project, we addressed a challenging complex of attributes. The five-year “innovative Urban Transitions and Aridregion Hydro-sustainability” (iUTAH) project was initiated in 2012 with support from the US National Science Foundation’s (NSF) “Established Program to Stimulate Competitive Research” (EPSCoR). The iUTAH research proposal mandated a comprehensive research collaboration assessment in Year 5 that would “...analyze the publication and citation patterns of researchers at all Utah institutions to identify the level of interconnectedness before iUTAH is awarded and in year 4 of the award [to] indicate the connections between institutions, disciplines, and individuals that were stimulated by the iUTAH activities.”
In the past, we and others have cast a variety of analytical and visualization tools to help analyze research attributes (Porter et al., 2010). Such measurement tools fall generally in the category of bibliometrics (De Bellis, 2009), with special note of:
♦ Measures of citation diversity to help gauge interdisciplinary research knowledge interchange (Zhang, Rousseau, & Glänzel, 2016), including “Integration scores” (Porter et al., 2007; 2008), Rao-Stirling diversity (Rafols & Meyer, 2010; Stirling, 2007), and Diffusion scores (Carley & Porter, 2012; Garner, Porter, & Newman, 2014)
♦ Cross-research domain knowledge interchange (Kwon et al., under review; Porter et al., 2013)
♦ Science overlay maps to visually represent the diversity of publication, citation, or citing sub-disciplinary involvement (Carley et al., under review; Leydesdorff et al., 2013; Leydesdorff & Rafols, 2009; Porter & Rafols, 2009; Rafols et al., 2010; Riopelle, Leydesdorff, & Jie, 2014)
♦ Social networking analyses (de Nooy, Mrvar, & Batgelj, 2011), to observe collaboration patterns with visualizations (Garner et al., 2012; Leydesdorff, 2008)
Integration and Diffusion scoring, and the science overlay maps, use Web of Science Categories (WoSCs) as the basic unit of sub-discipline categorization (Leydesdorff & Bornmann, 2016). There are various approaches, and attendant issues (Glänzel & Schubert, 2003; Klavans & Boyack, 2009, 2016; Rafols & Leydesdorff, 2009), but the WoSCs offer suitable sub-disciplinary granularity to accord with a key National Academies report’s recommendations (National Academies, 2005). In our experience, granularity should match the study’s main objectives. Recently we have tuned journal assignments to focus on research knowledge interchange among Cognitive Sciences, Education Research, and associated Border Fields (Youtie et al., 2017). We have generated informative results that consolidated the 200+ WoSCs into four “meta-disciplines” to assess interest (citations) from the natural sciences to a US NSF social science program (Garner et al., 2013). Or, one can seek much finer grain, as Klavans and Boyack (2017) demonstrate using some 91,000 topics to predict grant funding prospects. For the iUTAH assessment, interest keyed on the extent to which Center participants collaborated across disciplines, for which the WoSCs provided a manageable categorization.
We have applied various research assessment tools in the course of different research assessments of US federal funding programs, particularly to gauge interdisciplinarity. These include Environmental Protection Agency Science to Achieve Results (STAR) projects (Porter et al., 2003), and NSF Research and Evaluation on Education in Science & Engineering (REESE—Porter et al., 2013), Human and Social Dynamics Program (HSD—Garner et al., 2013), and Research Coordination Networks (RCN—Porter, Garner, & Crowl, 2012; Garner et al., 2012).
What one cites in a paper depends on multiple factors, including relevance, disciplinary training, disciplinary norms, and awareness (c.f., De Bellis, 2009). For instance, in a past bibliometric analysis, we observed stark differences in influence of nanotechnology Environmental, Health, and Safety (EHS) research findings, as gauged by citation, within the larger nanotechnology research community (Youtie et al., 2011).
Turning to the assessment task at hand, we focus on connections among institutions, disciplines, and individuals that were possibly bolstered by iUTAH activities. iUTAH aims to strengthen science regarding management of the state’s water resources. The program brings together researchers, students, and stakeholders from multiple organizations and disciplines. A key aspiration is to generate collaborative, interdisciplinary research.
This paper reports on our efforts to combine and extend analytical and visualization tools to assess iUTAH’s contributions on multiple factors. We want to measure “connections” made across individuals, organizations, and disciplines, with express interest in variations by seniority (academic rank) and gender. We concentrate on research outputs and their impacts (in the form of citations); we do not address process data per se (i.e., no interviews or surveys of participants to document the nature of interactions).
We offer this study as a model of applying bibliometric tools to help assess the research outputs of a major center. It illustrates a quasi-experimental study design to provide practical comparisons that help gauge the effects of instituting the center. While one cannot generalize from a single such study, we offer it to suggest possible measurement approaches.
2 The Research Assessment
2.1 Design
The research assessment (Garner & Porter, 2017) sought to measure changes in collaboration practices and publication patterns catalyzed by iUTAH, as well as their impact, in terms of extent of citation. This paper emphasizes considerations in measuring and depicting the collaboration attributes.
To achieve suitable comparisons, we determined to implement a quasi-experimental design (Campbell & Stanley, 1963). This approach is modeled on randomized experimental designs, adapted to real-world possibilities (c.f., Peck, 2016). Our approach is a “non-equivalent control group, before—after” design (Cook & Campbell, 1979). The intent is to generate a family of informative comparisons to document the effects of participation in iUTAH relating to research outputs and collaboration patterns. There are two comparative dimensions to this assessment design:
♦ Time—comparing Before to After metrics for iUTAH subjects (and for the comparison groups)
♦ Group—benchmarking iUTAH results against two suitable comparison groups.
For the temporal comparisons, we used 2010-2012 as the Before period and 2014-2016 as After. We set aside 2013 as ambiguous with respect to research publications that are apt to reflect participation in the iUTAH project.
Lacking a randomly assigned control group equivalent to iUTAH researchers, we worked to develop reasonable “comparison groups.” Our first comparison group consisted of participants in two Utah-based university centers comparable in terms of environmental science emphases. Comparison Group 1 (CG1) consists of researchers associated with Interdisciplinary/integrated Research Centers (IRCs) in Utah. We chose two research centers from which to draw this sample—the Ecology Center (EC) at Utah State University (USU) and the Global Change & Sustainability Center (GCSC) at the University of Utah (UU)—these being two major research universities involved in iUTAH. EC and GCSC were selected as prominent centers with commensurate (not identical) interests relating to environmental sciences. EC has some 70 participating faculty (with some overlap with iUTAH) and has been in operation since the 1960’s. GCSC is newer and also has some of its faculty participating in iUTAH. Researchers participating in both iUTAH and EC or GCSC could be included in our sampling as iUTAH.
For our second comparison group (CG2), we sought individual researchers with similar disciplinary ties but not associated with iUTAH or CG1. For purposes of this article, CG2 is of less interest in that substantial collaboration among an arbitrary set of collegial researchers would not be expected to increase markedly in the time periods studied. We note CG2 here for completeness, and draw limited comparisons.
The general hypothesis is that participation in iUTAH increases collaboration and the degree of interdisciplinarity in the research of its members. Testing of the hypotheses of changed publication outputs, citations received, and especially, collaboration patterns centers on comparing the treatment and comparison groups, Before and After. The ideal pattern would show minimal change over time for the comparison group vs. an increase for the iUTAH subjects.
We selected, in a non-random fashion, but without preconceived bias, a group of 45 tenure-track iUTAH researchers whose involvement spanned the length of the project. For practical purposes, these are nearly all the possible iUTAH participants as the dozen or so others mostly have special attributes (e.g., in faculty status or more limited involvement). We then matched them with random samples of equal size drawn from CG1 and CG2, and stratified according to institution, discipline, rank, and gender. The assessment report to iUTAH provides full details on how we composed the researcher samples.
In addition to USU and UU, the iUTAH sample also involved researchers at Brigham Young University (BYU) and several Primarily Undergraduate Institutions (PUIs): Utah Valley University; Weber State University; USU branch campuses; and Salt Lake Community College (SLCC). However, CG1 lacks PUI representation because those centers do not involve PUI researchers. Our intent was to do preliminary analyses on the PUIs in iUTAH and in CG2 to compare and determine further analytic strategies regarding this small number of researchers, because we hypothesized that PUI faculty may be more significantly impacted by participation in iUTAH.
2.2 Data
To address the assessment objectives, we compiled publication outputs in the form of abstract records gathered from two major research databases—Web of Science (WoS) and Google Scholar (GS). GS searches were conducted separately for each researcher (author) by first looking for a GS profile; if one existed, we extracted each article posted since 2010. If we did not find an author profile, then we searched for articles with that author name and extracted those. This was followed by manual checking to disambiguate author names, facilitated by using author affiliation information. Resulting records were formed into a single data set file by merging all 45 authors’ records into one GS set for each of the three groups (iUTAH, CG1, and CG2). Those files were pruned to remove duplicate records (e.g., co-authored records captured more than once).
WoS data were gathered and consolidated via corresponding processes to yield separate data sets for iUTAH, CG1, and CG2. We then merged the WoS and GS data sets for each research group, cleaned the resulting files by removing redundant information and formatting, and de-duplicated the cleaned files based on record (article) titles, removing the GS records where there was a corresponding WoS one.
Of the 45 faculty members in each group, not everyone published in each period. Total counts for GS analyses are limited to papers not also indexed in WoS. GS publications are diverse—we extracted distinct source titles for 630 of 868 GS records for 2014-2016. Those are somewhat noisy (not as consistent nor as clean as WoS fields of information). Nearly all are scholarly in nature. For instance, the five source titles occurring most frequently in these GS records are AGU Fall Meeting Abstracts, EGU General Assembly Conference Abstracts, 2014 GSA Annual Meeting in Vancouver, British Columbia, Proceedings of the Water Environment Federation, and Climate Dynamics.
Some general data attributes deserve noting. Average publication and citation values are of interest, but, as expected, those data tend to be highly skewed. Thus, analyses need to proceed with some caution. Publications range as high as 150 for one author. Of the 3,308 records (articles, etc.) in the full data set, 1,484 show no citations (but recall that the 2014-2016 papers have not had a great amount of time in which to be cited); one book has received 1,043 cites (a CG1 researcher co-authored it).
3 Publication and Citation Results
3.1 Research Output and Impact Comparisons
While this article focuses on discerning and depicting collaboration patterns, we first present the basic program research output and impact results to provide essential content (see Table 1 ). The first row shows how many of the 45 researchers in each group published one or more papers in the Before (2010-2012) and After (2014-2016) time periods. The next three rows show the publication counts—Total (from GS or WoS combined); Total from GS (excluding WoS duplicates); and Total from WoS.
Table 1 Publication and citation metrics of authors in three groups of environmental researchers from Utah, 2010-2016. |
| Publications | 2010-2012 | 2014-2016 | ||||||
|---|---|---|---|---|---|---|---|---|
| iUtah | CG1 | CG2 | iUtah | CG1 | CG2 | |||
| # of group authors with papers | 45 | 44 | 40 | 45 | 45 | 36 | ||
| Total Records | 702 | 636 | 293 | 788 | 666 | 295 | ||
| Total from GS | 431 | 367 | 166 | 407 | 337 | 165 | ||
| Total from WoS | 271 | 269 | 127 | 381 | 329 | 130 | ||
| Average Times Cited | 9.55 | 12.81 | 10.02 | 2.68 | 3.65 | 2.60 | ||
| Average Times Cited GS | 6.49 | 7.33 | 6.62 | 1.13 | 4.06 | 1.75 | ||
| Average Times Cited WoS | 14.42 | 20.49 | 14.46 | 3.81 | 5.13 | 3.52 | ||
| Median Times Cited | 2 | 3 | 1 | 0 | 0 | 0 | ||
| Median Times Cited GS | 0 | 0 | 0 | 0 | 0 | 0 | ||
| Median Times Cited WoS | 9 | 9 | 4 | 2 | 2 | 1 | ||
| Cites/Year WoS | 2.43 | 3.47 | 2.35 | 2.39 | 3.08 | 1.92 | ||
| H-Index | 35 | 42 | 22 | 19 | 22 | 14 | ||
| H-Index GS | 26 | 26 | 15 | 13 | 11 | 10 | ||
| H-Index WoS | 29 | 36 | 18 | 17 | 20 | 12 | ||
| Integration score | 0.535 | 0.457 | 0.428 | 0.523 | 0.489 | 0.468 | ||
♦ Attracts more prolific researchers (more papers in the Before period than the individual CG2 researchers)
♦ Boosts research productivity (both iUTAH and CG1 groups increase productivity in the After period, but we note that the CG1 centers were already operating in the Before period)
iUTAH participation appears to boost publication in leading journals (i.e., those indexed by WoS) more than does participation in the CG1 centers—i.e., the iUTAH publication rate in the After period exceeds that for CG1.
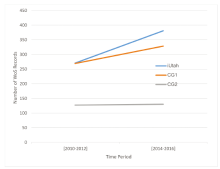
Figure 1. Publications indexed by Web of Science for authors in three groups of researchers from Utah, 2010-2016. |
Citation comparisons are more difficult to interpret (Table 1 ). Publications in the Before period have much more time in which to accrue citations than do those in the After period. Also, citation data are highly skewed, so averages are influenced heavily by relatively few highly cited papers. Furthermore, citation rates vary by field, so uneven disciplinary concentrations could favor one group over another. Inspection of Table S-1 shows general correspondence between the leading WoSCs of iUTAH and CG1 publications, so that field propensities to citation are likely not to be too different. However, the CG2 WoSC distribution differs more, and the CG2 publication counts are considerably less robust. Too much should not be made of the relative citation rate for CG2.
All that said, the general pattern shows CG1 publications to be more heavily cited, both Before and After. iUTAH and CG2 show relatively similar citation profiles. Again, interpretation of relative center participation impacts is not symmetric in that CG1 operated in both the 2010-2012 and 2014-2016 periods whereas iUTAH operated only in the 2014-2016 period.
H-index is one approach to reduce extreme influences of outlier high value items (Hirsch, 2005). It reports the number of publications receiving at least that many citations. Traditionally, the H-Index is applied to individuals; here, we adopt it for groups of individuals. Using this citation metric, CG1 generally leads, with iUTAH second.
Calculating citations on the basis of years since publication provides more comparable Before vs. After comparisons. Figure 2 shows average cites/year from publication through 2016. This was calculated by taking the times cited for a given year and dividing by the current year minus the given year. i.e., a paper in 2011 with 12 cites is calculated as 12/[2016.5-2011] which gives a result of just over 2 cites per year. These results are then taken together to give an overall average per time period. Using this measure, CG1 retains its citation lead, but iUTAH shows a relative gain in the After period, compared to CG1 or CG2.
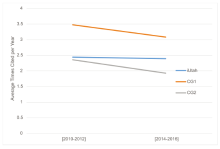
Figure 2. Average times cited per year since publication (based on Web of Science) for authors in three groups of researchers from Utah, 2010-2016. |
We also broke out publication and citation activity by gender and rank (Garner & Porter, 2017), although this is not a focus of this paper. We do, nevertheless, note a few interesting results (see supplemental figures S-7a, b):
♦ iUTAH Assistant Professors published more in the After period, while Full and Associate Professors’ publications held relatively constant; this result supports an aim of the project to stimulate early-career faculty’s research.
♦ Within iUTAH, Full Professors’ papers tended to be more interdisciplinary than those of more junior faculty, in both the Before and After periods.
3.2 Interdisciplinarity
The bottom row of Table 1 presents Integration scores (Porter et al., 2007; Porter, Roessner, & Heberger, 2008). Those reflect the diversity of WoSCs cited by a given paper. A higher Integration score reflects greater 1) Variety (the cited journals being in different WoSCs), 2) Balance (rather than being heavily concentrated in one or a few WoSCs), and 3) Disparity (how distant those cited WoSCs are from each other based on 2015 journal-to-journal cross-citation propensities). An Integration score of 0 would indicate that all of a paper’s references that were indexed by WoS were in a single WoSC; a score approaching 1 would be extremely diverse (i.e., drawing on widespread sources of research knowledge).
iUTAH Integration scores are statistically significantly higher than each comparison group, both for the Before and After periods, at the 0.001 level, by one-tailed t test. This suggests that researchers participating in iUTAH are more inclined toward interdisciplinarity, rather than the iUTAH experience boosting interdisciplinarity of its researchers’ papers.
We also sought to discern the variety of fields in which these researchers publish. Science overlay maps (Rafols, Porter, & Leydesdorff, 2010) provide a means to show the distribution of the WoSCs of their publication journals. We generated science overlay maps for each of our three groups, for both periods (available in the Supplemental Materials, along with Table S-1 tallying the number of papers in leading WoSCs by each group, in each period). The most striking observation is that research emphases held quite stable over time.
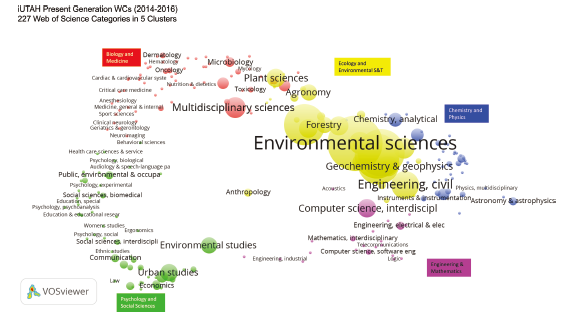
Figure 3. iUTAH publications overlaid on a science map based on Web of Science categories, 2014-2016. |
4 Collaboration Patterns (Social Network Analyses)
Figures 5 and 6 convey the most compelling results of our research assessment —a marked increase in collaboration attributable to participation in iUTAH activities. These charts contain four quadrants somewhat unequal in size and shape—separated by hand-drawn dashed lines), representing the institutions engaged—UU, USU, BYU, and PUIs. Nodes represent individual researchers, with larger nodes indicating more total publications (Google Scholar and WoS combined). Researcher positions are consistently maintained in both figures. Heavier lines indicate more co-authored publications. Versions of the figures for the report to the iUTAH Center include researcher names to provide explicit co-authoring information; here names are removed to protect identities.
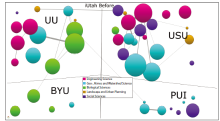
Figure 5. Co-Author map of iUTAH researchers for the Before period (2010-2012), separated by institution and discipline. |
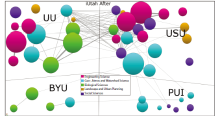
Figure 6. Co-Author map of iUTAH researchers for the After period (2014-2016), separated by institution and discipline. |
Contrasting Figures 5 and 6, we note a substantial increase in networking within universities among many of the iUTAH participants (not all). This is pronounced for UU and USU, but less so for BYU and the PUIs. Even more dramatic is the large increase in connections between UU and USU colleagues in the After period.
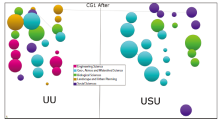
Likewise, Table 2 comparisons between iUTAH After and CG1 After show large differences here, as also shown in comparing Figures 6 and 8. For one measure, total links in iUTAH After are 122 vs. 4 for CG1 After—i.e., heavy vs. minimal co-authoring among the respective groups of 45 researchers. Average degree or density comparisons are similarly extreme.
Table 2 Networking statistics within Utah researcher cohorts. |
| iUTAH | CG1 | ||||
|---|---|---|---|---|---|
| Before | After | Before | After | ||
| Average degree | 1.2 | 5.422 | 0.133 | 0.178 | |
| Density | 0.027 | 0.123 | 0.003 | 0.004 | |
| Total links | 27 | 122 | 3 | 4 | |
| Links within discipline | 12 | 63 | 3 | 3 | |
| Links across discipline | 15 | 59 | 0 | 1 | |
| Links within rank | 12 | 48 | |||
| Links across rank | 15 | 74 | |||
| Links within gender | 17 | 63 | |||
| Links across gender | 10 | 59 | |||
| Links within university | 24 | 14 | |||
| Links across university | 3 | 108 | |||
Figures 5 and 6 also color code the five disciplinary groupings within iUTAH. Focusing for a moment just on the USU and UU researchers:
♦ Of 20 USU faculty in our sample, most show multiple links to other researchers; only two show no collaborations with iUTAH colleagues on their publications in the After period.
♦ Of 13 UU faculty, about half show multiple links; only two do not show any collaborations with other iUTAH colleagues in the After period.
♦ We see heavy interconnections between ‘core’ researchers in UU and USU in the After period, implying a change attributable to participation in the iUTAH project.
♦ Interdisciplinary connection density, the USU “core” of heavily interconnected researchers in the After period, includes all five disciplines. The UU “core” taps four of the disciplines. Collectively, this supports an assertion of high interdisciplinary connection, not “silos” of disciplinary sub-groups.
♦ The cross-disciplinary interconnection appears much weaker for the four BYU and eight PUI participating researchers.
Figures 7 and 8 provide the counterpart CG1 comparisons. [We choose to omit these analyses for CG2 as there is no reason to anticipate substantial collaboration among those individual researchers randomly assigned to a comparison group.] We see surprisingly little collaboration in CG1, considering that these are researchers associated with integrated environmental research centers. Since those are single university centers, we would not expect much UU-USU linkage. Also, BYU and the PUIs are not engaged in these centers. It is striking, since GCSC and EC were active in both periods, that the paucity of co-authoring sharply contrasts to the After period in which iUTAH was active (Figure 6 ).
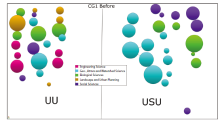
Figure 7. Co-Author map of CG1 researchers for the Before period (2010-2012), separated by institution and discipline. |
Supplemental Figures S-6a and S-6b display iUTAH researchers by gender; we did not observe remarkable differences in group engagement of men versus women. Figures S-7a and S-7b are counterparts of Figures 5 and 6. They color-code rank instead of discipline. The impression is that USU has been more successful compared to other institutions in engaging their early-career faculty in research collaboration.
5 Discussion and Conclusions
Substantively, we describe the publications, and citations to those publications, emanating from the researchers actively involved in the iUTAH project. We are expressly interested in the cross-disciplinary nature of the research, and show that it, indeed, engages many disciplines.
Figure 8. Co-Author map of CG1 researchers for the After period (2014-2016), separated by institution and discipline. |
Moreover, we have run several quasi-experimental comparisons to compare those iUTAH research outputs to other environmental center participants (CG1) and to a matched set of individual researchers at Utah universities (CG2). These indicate that the iUTAH cohort participants are highly productive (equivalent to CG1; higher than CG2 researchers) prior to engaging in iUTAH, and that their publication activity appears to be increased by iUTAH involvement. CG1 publications in the 2010-2012 period attract somewhat more citations than the papers of researchers who join iUTAH (this is the Before period) or of those in the CG2 group. In the After period, 2014-2016, the iUTAH publications show a moderate gain relative to the others.
We note certain limitations in these analyses. This is a quasi-experimental study, so comparisons are somewhat guarded in the absence of randomized control (which is not plausible in such a real case environment). Given the realities of composing an interdisciplinary research organization, such a design is certainly in order. [i.e., researchers are not amenable to being randomly assigned to join research centers or not.] We sought best available comparisons, but have noted limitations; for instance, the CG1 centers were operating during the period Before iUTAH began work. WoS coverage of publications in the After period are not as complete as for the Before period, due to lags in indexing. More serious, as discussed, citations accrued by those publications are more severely truncated for the After period. Such limitations are reasonably compensated by having the cross-group comparisons of iUTAH to CG1 and CG2. Tallying citations is problematic in several regards, some already noted (e.g., field differences). Fixed citation windows offer advantages vis-à-vis citations per year. Citation rates change over time and recent periods are apt to be less completely indexed by WoS.
Before vs. After citation comparisons are clouded by difficulties in adjusting citation propensities fairly (Zhang et al., 2017). We use cites per year since publication, but see advantages in the alternative of cites in 10 (or five) years post-publication. Hall et al. (2012) compared tobacco research center vs. individual grantee (National Institutes of Health R-01) publication rates. They too found that center researchers published more, but only after four years of project support (before that they lagged). Further assessment might want to compare citations received on a year-by-year basis. Gathering data on the year in which the citing document was published would enable such comparisons. We did not have those data; they require capturing information on each citing document individually. In contrast WoS readily provides consolidated “Times Cited” information within the abstract publication record, and that is what we used in this study.
One of us noted the apparent disconnect between collaboration and interdisciplinarity, as gauged by Integration scores. Presumably, cross-disciplinary collaboration offers a route to garner insights from the multiple disciplines represented; so Integration scores that measure diversity of references cited in a paper might be expected to increase. For our iUTAH researchers, collaboration within the 45 researchers escalates from Before to After, but Integration scores do not. As shown in the bottom row of Table 1 , those scores do not change significantly. However, Integration scores do increase from Before to After for CG1 and CG2.
This lack of an apparent correlation between Integration scores of the papers and extent of within-group collaboration caused us to consider collaboration more broadly. While not the focus of this assessment that seeks to gauge change in within-group (the 45 iUTAH researchers) collaboration, one could examine collaboration generally. We introduce this here briefly to suggest future research potential in analyzing overall, as well as local, collaboration patterns. Table 3 offers some basic comparisons.
In brief, the After period papers of both center groups (iUTAH and CG1) show more authors per paper and more author affiliations (these are calculated at the organizational level; it was too difficult to measure departmental affiliations uniformly from the WoS records) per paper. The iUTAH increase in organizational affiliations is consistent with the expansion of cross-Utah organizational ties from Before to After (Table 2 ). Not an issue here, but we did run across articles with “mega” authoring (i.e., hundreds on a paper) in preliminary searches. Were those in one’s data set, they pose assessment challenges in discerning their degree of relationship (say to Center engagement) and statistical oddities.
To sum up, methodologically, we offer a multi-attribute suite of analytical and visual elements to help assess research outputs and impacts. Of particular interest are measures of research collaboration. We believe the combination of representations provides important, complementary perspectives. In particular, we find Figures 5 and 6 effective in capturing research networking attendant to interdisciplinary center activities. Without undue complexity, they graphically show changes from Before to After, and by comparing to counterpart figures for a comparison group, differences between iUTAH and CG1 here. In a presentation to an “All-Hands” meeting of iUTAH participants (July, 2017), they communicated effectively. These figures also show the nature of cross-organization and cross-disciplinary connections made among a group of researchers. [Supplemental figure variants do likewise for gender and ranks.]
The “take-away” from this study for others is a model of multiple measures of research outputs (publication characteristics) and impacts (citation characteristics). These could be adapted to meet assessment needs of other studies for which cross-disciplinarity and research collaboration are vital elements. In our view Figures 5-8, the co-author maps, are most novel—offering a concise way to communicate several facets of collaboration concisely. Perhaps this warrants consideration as a bibliometric assessment case study?
Author Contributions
Jon Garner (jon.garner@searchtech.com) performed most analyses and devised the novel graphics. Alan Porter (alan.porter@isye.gatech.edu, corresponding author) led the study design and the drafting. Andreas Leidolf (andreas.leidolf@usu.edu) and Michelle Baker (michelle.baker@usu.edu) led the sampling and contributed to design, analyses, review, and editing.