

① This is an adapted study based on my ISSI 2019 conference contribution (Fassin, Y., 2019), entitled “The compound F²-index as extension of the f²-index in a dynamic perspective: An application in Corporate Governance research”.
1 Introduction
Thanks to its simplicity, Hirsch’s h-index has become a widely adopted indicator in science (Hirsch, 2005). The h-core of a dataset with an h-index of h represents the h articles that have at least h citations (Rousseau, 2006; Sanz-Casado et al., 2016). Some alternatives to the h-index have been presented, as the h²-index (Kosmulski, 2006) or the g-index (Egghe, 2006), The related h²-index corresponds to the h articles that have at least h² citations (Kosmulski, 2006). The g-index is defined as “the unique largest number such that the top g articles received together at least g² citations” (Egghe, 2006). Just as the h-index, most of those h-related indicators have a static character that do not reflect the dynamics of bibliometrics.
Despite its wide diffusion, the h-index (Hirsch 2005) has received a lot of criticism and presents serious drawbacks (Costas & Bordons, 2007; Waltman & Van Eck, 2012). The lack of differentiation and the lack of acknowledgement of highly-cited papers, have been criticized by many authoritative bibliometric scholars (Bornmann, Mutz, & Daniel, 2008; Bouyssou & Marchant, 2011; Costas & Bordons, 2007). Besides these drawbacks, the difficulty for inter-field comparison has posited the quest for normalization (Bornmann & Leydesdorff, 2018). A more recently proposed alternative, the f²-index, awards different weighted factors to the articles in function of their place in the citation distribution (Fassin, 2018). Other bibliometric scholars underlined the difficulty to grasp a complete oeuvre in a single indicator and suggested additional elements (Bornmann & Daniel, 2009).
While bibliometric citations evolve over time, indicators also vary over the years. The author’s h-index continuously increases over the years, which advantages established scholars. In order to cope with this problem, some evaluation panels make use of the indicators applied to a certain time-window such as the last 10 years, or the last 5 years, or the last 2 years. But these “recent” indicators disadvantage older researchers who made impactful contribution in their field in previous years.
In this article, an extension of the f²-index to a compound F²-index is developed to integrate the dynamic aspect in bibliometric research. A similar method is applied to the h-index. An activity index is defined to evaluate the proportion of the recent contribution in a scholar’s career performance.
The method is tested and illustrated with a practical application to a specific field of management research, selected for its limited size and its young but mature stage: governance. Corporate governance refers to the system of rules, practices, and processes by which a firm is directed and controlled (OECD, 1999). Corporate governance principles try to balance and align the interests of shareholders and management and other company stakeholders (Aguilera et al., 2008). From an academic perspective, the research agenda has evolved in the last decades to develop corporate governance as a real discipline. Durisin and Puzone (2009) provide a first bibliometric study in the main specialized journal Corporate Governance An International Review (CGIR). They map the intellectual structure of corporate governance research and its evolution since 1993 to 2007 and conclude to the maturation of a specific field with its distinct subfields.
A more comprehensive study of the status and evolution of a field focuses on the main research questions of exploratory nature: Who are the most influential authors in the field? Who are the scholars with increasing impact? And who are the rising stars in the field?
2 Methodology
Classic bibliometric studies have focused on number of articles, independently of their number of citations; while many articles do not gain much references, and have little impact. Other studies re-centered their analysis around citations and thus privileges mainly the contribution of the top articles irrespective on the theme that is treated.
2.1 The gh-rating as a innovative bibliometric methodology
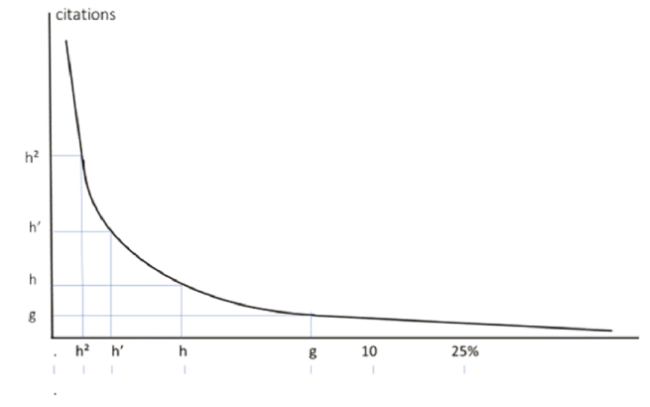
To execute a more qualitative view on the impact of academic journals, a more advanced analysis of the distribution of the publications can be executed. It follows a recent methodology based on the ghent-rating or gh-rating that categorizes all articles in categories in function of their citation distribution as presented in Figure 1 (Fassin, 2018).
Figure 1. Citation distribution and gh-categorization (Fassin, 2018). |
The various grades (from AAA to E) depend on their relative position in the distribution of citations: all articles situated in the top 50 % (D), top 25 % (C), top 10 % (B), and top 5 % (BB). To have a better insight on the most influential articles, the top 2, 1, and 0.5% are also determined, as well as the h-core (A) and the h²-core (AAA) of the sample, and the g-core (BA) (Egghe, 2006).
2.2 The f²-index
The author’s fame-index or f²-index (Fassin, 2018) is calculated as the weighted sum of the articles within the author’s h²-core with the weighted factor determined by the field percentile categories. Applied to a simplified categorization of a researcher’s articles (into A, B, C, and R categories with respectively a, b, c, and r articles), the f²-index or fame-index is thus defined as
f² = 2a + b + c/2 + r/4 + 2aaa
with a + b + c + r limited to the author’s h²-index. The weighted factor is defined by a mathematical sequence: 4, 2, 1, ½ and ¼ with the 10% percentile (i.e. B) given the “normal” weight of 1. Articles within the h-core of the field (A) are weighted by a factor of 2, those in category C by a factor of 0.5 and those in category R by a factor 0.25. Those in the highest AAA category receive an overall weighted factor of 4 (additional weight of 2 as already 2 in A category). This fame-index takes into account the relative influence of each paper as defined by its category, while the author’s h-index awards an equal weight to each article in the h-core.
2.3 The dynamism aspect and recent contribution
Most rankings are static; also the f²-classification is static; it describes the situation on a specific momentum. But research is dynamic by nature, and consequently, bibliometrics data evolve over time; citations continue to grow, new articles are published by established scholars and by new participants, as Ph.D. researchers. In order to have a better view on this evolution, a similar analysis can be executed on the data of the recent years; those data can give fruitful additional information. The f²’-index is calculated on the basis of the publications in the last (full) 5 years, positioning in the according field distribution limited to those articles of the last 5 years; that distribution list does not include the new citations of older papers. For this f²’-index, seen the smaller number of articles, the simplified reduced formula can be used: the number of articles in the 10%-percentile and those in the h’-core receive one additional point (and no additional for the h²’-core of the recent set, in order to reduce the effect of double count, as those papers will have benefited in the overall category, generally already in the 10%). This f²’-classification can differ from the overall or career f²-classification; it also includes the active scholars and identifies and the newcomers in the field.
Another criterion for more recent contribution is given by the HCP highly-cited paper selection of the Web of Science, that distinguish the papers in the last 10 years that belong to the 1% most cited in their (broad) field.
2.4 The compound F²-index
In order to present a more dynamic description, a new indicator should provide a combination of the career indicator and the recent indicator. It should conform to two major constraints: as the career indicator should keep the largest contribution for established authors, the combined indicator should not exceed the career indicator by more than 50%. For younger scholars with a low career indicator, the bonus can be higher but should allow a smooth transition when the best recent articles leave the recent period.
A compound F²-index is introduced; it is calculated by the sum of the career f²-index, the 5 years f²’-index and the number of highly cited papers (HCP), within certain limits.
F² = f² + f²’ + HCP
As precautionary measure, resulting from simulations, a few limitations were introduced to this calculation. The maximum bonus cannot exceed 50% of the f²-index of the top 50 ranked researcher of the f²-indexes ranking. That criterion determines a minimal threshold for the f²-index above which the bonus is limited to 50%. For lower ranked authors, the bonus is limited in absolute terms to half of this threshold.
The rationale behind this somewhat arbitrary limitation (based on simulations) is to avoid excesses and to create more consistency and stability. The 5-years f²’-index indeed privileges the highly-cited papers of the recent years, generally those that are in the years y-5 and y-4. In the calculation of the compound F²-index, those papers can benefit from three different classification: as a 10%- in the overall classification, as a h’-core in the recent classification and as a HCP; this gives them respectively 1, 2, and 1 point, so 4 in total, the same as h²-papers. When those papers will disappear in the next year, they will gather only 2 or 3 points if they have reached the h-core in the meanwhile and if they stay in the highly-cited papers. So, the 5-years classification offers a temporary advantage that needs to be confirmed later, when the paper continues to attract additional citations and gradually increase its weighted factor. As over time, the h²-index further increases and consequently the f²-index, the impact of promising publications will remain more stable. For lower ranked scholars, the relative impact of recent papers will be higher than for those in the higher ranked classification.
2.5 The activity-index
In fact, now an activity-index or activity-ratio can be defined, namely the ratio of the recent f²’-index to the compound F²-index.
Af = f²’/F²
Af equals 0 for researchers who are no longer active; it lies in between 0 and 1 for all active researchers. A higher Af-index will signify that the researcher has made most of their contribution in the recent years; indeed, the recent f²’-index is higher than the career f²-index, as it is calculated from the recent distribution thresholds, that are much lower than the overall distribution thresholds. A low Af-index will mean that the recent contributions of the author are not of the same impact yet than their older publications.
3 An application to the scientific output in the field of corporate governance
The original search query for “corporate governance” in the Web of Science, restricted to the science categories business, management and ethics, leads to a selection of 3,686 articles written till 2018, by 1,235 different authors; together 43,351 citations (average is 11.8 citations per article).
Table 1 Number of publications in corporate governance per gh-percentile category. |
| Category | AAA | AA | A | BA | BB | B | C | Z |
|---|---|---|---|---|---|---|---|---|
| n | h² | h/2 | h | g | 5% | 10% | 25% | 100% |
| CG field | 16 | 42 | 83 | 208 | 184 | 369 | 922 | 3,686 |
| CGIR | 7 | 19 | 37 | 89 | 42 | 84 | 210 | 841 |
| CG rec | 7 | 14 | 27 | 74 | 86 | 172 | 430 | 1,722 |
Table 2 Citation thresholds in corporate governance per gh-percentile category. |
| Category | AAA | AA | A | BA | BB | B | C | D | E | F | Z | |
|---|---|---|---|---|---|---|---|---|---|---|---|---|
| thresholds | max | h² | h/2 | h | g | 5% | 10% | 25% | 50% | 75% | 90% | 100% |
| CG field | 896 | 264 | 141 | 83 | 45 | 49 | 28 | 11 | 2 | 0 | 0 | 0 |
| CGIR | 160 | 61 | 48 | 37 | 23 | 36 | 23 | 13 | 6 | 1 | 0 | 0 |
| CG rec | 153 | 57 | 41 | 27 | 15 | 13 | 9 | 3 | 1 | 0 | 0 | 0 |
Who are the most influential researchers in corporate governance? Bibliometric studies traditionally start from two predominant methods: the list of the most productive authors in a field in Table 3 —those with the most publications (excluding editorials)—and the list in Table 4 of the most influential authors—those authors who have received most citations to their publications.
Table 3 Productivity ranking. |
| Researcher | n |
|---|---|
| Filatotchev | 38 |
| Zattoni | 38 |
| Aguilera | 30 |
| Wright M | 26 |
| Kumar P | 26 |
| Judge WQ | 26 |
| Westphal | 25 |
| Peng MW | 21 |
| Yoshikawa | 20 |
Table 4 Total citations ranking. |
| Researcher | tot cit |
|---|---|
| Peng MW | 3271 |
| Wright M | 3140 |
| Aguilera | 3062 |
| Hoskisson | 2996 |
| Westphal | 2905 |
| Filatotchev | 2724 |
| Zajac | 2293 |
| Dalton DR | 1847 |
| Daily CM | 1594 |
Those lists illustrate some similarities but also huge differences between those rankings. Half of the top 20 in productivity appear in the top 20 of citations. 5 out of the 7 most cited authors belong to the most productive authors. But 5 of the most productive authors have not yet reached the top 20 in citations.
Another categorization following the h-index of the researchers is presented in Table 5 . That list combines scholars from both previous rankings. The next Table 6 presents the ranking based on the career f²-index. In the field of corporate governance, the career f²-index of the top 50 ranked researcher reaches 6. Following the constraints, the bonus for the f²’-index is thus limited to 50% for researchers with a f²-index higher than 6, and to 3 for lower ranked authors.
Table 5 The h-index ranking. |
| Researcher | h |
|---|---|
| Filatotchev | 26 |
| Westphal | 19 |
| Aguilera | 18 |
| Peng MW | 17 |
| Wright M | 16 |
| Zattoni | 15 |
| Dalton DR | 11 |
| Yoshikawa | 11 |
| Hoskisson | 10 |
Table 6 The f2-index ranking. |
| Researcher | f2 |
|---|---|
| Peng MW | 23.5 |
| Westphal | 21 |
| Aguilera | 20.5 |
| Zajac | 19 |
| Filatotchev | 18.5 |
| Hoskisson | 17 |
| Wright M | 16.5 |
| Dalton DR | 15 |
| Daily CM | 14.5 |
Table 7 Key indicators and citation distribution of leading corporate governance researchers. |
| Researcher | tot cit | indicators | distribution | recent distribution | f²indexes | |||||||||||||||
|---|---|---|---|---|---|---|---|---|---|---|---|---|---|---|---|---|---|---|---|---|
| h | h² | h’5 | h²’5 | H | H² | n | 25% | 10% | g | h | h² | HCP | n’ | 10%’ | h’ | f² | f²’ | F² | ||
| Peng MW | 3,271 | 17 | 9 | 8 | 3 | 25 | 12 | 21 | 17 | 11 | 9 | 8 | 3 | 4 | 8 | 8 | 3 | 23.5 | 8 | 35.25 |
| Aguilera | 3,062 | 18 | 9 | 10 | 5 | 28 | 14 | 30 | 17 | 13 | 8 | 7 | 2 | 4 | 13 | 7 | 4 | 20.5 | 8 | 30.75 |
| Filatotchev | 2,724 | 26 | 9 | 6 | 3 | 32 | 12 | 38 | 30 | 15 | 8 | 7 | 1 | 2 | 9 | 5 | 3 | 18.5 | 7 | 27.5 |
| Westphal | 2,905 | 19 | 10 | 2 | 2 | 21 | 12 | 25 | 21 | 17 | 11 | 8 | 1 | 4 | 2 | 1 | 21 | 3 | 24 | |
| Van Essen | 457 | 8 | 5 | 5 | 3 | 13 | 8 | 11 | 7 | 5 | 2 | 1 | 2 | 4 | 2 | 6.5 | 6 | 9.75 | ||
| Zattoni | 779 | 15 | 6 | 8 | 4 | 23 | 10 | 38 | 15 | 5 | 3 | 2 | 27 | 6 | 1 | 8 | 5 | 12 | ||
| Daily CM | 1,594 | 8 | 8 | 0 | 0 | 8 | 8 | 8 | 8 | 8 | 5 | 4 | 1 | - | - | - | 14.5 | 0 | 14.5 | |
The rankings according to various indicators are presented in Table 8 with the Af activity ratio.
Table 8 Ranking following the f2-index and Af-index. |
| Researcher | r cit | r n | r f² | r f3’ | r F2 | r h | r h2 | r h’ | r H | r H² | Af | Ah | Ah2 |
|---|---|---|---|---|---|---|---|---|---|---|---|---|---|
| Peng MW | 1 | 8 | 1 | 1 | 1 | 4 | 4 | 5 | 3 | 2 | 0.23 | 0.47 | 0.33 |
| Aguilera | 3 | 3 | 3 | 1 | 2 | 3 | 3 | 1 | 2 | 1 | 0.26 | 0.56 | 0.56 |
| Filatotchev | 6 | 1 | 5 | 3 | 3 | 1 | 2 | 5 | 1 | 2 | 0.25 | 0.23 | 0.33 |
| Westphal | 5 | 7 | 2 | 20 | 4 | 2 | 1 | 20 | 7 | 2 | 0.13 | 0.11 | 0.20 |
| Van Essen | T75 | 22 | 27 | 4 | 19 | 19 | 19 | 17 | 10 | 10 | 0.62 | 0.63 | 0.60 |
| Zattoni | 22 | 2 | 15 | 5 | 14 | 6 | 10 | 1 | 5 | 6 | 0.42 | 0.53 | 0.67 |
Three researchers, Peng, Westphal, and Aguilera who were already present in most rankings lead the f²-ranking. The recent f²’-index is led by Peng, Aguilera, and Filatotchev; then follow a few active scholars as Zattoni or newcomers as Van Essen. Some researchers as Daily did not publish in the last 5 years.
The dynamic aspect is illustrated with the compound F²-index, that adds the effect of promising recent publications. Aguilera and Filatotchev follow Peng and surpass Westphal and Zajac who have been less productive in recent years. A few younger active scholars like Zattoni catch up with Dalton and Daily and others as van Essen make progress. The activity index highlights the contribution of younger researchers as Van Essen.
4 The advantages of the compound F²-index
The comparison between the career f² and the compound F²-classifications shows the evolution and the progress of the individual researchers compared to their peers. The data reveal the future trends. Even if the top 10 remains stable (the f²-classification advantages the well-known researchers), some ranks vary; especially the writers of HCP (less than 10 years old) and with a high recent f²’-index improve their position.
So, the F²-compound index illustrates the dynamism of a research field. It recognizes past achievements but also values new research work with potential. Those scholars who did not publish much in the last five years continue to benefit from their past publications, but will not substantially increase the gh-rating of their older publications (especially in categories A to AAA), while those researchers who published more in the last years benefit temporarily from the recent f²’-index and will gradually increase the gh-rating of their upcoming publications that will contribute more to the future f²-count.
The quantum approach used in this bibliometric method is quite selective and works at a double level. First, it allows an incremental climb in the rating of the individual articles, and secondly, it also grants an incremental rise of the number of articles that are taken into account, as these are limited by the scholar’s h²-index in this dataset. As a result, the f²-methodology will select mainly papers within the h-core or g-core in the selected dataset (A and BA-category), and to a lower extend those in the 10% or 25%-percentiles (B and C-category). Younger scholars will start with a few papers in the C or D-category, as their h²-index will be ranged between 2 and 3. To increase the number of papers to be taken into account necessitates to increase the h²-index; which signifies that a higher number of papers need to reach the higher classification, and means that papers in the lower category will not be taken into consideration anymore. To increase the h²-index from 6 to 7, needs an increase of citations of 6 papers from 36 to 49 and an additional 7th paper with 49 citations, which will generally imply that all papers are within the 10%-percentile or minimum B-category. In the compound F²-classification, this quantum mechanism works at both the level of the f²-index and the recent the f²’-index.
5 The compound H-index
The compound F²-index just as all f²-indexes need a careful calculation as the Web of Science nor Scopus does not yet provide the percentile categories. It is, therefore, worthwhile to search for a simplified alternative. Following similar reasoning, one could define a compound h-index, that better takes into account the recent contribution of academic articles. Indeed, the h-index is ever increasing over time, and thus privileges senior researchers. The career h-index benefits from an increasing number of publications and time further feeds higher citations for all publications, so that additional articles can reach the h-core and further increase the researcher’s h-index. Partial time-restricted h-indexes over the last 10 years (or 5 years of 2 years) on the contrary disadvantage senior researchers who do not publish anymore, while they privilege younger active authors.
If h is the career h-index of the scholar, and h’ their recent h’-index over the last 5 years, the compound H-index is defined as the sum of the career h-index and the recent h’-index
H = h + h’
The younger scholar whose main cited publications are published in the last 5 years can double their h-index, as all articles are taken into account, with equal weight. The senior professor who is not active in the last years will remain with their h-index; their compound H-index will be equal to their h-index.
5.1 The h-activity-index
A h-activity-index or ratio, based on the h and h’-index can also be defined. The Ah-index is the ratio of the recent h’-index to the career h-index.
Ah = h’/h.
Also, this activity index lies in between 0 and 1 for all researchers, 0 for non-active researchers, and higher for the younger researcher; it equals 1 for researchers who started to publish not more than 5 years ago. Contrary to the h-index that continuously rises over time, the h’-index is a dynamic indicator that changes over the years, and that diminishes if not fueled by new successful publications. Indeed after 5 years, the articles that have had the most time to gather citations disappear from the h’-core and are replaced by more recent publications that did not have the time yet to attract citations; which implies a lower level of h’.
Applied to the field of corporate governance, the Ah-index is presented in the last column of Table 8 . The recent h-index reaches 25 to 50% of the career h-index. But the career h-index of that young research field is limited to 20 to 30. However, fields as bio and health sciences or physics have much higher amounts of publications per researcher than in management; as a consequence, larger fields have substantially higher h-indexes. Top researchers in physics reach career h-indexes above 100, while their recent h’-indexes are at utmost 15. The proportional increase of the recent h’-ratio in the compound H-ratio tend to be marginal for older researchers in those well-established fields (under 10%).
5.2 The compound H²-index
As an alternative with a more selective character, the same principle can be applied to the h²-index. The compound H²-index is defined as the sum of the career h²-index and the recent h²’-index
H² = h² + h²’.
Career h²-indexes reach levels of 10 in smaller fields, up to 20 in larger fields, and up to 30 for a very limited selection of top researchers in larger fields; while it is much more difficult for the recent h²’-index to reach the level of 5 in five years time. So, the proportional increase for the leading researchers can raise up to 25%, while younger researchers can temporarily double their H²-index, but this is not sufficient to compensate for a career over decades. The distortion provoked by the incentive is thus mediated.
As the compound H²-index includes the variable h²’-index, also the H²-index can vary over the years and can diminish. The h²’ and H²-index thus introduce a dynamic aspect of the h²-index and constitute a fruitful complement to the h²-index. The Ah² activity-index defined as the ratio h²’/h² also presents an alternative complement to the h²-index and the h-index.
5.3 Comparison between the compound F²-index and the compound H-index
Returning to the f² and F²-indexes, there is a slight difference. Contrarily to the career h- and h²-indexes, the career f²-index does not automatically rise over time. Indeed, only the h²-core of the publications are taken into account, but those articles are assigned a weighted factor that can change over time. A publication published 25 years ago can belong to the h²-core of the field 15 years later, but if the impact has flattened in the last 10 years it will be overtaken by many other articles, so that it can fall into the h-core and later to the 5% or 10%- percentile, with lower weighted factors. Conversely, a top publication in the h²’-core has a serious contribution to the f²’-core and thus to the F²-index, but when arriving in its 6th year it will disappear from the f²’-core and F²-index and will contribute for a lower weighted factor to the f²-index.
The compound H- and H²-indexes can decrease, but not to the same degree as the F²-index. Indeed, the largest part of the compound H-indexes is the career h-index that does not diminish over time. A basic difference between the compound F² and H-indexes is that the career and recent H-indexes are compared to a fix framework with equal weights and equal thresholds, where the components of the F²-compound refer to two different distributions with unequal thresholds. The compound H²-index is more selective and differentiate to a larger extent than the compound H-index.
5.4 Limitations
Further empirical research should apply the proposal for new indicators to other fields, especially to larger fields. The results of this analysis could provide some adaption to the calculation, especially to the additional constraints for the compound F²-index: the somewhat arbitrary limit for doubling the f²-index (the f²-index of the top 50 ranked researchers) can be adapted according to the field under study; larger fields may put the threshold for the limit of the bonus to the top 100 researchers rather than 50.
The first calculations in bio-science and physics with high levels of the h-index show that the F²-compound index better acknowledges the work of younger researchers than the H-index. Indeed, the f²-activity ratio is higher than the H-ratio, as the number of articles (h²) that are taken into account with the calculation of the f²-index is smaller than that of the h-index.
The compound F²-index possesses more precision than the compound H and H²-indexes, but it needs more calculation, as the thresholds of citation distributions are not yet available on the databases Web of Science and Scopus. The compound H²-index is easier to calculate and represents an acceptable approximation of the compound F²-index. However, like many other indicators, the compound F² and H²-indexes are PAC, probably approximately correct (Rousseau, 2016). The result of this bibliometric analysis also depends on the limitations of the selections by databases and the choice of keywords. And as all indicators, they need to be used with caution (Hicks et al., 2015).
6 Conclusion
The present study permits to illustrate the advantages of a new bibliometric methodology with a practical application. This implementation of the f²-index to this particular field illustrates the prudent selectivity and discriminative power of the method. The classification following the f²-index mitigates between the classical ranking following the number of papers and the ranking following the total number of citations of those papers, and also between the h-index the h²-index rankings. Thanks to its quantum approach, the f²-methodology increases selectivity and turns out one-time contributions. The results presented in the rankings or classification in tiers show more consistency than other rankings.
With its extension of the f²-index to the compound F²-index that integrates the recent contribution and the application to form the compound H-index, the paper presents an innovation in bibliometrics as a tool to examine dynamism in citation analysis. Especially, the difference in ranking between the F² and f²-ranking offers a view of the dynamic evolution in the field at study. The classification on the basis of the compound F²-index can be applied to estimate the future f²-classification and to identify the rising stars. The study contributes to developing new methods to generalize the h-index to a more comprehensive indicator. Especially the activity index offers an interesting complement to the h-index as a good estimate that highlights the contribution of a researcher’s recent work. These new indicators illustrate the underestimated dynamic capacity of bibliometric research.