


1 Introduction
As a significant foundation for scientific innovation, research integrity has become a crucial issue worldwide. The advancement of scientific enterprise has resulted in increasingly fierce academic competition, with many researchers facing the enormous pressure of “publish or perish” (Ding, 2001). Regrettably, a handful of researchers have resorted to improper methods such as plagiarism and falsification in order to publish their papers and gain recognition. Once exposed, their misconduct has caused a ripple effect leading to the retraction of their papers, ultimately harming the academic reputation of scientific community (Tian & Song, 2015).
The number of retracted papers continues to increase (Tang et al., 2020), which has already attracted the attention of many researchers. Many studies have been carried out on retracted articles, analyzing the quantity changes, geographical distribution, journal distribution, reasons for retractions, and other basic characteristics of retracted articles. Initially, most of the early studies focused on retracted papers in life sciences. Over time, researchers gradually expanded their research horizons from oncology, genetics, dentistry towards psychology, economics, and humanities and arts disciplines (Cox et al., 2018; Craig et al., 2020; Dal-Re & Ayuso, 2019; Gholampour et al., 2022; Halevi, 2020; Majumder et al., 2021; Nogueira et al., 2017). Retraction is a self-correcting mechanism for scientific community to preserve the integrity of the scientific literature. However, retracted papers have also caused many adverse consequences, such as polluting citation networks, distorting academic metrics, misleading subsequent research, impeding research progress, eroding scientific reputation, wasting academic resources, affecting authors’ and co-authors’ academic careers (Brown et al., 2022; Stern et al., 2014; Szilagyi et al., 2022; Xu & Hu, 2022). Moreover, after the outbreak of COVID19, retracted papers related to the epidemic received widespread attention on social media, posing a serious threat to public health safety (Khan et al., 2022).
Many studies used bibliometric methods to analyze the fundamental characteristics of retracted papers and the adverse effects they caused. Relevant suggestions and measures have been proposed to address research misconduct and maintain research integrity, which offer valuable insights and crucial foundations for this paper. However, there have been more studies focusing on retracted papers of a specific country, but fewer studies focusing on particular institutions such as universities or hospitals. This paper plans to conduct a bibliometric analysis of the retracted papers from the Chinese university-affiliated hospitals, mainly for the following two reasons:
Firstly, the inspiration for this paper came from a study conducted by Zhao (2021), which provided a detailed analysis of the quantity changes, publisher distribution, and retraction reasons for retracted papers in Chinese hospitals. But the data in that study is limited in terms of time range and volume, making it difficult to fully grasp the characteristics of retracted papers in Chinese hospitals. This study aims to conduct an analysis of retracted papers in Chinese university-affiliated hospitals from 2000 to 2021, with the goal of gaining a deeper understanding of the quantity trends over the past two decades and the research misconduct behind it.
Secondly, retracted papers in the medical field are particularly noteworthy. On the one hand, the large number of medical retractions and its high frequency of citations have polluted the dissemination of knowledge (Szilagyi et al., 2022). On the other hand, compared to retracted papers in other subjects, erroneous findings in medical retractions are more likely to have detrimental effects on patient care or drug development (Li et al., 2018), which is extremely harmful. Medicine has always been a discipline with a high number of retracted papers (Grieneisen & Zhang, 2012), with the relevant medical schools or hospitals often bearing the brunt of these issues. In China, the university-affiliated hospital has multiple responsibilities. It is not just a hospital, but also a scientific research institution and a teaching institution of the university. On May 24, 2022, a report by China Ministry of Science and Technology on scientific misconduct cases revealed that a majority of retracted papers came from Chinese university-affiliated hospitals (Ministry of Science and Technology of China, 2022). Earlier, in 2017, Springer announced a shocking retraction of 107 papers by Chinese authors (Li et al., 2018), and most of them were also authored by Chinese university-affiliated hospitals. The Chinese government has always attached great importance to research integrity, issuing series of regulations that authors of misconduct retracted papers must be severely punished (Zeng & Resnik, 2010).
Hence, it is essential to analyze the retracted papers from affiliated hospitals of Chinese universities to understand the current situation of research misconduct in these institutions. This study specifically focuses on retracted papers from Chinese university-affiliated hospitals. Firstly, it analyzes the basic characteristics of the retracted papers. Secondly, it examines the characteristics of the implicated hospitals, hoping to provide a reference for understanding the current situation of research misconduct in Chinese university-affiliated hospitals.
2 Data and methods
The data in this paper came from the Web of Science core collection (SCI/SSCI/AHCI). The search strategy was ‘ADDRESS=China’ AND ‘DOCUMENT TYPES=(Retracted Publication OR Retraction) ‘, the time span was from 2000-01-01 to 2021-12-31. Eventually, a total of 3,630 retracted papers were identified. According to the correspondence address, we selected retracted papers whose correspondence address was affiliated with a university hospital in mainland China. These data included both retracted papers and retraction statements, some of which pointed to the same retracted paper, so after de-duplication, there were 1,031 retracted papers left. Then the information of these 1,031 retracted papers was entered into EXCEL for further analysis.
For the retracted papers, analysis perspectives included year of publication, disciplinary distribution, and reasons for retraction. The year of publication was obtained from Web of Science, while the discipline distribution was divided according to the discipline distribution of the journal, also obtained from Web of Science. Classifying the reasons for retraction was a more complex task. Firstly, we obtained the full text of 1,031 retraction statements from databases such as Springer and ScienceDirect. Secondly, we carefully read the original retraction statements to identify the true reasons why the papers were retracted. Finally, we constructed the classification of the retraction reasons. For the university-affiliated hospitals, we analyzed the level of hospitals, the level of universities and the geographical location of the hospitals. This information was gathered from the official websites of the respective hospitals. The data visualization in this study is mainly realized by Excel and Python.
3 Results
3.1 Analysis of the characteristics of retracted papers
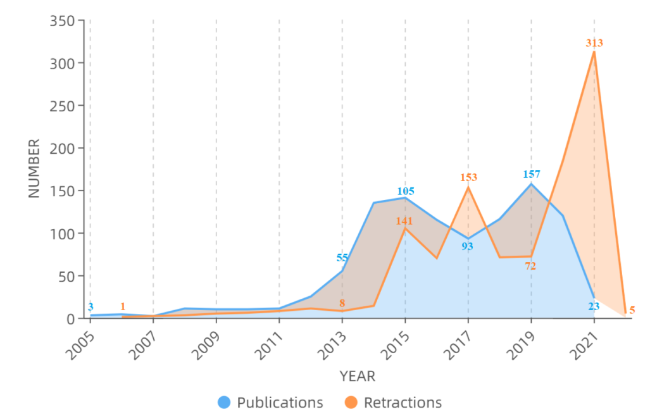
Figure 1. Trends of publications versus retractions. |
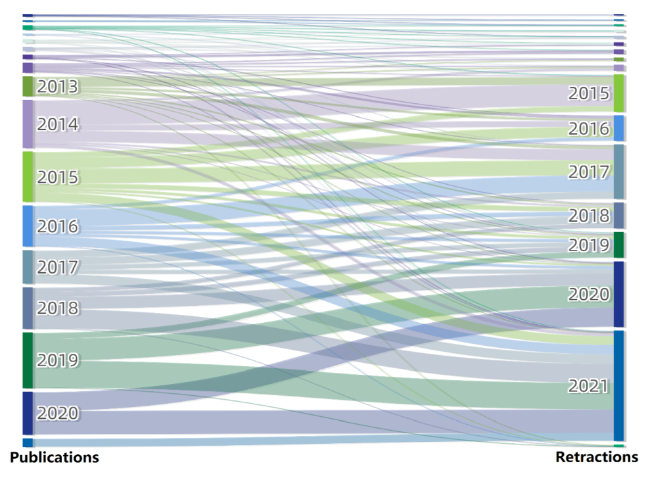
Figure 2. Distribution of time between publications and retractions. |
The 1,031 retracted papers were published in a total of 286 different journals. Among these journals, a few had a high rate of retractions, while the majority had a low rate. Specifically, there were 19 journals that had 10 or more papers retracted, accounting for 50.44% of the total retractions. On the other hand, 249 journals had 5 or fewer retractions, making up 37.44% of the total retractions. Journals with more than 10 retractions are listed in Table 1 . The top 5 journals are European Review for Medical and Pharmacological Sciences (n=114)、Tumor Biology (n=82)、RSC Advances (n=45)、Molecular Medicine Reports (n=34) and Molecular Biology Reports (n=27). Papers from European Review for Medical and Pharmacological Sciences were mainly retracted in 2020 (n = 65) and 2021 (n = 44), due to “data unreliable”. Papers from Tumor Biology were mainly retracted in 2015 (n=15) and 2017 (n=67), and the main reason was “fake peer review”. Papers from RSC Advances were mostly retracted in 2021 (n=41), and the main reasons were “falsified images and falsified data”. Retracted papers in these three journals all came from large-scale retraction scandals. These journals should claim the responsibility for publishing these retracted papers (Chunbo et al., 2019).
Table 1. Journals with the highest numbers of retracted articles. |
| Journal Titles | Number | Percentage of journal |
|---|---|---|
| European Review for Medical and Pharmacological Sciences | 114 | 11.06% |
| Tumor Biology | 82 | 7.95% |
| RSC Advances | 45 | 4.36% |
| Molecular Medicine Reports | 34 | 3.30% |
| Molecular Biology Reports | 27 | 2.62% |
| Oncology Reports | 25 | 2.42% |
| Molecular Neurobiology | 24 | 2.33% |
| Biomedicine & Pharmacotherapy | 19 | 1.84% |
| Cancer Management and Research | 19 | 1.84% |
| Experimental and Therapeutic Medicine | 18 | 1.75% |
| Oncology Letters | 17 | 1.65% |
| European Journal of Medical Research | 14 | 1.36% |
| Plos One | 13 | 1.26% |
| Cancer Cell International | 13 | 1.26% |
| Biochemical and Biophysical Research Communications | 12 | 1.16% |
| Journal of Orthopaedic Surgery and Research | 12 | 1.16% |
| Journal of Experimental & Clinical Cancer Research | 11 | 1.07% |
| International Journal of Clinical and Experimental Medicine | 11 | 1.07% |
After reading each of the 1,031 retraction statements (43 of which did not declare the reasons), we found that the main reasons for retractions are plagiarism/self-plagiarism (n=255), invalid data/images/conclusions (n=212), fake peer review(n=175), honesty error (n=163) and data/image fabrication (n=79) (see Table 2 ). Academic misconduct in retractions displays various characteristics. For instance, “fake information” encompasses different types such as a) fake correspondence address, b) fake correspondence email, c) fake authorship, and d) fake fund grant information. It is interesting to note that 3 papers were retracted because of their citation of retracted publications. While academic misconduct remains the most common reason for retractions, honesty error also accounts for a significant percentage. All the honest error retracted papers were initiated by their authors for the specific reasons of incorrect calculation, poor study design or contaminated samples.
Table 2. Reasons for retractions. |
| Reasons | Numbers | Percentage of reasons |
|---|---|---|
| Plagiarism/Self-Plagiarism | 255 | 22.29% |
| Invalid Data/Images/Conclusions | 212 | 18.53% |
| Fake Peer Review | 175 | 15.30% |
| Honesty Error | 163 | 14.25% |
| Data/Image Manipulation | 79 | 6.91% |
| Data/Image Reuse | 54 | 4.72% |
| Duplicate Publication | 46 | 4.02% |
| No Explanation Given | 43 | 3.76% |
| Submit without the Consent of the Co-authors | 37 | 3.23% |
| Violation of Research Ethics | 26 | 2.27% |
| Unrepeatable Results | 17 | 1.49% |
| Data Infringement | 14 | 1.22% |
| Authorship Dispute/Other Dispute | 10 | 0.87% |
| Paper Mill | 5 | 0.44% |
| Publisher’s Error | 3 | 0.26% |
| Cite Retracted Publication | 3 | 0.26% |
| Conflict not Declared | 2 | 0.17% |
Furthermore, we observed a shift in retraction reasons over time (see Figure 3 ). Prior to 2014, the retraction reasons did not show distinctive features, mainly containing duplicate publications, and were submitted without the consent of the co-authors. However, from 2015 to 2019, the retraction reasons displayed noticeable patterns, mainly distributed in 3 types of plagiarism/self-plagiarism, fake peer review and honesty error. Recently, the retraction reasons have become more complex. A single retraction now often involves two or even more reasons. The behavior of scientific misconduct is also gradually diversifying and concealing.
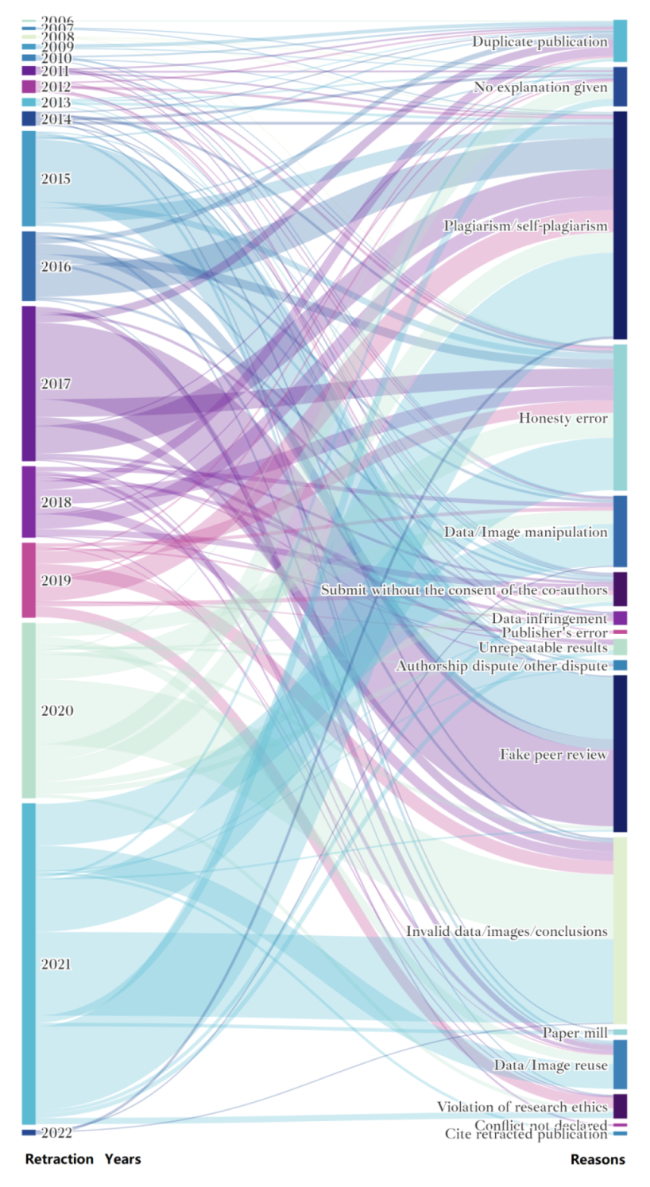
Figure 3. Years distribution of reasons for retractions. |
Disciplinary classification of Web of Science was employed to classify the disciplines of retracted papers. The 286 journals covered a total of 62 disciplines. Table 3 displays the disciplines with more than 10 retracted papers. The results showed that oncology (n=320), pharmacology & pharmacy (n=198) and research & experimental medicine (n=166) were particularly highlighted. The three disciplines represented about approximately 48.4% of the total number of retracted papers. Meanwhile, biochemistry & molecular biology, neurosciences & neurology and cell biology have a higher number as well. It is worth noting that even though these retracted papers originated from university-affiliated hospitals, not all of them were published in medical journals. One retracted paper was even published in Information Processing & Management.
Table 3. Disciplines with the highest numbers of retracted articles. |
| Research Fields | Numbers | Percentage of research fields | The Most Frequently Reasons | Numbers |
|---|---|---|---|---|
| Oncology | 320 | 22% | Plagiarism/Self-Plagiarism | 85 |
| Pharmacology & Pharmacy | 198 | 14% | Invalid Data/Images/Conclusions | 75 |
| Research & Experimental Medicine | 166 | 12% | Honesty Error | 28 |
| Biochemistry & Molecular Biology | 103 | 7% | Plagiarism/Self-Plagiarism | 26 |
| Neurosciences & Neurology | 84 | 6% | Plagiarism/Self-Plagiarism | 29 |
| Cell Biology | 71 | 5% | Honesty Error | 30 |
| Chemistry | 70 | 5% | Data/Image Manipulation | 34 |
| Pathology | 29 | 2% | Plagiarism/Self-Plagiarism | 8 |
| Surgery | 27 | 2% | Plagiarism/Self-Plagiarism | 10 |
| Immunology | 26 | 2% | Plagiarism/Self-Plagiarism | 6 |
| Science & Technology - Other Topics | 26 | 2% | Invalid Data/Images/Conclusions | 7 |
| Biotechnology & Applied Microbiology | 22 | 2% | Honesty Error | 5 |
| Genetics & Heredity | 23 | 2% | Honesty Error | 5 |
| Cardiovascular System & Cardiology | 19 | 1% | Duplicate Publication | 5 |
| Biophysics | 17 | 1% | Plagiarism/Self-Plagiarism | 10 |
| General & Internal Medicine | 17 | 1% | No Explanation Given | 5 |
| Orthopedics | 17 | 1% | Fake Peer Review | 7 |
| Gastroenterology & Hepatology | 12 | 1% | Plagiarism/Self-Plagiarism | 6 |
| Respiratory System | 11 | 1% | No Explanation Given | 3 |
| Physiology | 10 | 1% | Honesty Error | 5 |
3.2 Analysis of the characteristics of university-affiliated hospitals
The 1,031 retracted papers came from 237 university-affiliated hospitals, of which have more than 15 retracted papers are listed in Table 4 . The top 5 are Xiangya Hospital of Central South University (n=48), The First Affiliated Hospital of Jilin University (n=31), Shengjing Hospital of China Medical University (n=24)/The First Affiliated Hospital of Zhengzhou University (n=24) and Qilu Hospital of Shandong University (n=23)/ China-Japan Union Hospital of Jilin University (n=23). According to the “Measures for Hospital Grade Administration” issued by the former Ministry of Health of the People’s Republic of China, Chinese hospitals are categorized into three levels. Grade 3 is considered the highest level of quality (Zhao et al., 2021). Our analysis of the ranks of these university-affiliated hospitals shows that 98.3% of the hospitals belong to Grade 3, with only 4 hospitals falling outside this grade.
Table 4. University-affiliated hospitals with the highest numbers of retracted articles. |
| Affiliations | No. of papers | Percentage of affiliations | The Most Frequently Reasons | Numbers |
|---|---|---|---|---|
| Xiangya Hospital of Central South University | 48 | 11.37% | Plagiarism/Self-Plagiarism | 38 |
| The First Hospital of Jilin University | 31 | 7.35% | Plagiarism/Self-Plagiarism | 13 |
| Shengjing Hospital of China Medical University | 24 | 5.69% | Fake Peer Review | 24 |
| The First Affiliated Hospital of Zhengzhou University | 24 | 5.69% | Data Manipulation | 5 |
| Qilu Hospital of Shandong University | 23 | 5.45% | Honesty Error | 8 |
| China Japan Union Hospital of Jilin University | 23 | 5.45% | Plagiarism/Self-Plagiarism | 6 |
| Huaihe Hospital of Henan University | 18 | 4.27% | Invalid Data/Images/Conclusions | 7 |
| The Affiliated Hospital of Qingdao University | 16 | 3.79% | Plagiarism/Self-Plagiarism | 7 |
| Shandong Provincial Hospital | 16 | 3.79% | Plagiarism/Self-Plagiarism | 5 |
| The Second Hospital of Jilin University | 16 | 3.79% | Plagiarism/Self-Plagiarism | 9 |
Chinese universities are usually classified into 3 types: “Project 985 universities”, “Project 211 universities” and general universities. Project 211 was initiated in 1995 by the Ministry of Education aiming at raising the research standards of around 100 key universities for the twenty-first century. Project 985, launched in 1999, further shortlisted 39 universities from “211” institutions with a grand expectation that limited resources could be concentrated on a batch of flagship universities that were best placed in China to realize world-class ambitions (Zong & Zhang, 2019). There are currently 39 Project 985 universities and 116 Project 211 universities in China. Project 985 universities represent the best universities in China, such as Tsinghua University and Peking University. As shown in Table 5 , We found that 451 retracted papers (about 43.7%) came from Project 985 universities, 78 retracted papers (about 7.6%) came from Project 211 universities, and 502 retracted papers (about 48.7%) came from General universities. Although the Project 985 universities only account for 1.2% of the whole universities in China, the percentage of their retracted papers is close to 50%.
Table 5. Number of retracted papers in different types of universities. |
| Type | Number of universities | Percentage of universities | Number of retracted papers | Percentage of retracted papers |
|---|---|---|---|---|
| Project 985 universities | 39 | 1.2% | 451 | 43.7% |
| Project 211 universities | 112 | 3.6% | 78 | 7.6% |
| General universities | 3,012 | 95.2% | 502 | 48.7% |
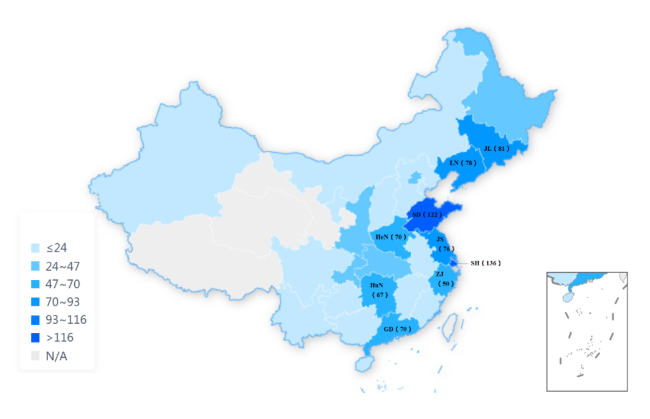
The geographical distribution of these hospitals also shows a certain pattern (see Figure 4 ). The provinces with a high number of retracted papers are Shanghai (n=136), Shandong (n=122), and Jilin (n=81), almost all of which are coastal regions. The number of retracted papers in the provinces of Guizhou, Inner Mongolia, and Shanxi are no more than 10, and the number of Gansu, Qinghai, and Tibet are 0. Generally speaking, coastal regions have a relatively developed economy, with a greater number of university-affiliated hospitals and a larger population of researchers. Therefore, the number of published papers is also higher compared to inland regions. Moreover, researchers in coastal areas are under great pressure of publication and promotion, perhaps a few of them have committed scientific misconduct, so the number of fraudulent papers is higher in these areas.
Figure 4. Retractions mapped onto the administrative regions of China. |
4 Discussion
As far as we know, this paper is the first study to specifically focus on retracted papers from Chinese university-affiliated hospitals. The characteristics of the retracted papers and the hospitals involved were analyzed and the following conclusions were reached:
a. The number of retracted papers from Chinese university-affiliated hospitals is likely to continue to increase in the coming years; Over the past 20 years, there has been a continuous upward trend in the number of retracted papers. With the increasing global attention and governance on research misconduct, it is believed that a large number of potential fraudulent research papers will be gradually exposed.
b. The main reasons for retraction are plagiarism/self-plagiarism, invalid data/images/conclusions, and fake peer review; Additionally, a considerable number of papers have been retracted due to honest errors, which is a phenomenon that deserves our attention.
c. Retracted papers show a trend of spreading to non-medical fields such as material science and computer science. Analysis of the disciplinary distribution revealed that while the majority of retracted papers belong to medicine, a small portion of them were published in non-medical journals such as materials science and computer science.
d. A relatively small number of hospitals accounted for a high proportion of all retracted papers, approximately 43.7% of retracted papers came from Project 985 university-affiliated hospitals.
Over the past two decades, there has been a concerning trend regarding the increasing number of retracted papers from Chinese university-affiliated hospitals. In 2021 alone, an unprecedented 313 papers were retracted, highlighting the severity of the issue. Because of the significant time interval between publication and retraction, it is likely that more potential problematic papers will be discovered and retracted. We anticipate that the number of retracted papers of Chinese university-affiliated hospitals will remain high in the foreseeable future, which requires attention and more efforts from relevant universities and government departments. Another important finding of this paper is that the retraction reasons are not invariant. After analyzing the 20-year evolution of retraction reasons, we found that a single paper involves multiple retraction reasons in recent years while a single paper involves only 1 retraction reason at the beginning of the century. The category of retraction reasons is becoming more various. With the implementation of paper check, scientific misconduct behavior has become more difficult to find too. This indicates us to develop more advanced technological tools to monitor and combat scientific misconduct papers. These findings are significant, not only for Chinese scientific community but also for the global scientific community as a whole. Addressing the issue of scientific misconduct in university-affiliated hospitals is critical to upholding the integrity of scientific research and ensuring public trust in its outcomes.
In China, university-affiliated hospitals are both healthcare facilities and research institutions. They have the dual responsibility of treating patients and educating students at the same time. Doctors at university-affiliated hospitals also have multiple roles to fulfill. They are thus faced with a busier workload and greater strain compared to other researchers. Not only are they occupied with the daily operations of the hospital, but they also have to contend with annual performance evaluations. In the dilemma of “publish or perish”, and lured by promotions, a handful of doctors are unable to adhere to the basic norms of scientific integrity. It’s important to note that Chinese universities and hospitals also offer financial incentives or salary rewards for publishing SCI papers, which unintentionally encourages scientific misconduct. This paper suggests that the assessment of doctors should be revised, the number of SCI papers should be eliminated as an indicator for evaluation, the promotion channels for doctors should be expanded, and the pressure of publishing should be reduced. It is critical that doctors should be freed from the endless papers and unreasonable evaluation mechanism so that they can have enough time and energy to focus on their patients in the hospitals.
We strongly believe that university-affiliated hospitals should prioritize research integrity education activities in order to promote the fundamental principles of research integrity and academic ethics. This education should cover the entire faculty and staff, including doctors, nurses, graduate students, and visiting scholars. All personnel should accept research integrity education to form a situation where research integrity is embedded in the hospital’s culture. Furthermore, universities and their affiliated hospitals must effectively deal with the retracted papers, especially in the hospitals in coastal areas and affiliated with “Project 985 universities”. Different penalties should be imposed on the authors of the retracted papers, depending on the extent of harm they have caused. By simultaneously incorporating research integrity education and research misconduct punishment, young physicians can better understand the fundamental principles of research integrity and avoid unintentional negligence that may lead to research misconduct. This will not only enhance the reputation of hospitals and universities but also maintain the public’s trust.
After reviewing the retraction statements, we noticed significant variations in their content across different journals. Surprisingly, even among journals published by the same publisher, there was no consistent format for these statements. Many retraction statements are very vague about the reasons for retraction and the investigation process. In fact, some statements failed to mention the specific reasons for retraction, merely stating that “this article has been retracted.” As a result, these ambiguous statements do not provide any valuable information. Professor Snodgrass recognized this problem 30 years ago (Snodgrass & Pfeifer, 1992) but this issue has not improved today and many journals still lack a clear retraction policy. One study argued that editors use ambiguous expressions possibly to prevent lawsuits (Williams & Wager, 2013). Regardless of the reasons, we suggest that journals and publishers should establish a standardized format for retraction statements to avoid continued citation of retracted papers. These statements should provide detailed information about the reasons for retraction and the findings of investigations (Craig et al., 2020).
Although retracting a paper is generally dishonorable, we believe that retractions should be considered more rationally. Our research reveals that not all retractions occur due to scientific misconduct, there is a significant proportion of papers were retracted by authors because of their unintentional errors. Furthermore, the increasing number of retractions is not solely a result of an increase in scientific misconduct, but rather a reflection of the scientific community’s awareness and responsiveness to fraudulent and flawed research (Fanelli, 2013). Despite an increasing number of retracted papers, the rate of increase has slowed, with more journals strengthening their regulatory efforts (Brainard, 2018). From another perspective, retraction is a commendable form of scientific self-correction. The growing number of retracted papers is actually a positive indication of improved global research integrity (Fanelli, 2014). We should approach the phenomenon of retraction correctly and avoid stigmatizing it.
5 Conclusion
We analyzed the basic features of retracted papers in Chinese university-affiliated hospitals over the past 20 years. Our analysis revealed that research misconduct is spreading, which is a concerning signal that requires attention from universities, hospitals, and the scientific community. We further analyzed the features of the implicated hospitals and discovered that the majority of retractions come from prestigious and well-known hospitals. This finding further highlights the gravity of research misconduct in Chinese university-affiliated hospitals and emphasizes the urgent need to address this issue. The analysis of hospital characteristics may enhance the related research on retracted papers to some extent and provide references for future studies.
Overall, this study has a few limitations that must be noted. Firstly, this study fails to distinguish between retractions made due to misconduct and those made due to honest error. We believe that there is a fundamental difference between misconduct retractions and honest error retractions. Secondly, this paper does not analyze the authors of the retracted papers. It is highly recommended that future research places a great emphasis on analyzing the characteristics of authors of retracted papers, which will provide a more comprehensive understanding of retracted papers.
Author contributions
Yuan Zi-han (yuanzihan@cnu.edu.cn) and Liu Yi (liu.yi@imicams.cn) both contributed equally to this work.
Funding information
This work was supported by grants from Humanity and Social Science Youth Foundation of Ministry of Education of China (21YJC870016).