


1 Introduction
From a particular perspective, scholarly communication functions as a system involving academic journals, conference proceedings, books, and other outlets that deliver new knowledge to the scientific community and the public. Scholarly communication involves many actors with different tasks and roles in the system. Researchers worldwide conduct research and produce new knowledge that they tend to publish in academic journals in the first place (Braun et al., 1989; Campanario, 1998). Journal editors are tasked with conducting initial manuscript quality control and overseeing the peer-review process (see, for example, Bedeian et al., 2009; Besancenot et al., 2012; Brinn & Jones, 2007; Dow, 2000; García et al., 2015; Hojat et al., 2003); reviewers are tasked with providing the editors with the information they need to reach a decision and the authors with instructions about how to improve the quality of their paper if revision is possible. Editorial board members and reviewers are often considered gatekeepers who control the main communication channels of scientific information (Bornmann & Daniel, 2007; Braun & Dióspatonyi, 2005a; Crane, 1967; Csomós & Lengyel, 2022; Schubert, 2017; Siler et al., 2015).
Investigating the editorial boards of academic journals from different aspects has been a topic of interest for researchers for several decades. For example, Bakker and Rigter (1985), Braun and Dióspatonyi (2005b), Goyanes (2020), Goyanes and Demeter (2020), and Schubert (2017), alongside other topics, examined the geographical distribution of editorial board members. These studies demonstrated the dominance of the United States in the editorial boards of selected journals. More recently, Bedeian et al. (2009) focused on exploring the scientific achievements of editorial board members; in another study, Petersen et al. (2017) investigated the relationship between editorial governance and journal impact in the case of management and business journals. Furthermore, Dhanani and Jones (2017), Goyanes and Demeter (2020), and Metz and Harzing (2012) examined the gender diversity of editorial boards. In a study, Siler et al. (2015) measured the effectiveness of scientific gatekeeping (i.e., peer review).
Even more recently, several studies have been conducted to explore to what extent the editorial boards of journals interlock (Baccini & Barabesi, 2010; 2011; Baccini et al., 2020; Csomós & Lengyel, 2022; Goyanes & de-Marcos, 2020; Teixeira & Oliveira, 2018). These studies often employ social network models to demonstrate the connections between the editorial board members of a particular journal or set of journals. However, although many studies have investigated editorial boards from different aspects, no research has yet been conducted specifically about editors-in-chief.
Generally, an editorial team is led by an editor-in-chief, who is fully responsible for the journal’s intellectual content and overall quality and strategy. Those in this role select the editorial board and the associate editors, who are tasked to help editors-in-chief with handling increased submissions and managing the peer review process. Additionally, editors-in-chief are authorized to represent the journal and liaise with the corporate sector and the public. Perhaps the most critical task of an editor-in-chief is their responsibility of making final decisions about the acceptance or rejection of all manuscripts submitted to the journal.
Usually, an editor-in-chief is appointed after they have applied for the position and meet all the requirements, which are delineated by the publisher or the organization owning the journal. Sometimes, the editorial board selects the editor-in-chief from among its members. Naturally, the criteria an editor-in-chief applicant must fulfill varies from journal to journal; however, it is a common requirement that the applicant be a renowned researcher in the field. For example, as Springer Nature notes (https://www.springernature.com/gp/editors/information-guide), “the role of an Editor-in-Chief is varied, but their core purpose is to be a champion for their discipline and a custodian of the scientific record in order to ensure the success of the journal for their community.”
As there are many “renowned researchers” worldwide, the geographical pattern of editors-in-chief could be assumed to be highly diverse. Nevertheless, many studies have revealed the hegemony of the United States (or that of English-speaking countries in a broader context) in global science (see, for example, Gomez et al., 2022; Heinze et al., 2019; Marginson & Xu, 2023). For example, Braun and Dióspatonyi (2005b), Braun et al. (2007), Csomós and Lengyel (2022), Goyanes (2020), Goyanes and de-Marcos (2020), Harzing and Metz (2013); Hodgson and Rothman (1999), and Tutarel (2004) reported that United States-based scholars occupy a considerable share of positions on the editorial boards of academic journals, with many editorial board members also hailing from the United Kingdom, Canada, and Australia. In addition, Csomós and Lengyel (2022), Hodgson and Rothman (1999), and Paasi (2005) found that journals worldwide tend to employ United States-based scholars as editorial board members, as such an approach is believed to increase the journal’s prestige. However, no research has been conducted about which countries are home to the most editors-in-chief or whether the hegemony of the United States and other English-speaking countries also characterizes the geography of editors-in-chief.
Considering the above, this paper seeks to provide a comprehensive picture of the editors-in-chief’s geography based on journals listed in the Web of Science’s SCIE and SSCI databases. In addition, the paper aims to discern if there is a relationship between academic publishers’ origin and nationality and the geography of editors-in-chief.
2 Data and methods
2.1 Data collection on journals and editors-in-chief
For the analysis, the master journal lists of the Social Sciences Citation Index (SSCI) and Science Citation Index Expanded (SCIE) provided by Clarivate’s Web of Science Core Collection were used. The lists are available and downloadable in CSV format after registration on Clarivate’s website (https://mjl.clarivate.com/collection-list-downloads). Following a merge of the two lists, journals that were in both SSCI and SCIE were coupled. Consequently, 12,402 journals remained in the unified list (8,841 and 2,857 journals in the SCIE and SSCI databases, respectively, and 704 journals in both databases).
Notably, English-language journals are significantly overrepresented in the Web of Science database (Mongeon & Paul-Hus, 2016). The 12,402 journals publish papers in the following languages: English: 11,031; two or bilingual (of which one language is English): 146; multiple (of which one is English): 750; German: 86; Spanish: 82; Chinese: 17; Dutch: 15; and others (including Portuguese-, French-, Italian-, and Korean): 217. Therefore, 96.17% of the journals in the analysis publish papers in English; 88.95% publish papers only in English.
The editors-in-chief of journals were identified manually, with each journal’s website checked individually to discern who the editor-in-chief was. While this study found that the most commonly used term to define the person who is located at the top of the editor hierarchy is “editor-in-chief,” multiple other definitions are used that are equivalent to this title. The most popular definitions among this sample are editor (sometimes not accompanied by an editorial board), chief editor, senior editor, senior editor-in-chief, senior executive editor, executive editor, chief executive editor, general editor, general editor-in-chief, comprehensive editor-in-chief, coordinating editor, lead editor, journal editor, principal editor, managing editor (generally not a scientific role, but several journals in the field of mathematics define the top editor as the managing editor), and scientific director. In this paper, “editor-in-chief” describes the person(s) at the top of the editorial hierarchy, regardless of how the journal names the position.
Although 9,098 journals (73.4% of the total) have only one editor-in-chief, for a considerable proportion of the journals, the editor-in-chief position is occupied by more than one person (calling them “editors-in-chief,” “co-editors-in-chief,” or “joint editors-in-chief”). For example, 2,001, 573, and 248 journals employ two, three, and four people as editors-in-chief, respectively. When five or more people serve as editors-in-chief, some journals define them as an “editor-in-chief collective” or an “editor-in-chief board.” In that case, high-level decision-making is exercised by a team rather than individuals, so journals with five or more editors-in-chief (i.e., 161 journals or 1.3% of all journals) were excluded from this analysis. In addition, some journals do not employ an editor-in-chief, meaning that each editorial board member has an equal role in editing the journal. Finally, in some cases, it was impossible to discern who the editor-in-chief was. The analysis thus ultimately contained 11,915 journals (96.1% of all journals in the dataset) edited by 15,795 people (a journal thus has, on average, 1.33 editors-in-chief).
For each editor-in-chief, the institution with which they were affiliated, and the institution’s geographical location were identified. If an editor-in-chief reported more than one institution as their affiliation, the first one was considered. Identifying the geographical location of the institutions with which the editors-in-chief were affiliated enabled a country-level analysis to be conducted.
Finally, some unique cases must be noted: (1) University law reviews (e.g., Boston University Law Review and California Law Review) are generally edited by law students affiliated with the respective university’s law schools who rotate annually; the editor-in-chief is typically a J. D. Candidate, a law student who applies for a “Juris Doctor” degree. (2) Mega-journals (e.g., PLOS ONE, PeerJ, and some MDPI journals) assign the manuscripts submitted to the journal to article editors, so the decision about the publication of each paper is generally made by the article editor instead of the editor-in-chief. The primary task of a mega-journal’s editor-in-chief is defining the journal’s overall strategy (see, for example, the letter of Emily Chenette after she was appointed as the new editor-in-chief of PLOS ONE: https://everyone.plos.org/2021/03/11/a-new-editor-in-chief-for-plos-one/). (3) Some journals employ in-house editors affiliated with the publishing house that owns the journal. In-house editors handle manuscripts comprehensively throughout the submission and publication process, including overseeing peer review and production steps and liaising with the scientific community. Sometimes, an in-house editor serves as editor-in-chief for more than one journal. In-house editors closely collaborate with editorial board members, who assist them in making the optimally professional decision about a manuscript’s fate. For example, Nature journals (including Nature) often employ in-house editors.
The data collection for this study ended on April 24, 2023.
2.2 Data of academic publishers
The data of academic publishers were derived from Clarivate’s InCites analytical platform. In 2022, 13 academic publishers owned 69.63% of the 12,402 journals contained by SCIE and SSCI databases and included in the analysis. These publishers are as follows: Cambridge University Press, De Gruyter, Elsevier, Emerald, IEEE, Lippincott Williams & Wilkins, MDPI, Oxford University Press, Sage, Springer Nature, Taylor & Francis, Wiley, and World Scientific. Relevant data from these publishing houses are shown in Table 2 .
Table 2. The largest publishing houses in terms of the number of editors-in-chief. |
| Publishing house | Location (country) | Headquarters (city) | Number of editors-in-chief | Number of journals in SCIE/SSCI databases (2022) | Share of editors-in-chief from the Anglosphere (%) |
|---|---|---|---|---|---|
| Elsevier | Netherlands | Amsterdam | 2,410 | 1,874 | 55.31 |
| Springer Nature | Germany / United Kingdom | London / Berlin / New York, NY | 2,390 | 1,871 | 44.64 |
| Wiley | United States | Hoboken, NJ | 1,688 | 1,275 | 62.86 |
| Taylor & Francis | United Kingdom | Abingdon | 1,634 | 1,426 | 68.12 |
| Sage | United States | Thousand Oaks, CA | 859 | 681 | 79.51 |
| Oxford University Press | United Kingdom | Oxford | 421 | 373 | 70.31 |
| Cambridge University Press | United Kingdom | Cambridge | 362 | 306 | 74.03 |
| Lippincott Williams & Wilkins | United States | Philadelphia | 250 | 222 | 86.40 |
| De Gruyter | Germany | Berlin | 192 | 158 | 28.13 |
| IEEE | United States | New York, NY | 171 | 171 | 52.05 |
| Emerald | United Kingdom | Bingley | 119 | 116 | 63.03 |
| World Scientific | Singapore | Singapore | 106 | 64 | 43.40 |
| MDPI | Switzerland | Basel | 104 | 99 | 50.00 |
| American Associations and Societies | United States | multiple locations across the United States | 479 | 419 | 88.73 |
In addition, 419 academic journals are published by professional organizations headquartered in the United States (and a few in Canada). Due to the reasons detailed in Section 3.2, these journals were also involved in the analysis.
2.3 Country groups appearing in the analysis
In the analysis, the Web of Science’s country and territory grouping schema was used to map the geography of the editors-in-chief. Additionally, some unique country group classifications appear in the study, defined below.
For the term “Anglosphere,” we use Bennett (2004)’s definition: “the English-speaking Common Law-based nations of the world.” The more exclusive term, “Core Anglosphere,” is generally used to describe English-speaking nations like Australia, Canada, New Zealand, the United Kingdom, and the United States. In this study, “Anglosphere” is used to describe the Core Anglosphere nations.
The term “EU-27” is also used in the study. It refers to the 27-member-state community of the European Union as of 2023.
3 Results
3.1 Mapping the geography of editors-in-chief
It was found that the 15,795 editors-in-chief are based in 96 countries/regions worldwide (Figure 1 ). However, most editors-in-chief (i.e., 8,628 people or 54.62% of the sample) come from five countries in the Anglosphere (i.e., Australia, Canada, New Zealand, the United Kingdom, and the United States). The United States is home to the most editors-in-chief in the world: 5,355 (33.90% of the editors-in-chief in the sample) work for United States-based institutions (Table 1 ). With 1,898 editors-in-chief (12.02%), the United Kingdom ranks second, while Germany, where 1,035 editors-in-chief are based (6.55%), comes third. As home to 794 editors-in-chief (5.03%), China ranks fourth. Next, the fifth and the sixth positions are occupied by Canada and Australia (4.21 and 3.77% of the editors-in-chief in the sample, respectively), two more English-speaking countries. Italy, France, Japan, and Spain are also included in the top 10 countries (see the full list in Appendix 1). In Latin America, Brazil is the top-ranked country, with 208 editors-in-chief (13th place); in Africa, South Africa occupies the highest position (101 editors-in-chief, 22nd place).

Figure 1 Worldwide location of editors-in-chief by country (2022). |
Table 1. Countries/territories where at least 50 editors-in-chief are based |
| Rank | Country/territory | Editors-in-chief | Rank | Country/territory | Editors-in-chief |
|---|---|---|---|---|---|
| 1 | United States | 5,355 | 20 | Belgium | 131 |
| 2 | United Kingdom | 1,898 | 21 | New Zealand | 115 |
| 3 | Germany | 1,035 | 22 | South Africa | 101 |
| 4 | China | 794 | 23 | Denmark | 98 |
| 5 | Canada | 665 | 24 | Chinese Taiwan | 93 |
| 6 | Australia | 595 | 25 | Greece | 84 |
| 7 | Italy | 519 | 26 | Singapore | 83 |
| 8 | France | 490 | 27 | Norway | 81 |
| 9 | Japan | 403 | 28 | Israel | 80 |
| 10 | Spain | 351 | 28 | Turkey | 80 |
| 11 | Netherlands | 305 | 30 | Mexico | 78 |
| 12 | South Korea | 214 | 31 | Czechia | 69 |
| 13 | Brazil | 208 | 32 | Portugal | 67 |
| 14 | Switzerland | 200 | 33 | Ireland | 65 |
| 15 | Russia | 162 | 34 | Finland | 59 |
| 16 | Poland | 160 | 35 | Hungary | 56 |
| 17 | Sweden | 157 | 36 | Chile | 53 |
| 18 | Austria | 141 | 36 | Romania | 53 |
| 19 | India | 140 | 36 | Iran | 53 |
Overall, the United States is home to 33.37% more editors-in-chief than the European Union’s 27 member states combined (i.e., 5,355 vs. 4,015 people). Moreover, 6.74 times more editors-in-chief hail from the United States than China. In the United Kingdom, 26.2% more editors-in-chief are based than in East Asian scientific powers like China, Japan, South Korea, and Chinese Taiwan combined. In sum, the highest-level decision-making in scholarly communication is dominantly exercised by countries of the Anglosphere.
3.2 Exploring the share of editors-in-chief across academic publishers by country
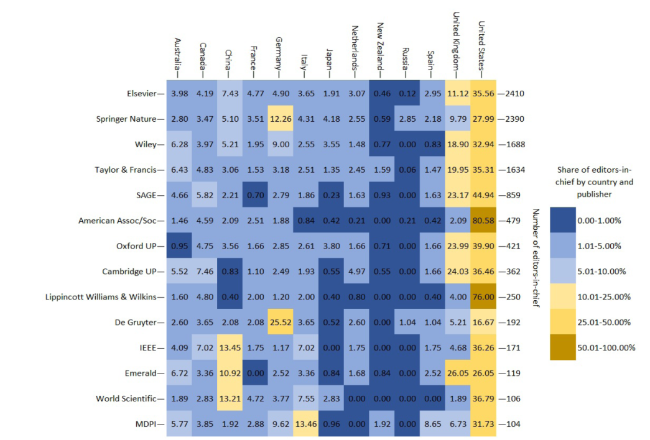
As Table 2 demonstrates, the share of editors-in-chief from Anglosphere countries is the highest (i.e., over 50%) for publishing houses based in the United States and the United Kingdom. Elsevier—the largest publishing house in the world in terms of journal portfolios and the number of articles published in SCIE/SSCI-listed journals—is headquartered in the Netherlands. However, the share of editors-in-chief from countries of the Anglosphere still rises above 50%. Furthermore, the share of United States-based editors-in-chief for Elsevier is higher than for Wiley, a publishing house that originates in the United States (Figure 2 ). Notably, the share of China-based editors-in-chief is the highest for Elsevier compared to other major academic publishers. Elsevier journals have become attractive academic outlets for China-based scholars, a potential reason for this higher share of China-based editors-in-chief. In 2022, 188,418 articles were published by China-based authors in Elsevier journals, 113.12% more than those published by United States-based authors. For Springer Nature, Wiley, and Taylor & Francis, this share was 45.33%, 29.24%, and 16.40%, respectively, while in Sage journals, the share of articles by United States-based authors was 82.41% higher than for China-based authors.
Figure 2. Share of editors-in-chief across academic publishers by country |
As for Springer Nature and De Gruyter, these cases reinforce that there is a relationship between a publishing house’s origin and its share of editors-in-chief by country. Regarding the former, Springer Nature was created in 2015, following the merger of the German publishing company Springer Science+Business Media and the United Kingdom-based Nature Publishing Group. Before merging the two companies, Springer was a European-leaning academic publisher, later becoming a major global player and the number one competitor to Elsevier. It is thus unsurprising that the share of Germany-based editors-in-chief is high for Springer Nature (exceeding that of the United Kingdom-based editors-in-chief). Moreover, the share of European editors-in-chief (i.e., France-, Italy-, and Spain-based) is also considerably high (Figure 2 ). In addition, De Gruyter, a Berlin-based academic publisher, employs a much higher share of editors-in-chief from Germany than from the United States, making it a unique case.
For MDPI, it was found that United States-based researchers occupy 31.73% of the editors-in-chief positions; however, the shares of Italy-, Germany-, and Spain-based editors-in-chief are also remarkably high (13.46, 9.62, and 8.65%, respectively). If we investigate which countries produce the most articles in MDPI journals, we observe a roughly similar pattern. In 2022, 11.16% of the articles were published by United States-based authors, followed by Italy-, Germany-, and Spain-based authors (8.22, 5.48, and 5.42%, respectively). Although most articles published in MDPI journals were by authors from China (i.e., 27.91% of all articles in 2022), the share of China-based editors-in-chief remained under 2%. When examining the share of articles published in MDPI journals in the total publication output of a country, one observes that MDPI has gained an extremely high market share in Europe (primarily in Southern Europe and Central and Eastern Europe) while remaining a marginal player in the United States and China (Csomós & Farkas, 2023). Still, MDPI employs many United States-based editors-in-chief and hardly any editors-in-chief from China.
Finally, we must note a special case. In our study’s dataset, there were 419 journals with names containing the term “American.” These journals are published by a total of 100 associations, societies, and institutes (henceforth called organizations), each of which is based in the United States. Based on information available on the websites of these organizations, these organizations tend to employ editors-in-chief from their memberships, most of whom are affiliated with United States-based institutions. It is, therefore, unsurprising that the share of editors-in-chief from the United States is exceptionally high among these journals (80.58% of the 479 editors-in-chief). In contrast, Canada’s share remains under 5% (Figure 2 ). Furthermore, in terms of the number of editors-in-chief, these journals employ more combined than Oxford University Press, the sixth top-ranked academic publisher (Table 2 ).
The examples of Pleiades Publishing and MAIK Nauka/Interperiodica Publishers, two academic publishers, further support the argument about the relationship between academic publishers’ origins and nationalities and the geography of their editors-in-chief. Historically, Pleiades Publishing has specialized in publishing research from Eastern Europe, while MAIK Nauka/Interperiodica Publishers was established jointly by the Russian Academy of Sciences and Pleiades Publishing. Accordingly, these two academic publishers collectively employ two-thirds of all Russia-based editors-in-chief; moreover, journals owned by MAIK Nauka exclusively employ Russian editors-in-chief.
4 Discussion and conclusions
This paper seeks to provide a comprehensive picture of the geography of editors-in-chief based on journals listed in the Web of Science’s SCIE and SSCI databases. While many studies have examined editorial boards’ composition—repeatedly demonstrating the dominance of the United States and some other English-speaking nations in those communities—there has been no research on the geography of editors-in-chief. The role of the editor-in-chief is crucial in a journal’s editorial board, as this they are fully responsible for the journal’s intellectual content and overall quality and strategy. Moreover, the editor-in-chief typically makes final decisions on the acceptance or rejection of all manuscripts submitted to the journal. The editor-in-chief thus exercises the highest level of decision-making in scholarly communication.
The analysis involved 11,915 journals listed in Web of Science’s Social Sciences Citation Index (SSCI) and Science Citation Index Expanded (SCIE) that employed a total of 15,795 scholars as editors-in-chief.
The results from analyzing this study’s sample show that the geography of editors-in-chief is significantly dominated by the United States and the United Kingdom, home to almost 50% of all editors-in-chief. Notable scientific powers, such as Germany and France from Europe or China and Japan from East Asia, lag behind the two English-speaking nations. Of course, there might be many reasons creating this pattern: that English has become the “lingua franca” of science, that SCIE and SSCI databases are biased toward the English language, that editors from the United States (and the United Kingdom) are believed to help increase a journal’s prestige, or that universities located in the United States and the United Kingdom employ many highly reputed researchers. However, this paper investigated a distinct dimension of the geographical pattern identified above.
According to Paasi (2005), “Anglo-American journals dominate the publishing space in science”—in other words, “international forums (in science) are in fact narrowly Anglo-American.” The largest academic publishers in terms of journal portfolio are Elsevier, Springer Nature, Wiley, Taylor & Francis, and Sage (Csomós & Farkas, 2023; Hagve, 2020; Larivière et al., 2015; Nishikawa-Pacher, 2020). The “Big Five,” as they are commonly referred to following a study by Larivière et al. (2015), publish 52.88% of the journals in the Web of Science SCI/SSCI databases and employ 56.86% of journal editors-in-chief. Although the Big Five and other major academic publishers (see Table 2 ) operate globally, they maintain strong ties with the United Kingdom and the United States, where they were founded. This paper observed a relationship between academic publishers’ origin and nationality and the geography of editors-in-chief.
Recently, however, some new trends have emerged, significantly affecting global science, including in our findings on editors-in-chief. For example, China has been making significant efforts to become the new global science powerhouse (Marginson, 2020; Mervis, 2022). Since 2020, China-based researchers have published more SCIE/SSCI articles annually than their peers in the United States (see, for example, Baker, 2023). The high citation impact of those articles demonstrates the increasing prestige of Chinese science, similar to the rapidly increasing positions of Chinese universities in various university rankings. Thus, it can be predicted that Chinese scholars will occupy more editor-in-chief positions in the future while acknowledging that the overall position of the United States in the geography of editors-in-chief will likely remain unchallenged.
Data availability
The dataset containing the affiliations of editors-in-chief is deposited in Harvard Dataverse and available at this link: https://doi.org/10.7910/DVN/4RMDJW