

1 Introduction
By eliminating subscription fees, Open Access (OA) journals make research more accessible to scholars and to the general public. This has the potential to increase citation impact as well as readership. Although OA status has no independent impact on citation rates, authors can maximize the impact of their research by choosing OA journals for the papers that are most likely to benefit from a broad, interdisciplinary readership (Basson et al., 2021; Davis, 2011; Davis et al., 2008; Gaule & Maystre, 2011; Hubbard, 2017; Piwowar et al., 2018; Wang et al., 2021; Wray, 2016). In terms of citation impact per article, OA journals can now be found among the top five journals in nearly 200 fields including chemical engineering, economics, electrical engineering, environmental science, genetics, history, management science, molecular medicine, music, political science, public health, soil science, and statistics (Elsevier, 2023).
Many scholars were initially skeptical of OA journals, however, especially with regard to the “authors pays” model, in which publishers earn revenue through publication fees paid by the authors, their institutions, or their funding agencies (Borrego, 2023; Dalton et al., 2020; Halevi & Walsh, 2021; Togia & Korobili, 2014). This skepticism has led to a bias against OA journals on the part of some authors and evaluators. For example, 55% of the respondents to a 2006 survey of authors who published in three well-known medical journals reported that they would not submit again to their journal if it became OA and charged fees, mainly because the reputation of the journal would suffer (Schroter & Tite, 2006). More recent surveys reveal widespread negativity toward the author-pays model as well as a continuing belief that OA journals suffer from weak peer review standards and that “anyone can pay to get published” in OA journals (Feenstra & López-Cózar, 2022; Hayman, 2016; Segado-Boy et al., 2022).
These attitudes suggest that OA journals may have poor reputations relative to subscription journals of similar quality or impact. Moreover, there is some evidence that OA journals have relatively high citation impact due to factors other than scholarly quality, such as accessibility to a broad audience (i.e., the removal of barriers to reading and citing). (See section 2 for details.) This study evaluates whether OA journals in business and economics have especially high citation impact relative to their perceived quality (reputation)—or, stated differently, whether they have especially low perceived quality (reputation) relative to their citation impact.
For a set of 1,561 journals, multiple regression is used to estimate the ratings assigned by expert reviewers for the 2021 journal assessment exercise of the Chartered Association of Business Schools (CABS). The only independent variables are four citation metrics, evaluated separately, and a dummy variable representing the Open Access status of each journal (OA or non-OA). We expect that for each analysis, the OA regression coefficient will be negative, indicating that OA business and economics journals have low CABS ratings relative to their citation impact.
2 Context and previous research
2.1 Relationships between expert assessments and citation metrics
Quite a few studies have evaluated the relationships between subjective assessments of reputation (or “quality”) and citation impact. These investigations have been undertaken with regard to entire journals (e.g., Haddawy et al., 2016; Hall, 2011; Hodge et al., 2021; Kulczycki & Rozkosz, 2017; Mahmood, 2017; Saarela & Kärkkäinen, 2020; Walters, 2017b, 2024; Walters & Markgren, 2019), individual articles (e.g., Abramo et al., 2019; Weitzner et al., 2024), individual researchers (e.g., Derrick et al., 2011; Guba & Tsivinskaya, 2023), and institutions (e.g., Szluka et al., 2023). However, a comprehensive literature search revealed no prior studies of the impact of OA status on the relationships between expert journal ratings and journal citation metrics. Specifically, there is no clear evidence that OA journals have especially high (or low) citation impact relative to their subjectively assessed quality.
2.2 The influence of OA status on expert assessments
As noted in section 1, skepticism about OA publishing can generate negative biases that affect scholars’ opinions of OA journals (Borrego, 2023; Dalton et al., 2020; Feenstra & López-Cózar, 2022; Halevi & Walsh, 2021; Hayman, 2016; Segado-Boy et al., 2022; Togia & Korobili, 2014). In turn, these negative attitudes may lead expert evaluators to assign lower reputation scores to OA journals than to subscription journals of comparable objective quality or impact. Although this assertion is reasonable, it has not been tested directly. Just one study, of limited scope, has addressed the question. Carvalho Neto et al. (2016) evaluated a random sample of 450 Brazilian journals included in the Qualis assessment exercise, which rates more than 24,000 journals on an eight-point scale based on their citation impact, their index coverage, and the subjective assessments of expert reviewers. Perhaps surprisingly, the OA journals in their sample had substantially higher Qualis ratings than the subscription journals. In fact, the OA journals—68% of the 450—comprise at least 80% of the journals in each of the top four rating categories but fewer than 60% of the journals in each of the lowest four categories. Although this finding is contrary to the expectations that underpin this investigation, it is based on data for just 450 journals published in Brazil—journals that may be systematically different from most international journals.
2.3 The influence of OA status on citation impact
This study also draws on the idea that the accessibility of OA journals may give them greater citation impact than subscription journals of comparable quality. This assertion, set forth by Lawrence (2001) and subsequent authors (e.g., Copiello, 2019), is supported by some empirical investigations but not by others.
At the level of the individual article, OA status does tend to be associated with higher citation rates. However, this advantage can be fully attributed to factors other than OA status itself. For instance, OA and non-OA articles vary systematically with regard to field of inquiry, external funding, authors’ willingness to pay article processing charges, institutional support for OA publishing, and whether authors believe their findings are especially important or especially likely to appeal to a non-scholarly audience (self-selection). Many well-known studies have reported an OA citation advantage while controlling for just one or two (or none) of these confounding factors (e.g., Antelman, 2004; Dorta-González & Dorta-González, 2022, 2023a, 2023b; Eysenbach, 2006; Gargouri et al., 2010; Hadad & Aharony, 2023; Hadad et al., 2024; Koler-Povh et al., 2014; Sotudeh, 2020).
Studies that gauge the independent effect of OA status at the article level—those that include a full range of control variables or that randomly assign papers to OA or non-OA groups—reveal that all else equal, OA status has no independent impact on citation rates (Davis, 2011; Davis et al., 2008; Gaule & Maystre, 2011; Piwowar et al., 2018). This is not the same as no impact, of course. Moreover, there is some evidence of an independent effect for certain types of articles—those in particular subfields, for instance (Basson et al., 2021; Hubbard, 2017; Wang et al., 2021; Wray, 2016).
It is also possible that the influence of OA status on citation rates may be greater for entire journals than for individual articles. For instance, the title of an OA journal (e.g., PLoS Biology) often signals that the journal content is freely available, so potential readers know in advance that there will be no barriers to access. In contrast, OA papers published elsewhere—in hybrid journals or OA archives, for instance—have no such advantage. Simple comparisons of OA and non-OA journals do not support the idea that OA journals have greater citation impact (Björk & Solomon, 2012; Khan et al., 2023), although most studies of subscription journals that have “flipped” to OA status show that the transition to Open Access does bring a citation advantage (Asai, 2023; Bautista-Puig et al., 2020; Momeni et al., 2021). One recent paper reports mixed results (Wang et al., 2019), and one study of journals that have “reverse flipped” suggests that the transition from OA to subscription status also brings an increase in citations (Ming & Zhao, 2022).
Finally, two recent studies have shown that OA articles in hybrid journals—journals that publish both OA and non-OA articles—have higher citation rates than those published in fully OA journals (Hadad et al., 2024; Maddi & Sapinho, 2022). This challenges the idea that fully OA journals gain a citation advantage by signaling their OA status to potential readers. On the other hand, it can also be attributed to a high degree of self-selection—that authors choose to publish only their higher-impact papers as OA articles in hybrid journals.
3 Methods and materials
3.1 CABS ratings
While at least five expert ratings of business journals are in current use, CABS is perhaps the most widely adopted by universities and other organizations that evaluate research contributions in business and economics. Moreover, CABS is the expert rating most closely related to the other four, based on the correlations among them (Walters, 2024). That is, CABS best represents the set of all five ratings.
The CABS ratings, assigned in March 2021, are based on the opinions of 53 experts appointed by the Chartered Association of Business Schools (UK), who consulted with other researchers as well as representatives of scholarly and professional societies. The rating criteria include reputation, selectivity, perceived scholarly impact, adherence to high methodological standards, and rigor and transparency of peer review. Raters were provided with a range of citation data, but those data were not formally incorporated into the ratings. The final ratings, from 4* (most important) to 1 (least important), were assigned after discussion and consensus among the raters. Overall, 3% of the CABS journals were assigned ratings of 4* (recoded as 5 in the current study). Six percent have ratings of 4, 19% have ratings of 3, 32% have ratings of 2, and 41% have ratings of 1 (Chartered Association of Business Schools, 2021).
3.2 Citation metrics
Four citation metrics were selected for this investigation. Two of them, 5IF (five-year Impact Factor) and CiteScore, are among the indicators most often reported by publishers and used by research evaluators. Two others, AI (Article Influence score) and SJR (SCImago Journal Rank), are the citation metrics most closely related to CABS (Walters, 2024). 5IF and CiteScore are straightforward; they represent, essentially, the average number of citations accrued in the 1-3 years since publication. In contrast, AI and SJR are weighted and normalized; they account for both (a) the impact of the journals that cite each article and (b) differences in citation rates across fields of study (Bornmann, 2020; González-Pereira et al., 2010; Guerrero-Bote & Moya-Anegón, 2012; SCImago Research Group, 2007; Walters, 2017a; West et al., 2010, 2013). Further details about the CABS ratings and the citation metrics, including frequency distributions and correlations, are presented elsewhere (Walters, 2024).
3.3 OA and non-OA journals
The journals included in the analysis are those covered by both CABS and either Journal Citation Reports (Web of Science) or Scopus (Chartered Association of Business Schools, 2021; Clarivate, 2023; Elsevier, 2023). The selection standards of Web of Science and Scopus ensure that predatory or marginal journals are excluded, and none of the OA journals in this analysis appear on Beall’s List (Beall, 2021; Clarivate, 2024; Meester, 2021).
Within the set of 1,561 journals, the 85 OA journals are those that make both current issues and back issues freely available online. Journals with optional or hybrid OA status—those in which only some articles are freely available—were not counted as OA, nor were “subscribe to open” journals, where the journal becomes freely accessible only when a particular number of subscriptions have been sold and maintained. Likewise, journals that adopted OA status in 2021 or later were not regarded as OA, since they were still subscription journals at the time of the CABS evaluations. Information on OA adoption dates was obtained from the Directory of Open Access Journals, the journals’ web sites, and other online sources.
3.4 Regression analyses
Four regressions were conducted for the full set of journals. Each used a single citation metric—5IF, CiteScore, AI, or SJR—and an OA dummy variable (OA or non-OA) to predict CABS. The goal was not to identify the determinants of CABS ratings, but to evaluate the impact of OA status. Likewise, four regressions were conducted for the set of business journals (i.e., excluding those in the CABS economics, general psychology, and social science categories) and four for the set of economics journals.
In each regression, the citation metrics were entered in square root or log10 form. This approach, adopted by several recent authors, was undertaken to maintain linearity, to ensure the best fit, and to account for the strong right skew of the citation distribution (Bradshaw & Brook, 2016; Saarela & Kärkkäinen, 2020; Thelwall, 2022; Thelwall et al., 2023; Walters, 2017b). For this investigation, the substantive results are the same regardless of whether the citation metrics are transformed.
Although we cannot assume measurement invariance across the five CABS ratings—that the difference between ratings of 1 and 2 is equal to the difference between ratings of 4 and 5, for instance—there is good justification for treating CABS as a continuous variable in the regressions. There are three reasons for this. First, the underlying constructs (such as quality or reputation) represented by scores that combine individuals’ ratings may be continuous even when the actual rating categories are not. Second, there is reliable evidence that violations of measurement invariance do not necessarily invalidate the results of techniques such as OLS regression. Finally, the use of methods meant for ordinal variables would result in the loss of valuable information about the shape of the variables’ distributions (Robitzsch, 2020, 2022; Robitzsch & Lüdtke, 2023).
Because the study data include the entire population—all the journals for which both CABS ratings and citation data are available—there is no need to draw conclusions about the population on the basis of sample characteristics (i.e., no need for significance tests). Nonetheless, nearly all the results achieve statistical significance if we assume that our data refer to a larger hypothetical population. The significance levels reported in the regression results are for Student’s t test, two-tailed.
4 Results
4.1 All CABS journals
Table 1. Descriptives for all CABS journals—the journals in all 22 CABS subject categories. |
| Variable | Non-OA Mean | Non-OA SD | Non-OA N | OA Mean | OA SD | OA N |
|---|---|---|---|---|---|---|
| OA | 0.00 | 0.00 | 1,476 | 1.00 | 0.00 | 85 |
| CABS | 2.06 | 1.04 | 1,476 | 1.32 | 0.69 | 85 |
| 5IF | 4.01 | 3.33 | 1,242 | 2.45 | 2.76 | 59 |
| CiteScore | 5.50 | 4.52 | 1,433 | 2.96 | 2.57 | 80 |
| AI | 1.30 | 1.84 | 1,242 | 0.75 | 1.71 | 59 |
| SJR | 1.34 | 2.03 | 1,437 | 0.63 | 1.06 | 77 |
Table 2. Regression results: Predicting CABS using sqrt(5IF) and OA—all CABS journals. R2=0.30, SEE=0.88, n=1,301. |
| Variable | b | SE | Beta | Sig. |
|---|---|---|---|---|
| Sqrt(5IF) | 0.770 | 0.034 | 0.53 | < 0.01 |
| OA | -0.432 | 0.119 | -0.09 | < 0.01 |
| Y-intercept | 0.735 | 0.069 | — | < 0.01 |
Table 3. Regression results: Predicting CABS using sqrt(CiteScore) and OA—all CABS journals. R2=0.24, SEE=0.90, n=1,513. |
| Variable | b | SE | Beta | Sig. |
|---|---|---|---|---|
| Sqrt(CiteScore) | 0.577 | 0.028 | 0.47 | < 0.01 |
| OA | -0.410 | 0.105 | -0.09 | < 0.01 |
| Y-intercept | 0.807 | 0.065 | — | < 0.01 |
Table 4. Regression results: Predicting CABS using log10(AI) and OA—all CABS journals. R2=0.53, SEE=0.73, n=1,301. |
| Variable | b | SE | Beta | Sig. |
|---|---|---|---|---|
| log10(AI) | 1.865 | 0.050 | 0.72 | < 0.01 |
| OA | -0.219 | 0.098 | -0.04 | < 0.01 |
| Y-intercept | 2.344 | 0.021 | — | 0.03 |
Table 5. Regression results: Predicting CABS using sqrt(SJR) and OA—all CABS journals. R2=0.52, SEE=0.72, n=1,514. |
| Variable | b | SE | Beta | Sig. |
|---|---|---|---|---|
| Sqrt(SJR) | 1.362 | 0.035 | 0.71 | < 0.01 |
| OA | -0.294 | 0.085 | -0.06 | < 0.01 |
| Y-intercept | 0.671 | 0.040 | — | < 0.01 |
As shown in Table 1, OA journals in business and economics tend to appear considerably lower in the status hierarchy than conventional subscription journals, in terms of both subjective reputation (CABS) and citation impact (5IF, CiteScore, AI, and SJR). The OA/non-OA differential is more pronounced for CABS than for the citation metrics, when expressed in standard deviations.
Moreover, the CABS ratings of the OA journals are consistently lower than the ratings we might expect based solely on the journals’ citation impact. (See the OA coefficients in Tables 2-5.) This trend can be seen across all four citation metrics. For instance, the OA business and economics journals have, on average, actual CABS ratings about 0.43 points lower than those of non-OA journals with the same 5IF scores. A similar differential can be seen for the CiteScore equation, although the effect of OA status is not as great when AI and SJR are used to predict CABS. Taken together, these results show that expert reviewers evaluating OA journals do assign them ratings that are low relative to their citation impact. That is, OA business and economics journals have high citation impact relative to their CABS reputation scores.
4.2 Business journals
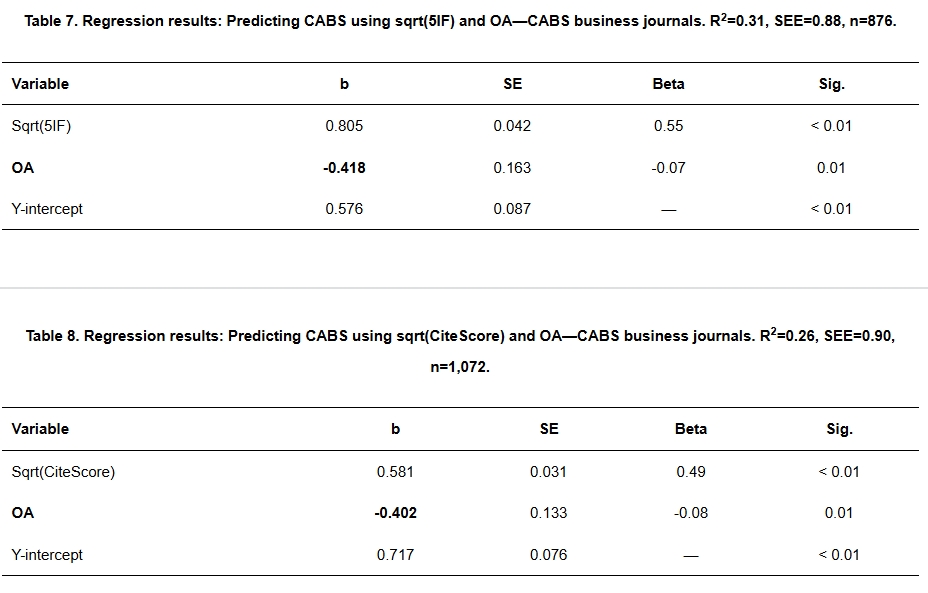
The relationships shown in Table 1 persist when only those journals with a clear business focus are included in the analysis—when the journals in the CABS economics, econometrics and statistics; psychology (general); and social sciences categories are excluded. Like Table 1, Table 6 reveals both low CABS ratings and low citation impact for the OA journals. It also shows an OA/non-OA differential that is greater for CABS than for the citation metrics, in terms of standard deviations. And, as before, the mean CABS rating of the OA journals is consistently lower than the mean rating we would expect based solely on the journals’ citation impact. (See Tables 7-10.) On average, the OA business journals have actual CABS ratings about 0.42 points lower than those of non-OA journals with the same 5IF scores. The OA differential is 0.40 points when CiteScore is used as the citation metric, 0.16 when AI is used, and 0.21 when SJR is used. Again, we can see that the OA journals have low subjective ratings relative to their citation impact, and that this relationship persists across all four citation metrics.
Table 6. Descriptives for the CABS business journals—excluding the journals in the CABS economics, econometrics and statistics; psychology (general); and social sciences categories. |
| Variable | Non-OA Mean | Non-OA SD | Non-OA N | OA Mean | OA SD | OA N |
|---|---|---|---|---|---|---|
| OA | 0.00 | 0.00 | 1,051 | 1.00 | 0.00 | 52 |
| CABS | 2.00 | 1.04 | 1,051 | 1.25 | 0.48 | 52 |
| 5IF | 4.34 | 3.31 | 845 | 2.44 | 2.38 | 31 |
| CiteScore | 5.79 | 4.61 | 1,023 | 2.94 | 2.48 | 49 |
| AI | 1.12 | 1.27 | 845 | 0.43 | 0.34 | 31 |
| SJR | 1.24 | 1.54 | 1,027 | 0.47 | 0.41 | 46 |
Table 7. Regression results: Predicting CABS using sqrt(5IF) and OA—CABS business journals. R2=0.31, SEE=0.88, n=876. |
| Variable | b | SE | Beta | Sig. |
|---|---|---|---|---|
| Sqrt(5IF) | 0.805 | 0.042 | 0.55 | < 0.01 |
| OA | -0.418 | 0.163 | -0.07 | 0.01 |
| Y-intercept | 0.576 | 0.087 | — | < 0.01 |
Table 8. Regression results: Predicting CABS using sqrt(CiteScore) and OA—CABS business journals. R2=0.26, SEE=0.90, n=1,072. |
| Variable | b | SE | Beta | Sig. |
|---|---|---|---|---|
| Sqrt(CiteScore) | 0.581 | 0.031 | 0.49 | < 0.01 |
| OA | -0.402 | 0.133 | -0.08 | 0.01 |
| Y-intercept | 0.717 | 0.076 | — | < 0.01 |
Table 9. Regression results: Predicting CABS using log10(AI) and OA—CABS business journals. R2=0.51, SEE=0.74, n=876. |
| Variable | b | SE | Beta | Sig. |
|---|---|---|---|---|
| log10(AI) | 1.955 | 0.066 | 0.71 | < 0.01 |
| OA | -0.158 | 0.138 | -0.03 | 0.25 |
| Y-intercept | 2.394 | 0.027 | — | 0.01 |
Table 10. Regression results: Predicting CABS using sqrt(SJR) and OA—CABS business journals. R2=0.54, SEE=0.71, n=1,073. |
| Variable | b | SE | Beta | Sig. |
|---|---|---|---|---|
| Sqrt(SJR) | 1.536 | 0.045 | 0.73 | < 0.01 |
| OA | -0.214 | 0.108 | -0.04 | 0.05 |
| Y-intercept | 0.485 | 0.050 | — | < 0.01 |
4.3 Economics journals
Tables 11-15 present very similar results for the journals in the CABS economics, econometrics and statistics category. On average, the OA economics journals have actual CABS ratings about 0.43 points lower than those of non-OA journals with the same 5IF scores. As the tables show, the disparity between citation impact and reputation is even stronger for OA economics journals than for OA business journals.
Table 11. Descriptives for the CABS economics journals—those in the CABS economics, econometrics and statistics category. |
| Variable | Non-OA Mean | Non-OA SD | Non-OA N | OA Mean | OA SD | OA N |
|---|---|---|---|---|---|---|
| OA | 0.00 | 0.00 | 287 | 1.00 | 0.00 | 26 |
| CABS | 2.11 | 0.98 | 287 | 1.46 | 0.99 | 26 |
| 5IF | 2.87 | 2.53 | 266 | 2.19 | 3.17 | 22 |
| CiteScore | 4.10 | 3.35 | 278 | 2.86 | 2.94 | 25 |
| AI | 1.68 | 2.94 | 266 | 1.16 | 2.74 | 22 |
| SJR | 1.71 | 3.40 | 278 | 0.94 | 1.75 | 25 |
Table 12. Regression results: Predicting CABS using sqrt(5IF) and OA—CABS business journals. R2=0.31, SEE=0.83, n=288. |
| Variable | b | SE | Beta | Sig. |
|---|---|---|---|---|
| Sqrt(5IF) | 0.856 | 0.079 | 0.53 | < 0.01 |
| OA | -0.434 | 0.186 | -0.12 | 0.02 |
| Y-intercept | 0.838 | 0.135 | — | < 0.01 |
Table 13. Regression results: Predicting CABS using sqrt (CiteScore) and OA—CABS business journals. R2=0.22, SEE=0.89, n=303. |
| Variable | b | SE | Beta | Sig. |
|---|---|---|---|---|
| Sqrt(CiteScore) | 0.627 | 0.073 | 0.44 | < 0.01 |
| OA | -0.446 | 0.187 | -0.12 | 0.02 |
| Y-intercept | 0.939 | 0.149 | — | < 0.01 |
Table 14. Regression results: Predicting CABS using log10(AI) and OA—CABS business journals. R2=0.63, SEE=0.61, n=288. |
| Variable | b | SE | Beta | Sig. |
|---|---|---|---|---|
| log10(AI) | 1.705 | 0.079 | 0.79 | < 0.01 |
| OA | -0.181 | 0.136 | -0.05 | 0.19 |
| Y-intercept | 2.290 | 0.038 | — | < 0.01 |
Table 15. Regression results: Predicting CABS using sqrt(SJR) and OA—CABS business journals. R2=0.56, SEE=0.67, n=303. |
| Variable | b | SE | Beta | Sig. |
|---|---|---|---|---|
| Sqrt(SJR) | 1.016 | 0.054 | 0.73 | < 0.01 |
| OA | -0.367 | 0.141 | -0.10 | 0.01 |
| Y-intercept | 1.030 | 0.071 | — | < 0.01 |
5 Discussion
As noted in previous research, there are at least six dimensions of journal quality: editors’ and publishers’ intentions, adherence to accepted norms of peer review, adherence to other norms of scholarly publishing, scholarly reputation, impact on subsequent scholarship, and impact on teaching and practice (Walters, 2022). This analysis used data for 1,561 business and economics journals to evaluate the relationships between two of those constructs: scholarly reputation (as assessed by expert evaluators) and impact on subsequent scholarship (citation impact). As expected, OA journals have low reputation scores relative to their citation impact—that is, high citation impact relative to their subjectively assessed reputation.
If we regard quality as an attribute of individual articles and “journal quality” as the aggregate of those individual assessments, there are at least two possible explanations for the findings reported here. First, evaluators in business and economics may be biased against OA journals due to the journals’ unconventional business models, the idea that authors (or their institutions) should pay to publish, or the possibility that OA journals might increase their revenue through higher acceptance rates (more papers published and more fees paid) (Borrego, 2023; Dalton et al., 2020; Feenstra & López-Cózar, 2022; Halevi & Walsh, 2021; Hayman, 2016; Segado-Boy et al., 2022; Togia & Korobili, 2014). Second, OA journals in business and economics may have especially high citation impact, relative to their quality, due to their increased readership—the fact that more potential readers (citers) have easy access to each paper (Asai, 2023; Bautista-Puig et al., 2020; Copiello, 2019; Lawrence, 2001; Momeni et al., 2021). Unfortunately, the available data provide no way of determining whether either, or both, of these explanations are supported.
A third possibility also comes to mind: that despite any anti-OA bias, OA journals have especially high citation rates due to authors’ self-selection of articles during the submission process. That is, authors may send their best work, or the work most likely to benefit from a wide readership, to OA journals rather than subscription journals (Davis, 2011; Davis et al., 2008; Gaule & Maystre, 2011; Hadad et al., 2024; Maddi & Sapinho, 2022). This third explanation is not consistent with the evidence presented here, however, since OA journals in business and economics have mean CABS ratings and mean citation impact values lower than those of non-OA journals. When we say that these OA journals have relatively high citation impact, it is only in comparison with their own CABS ratings. Self-selection may result in higher citation rates for the best OA journals, but probably not for OA business or economics journals in general.
Regardless of the evaluator, reader, and author behaviors underlying these findings, the results of this investigation do have two clear implications. First, authors should consider publishing in OA journals when overall readership and citation impact are especially important, or when journal reputation within a particular academic discipline is less important. Second, by replicating this study every few years, we should be able to determine whether citation impact scores and subjective quality assessments of OA and non-OA journals are converging. The regression analyses are relatively easy to undertake, and the OA coefficients provide a useful indicator of the extent to which anti-OA bias (or the citation advantage of OA journals) is diminishing over time—whether OA journals are achieving full acceptance within the scholarly communication system.
The results reported here are specific to the CABS journal ratings, the four citation metrics chosen for the analysis, and a particular set of subject areas. However, there is strong evidence that CABS is closely related to several other expert ratings, and that 5IF, CiteScore, AI, and SJR are representative of other citation metrics that might have been chosen (Walters, 2024). Very similar findings were obtained for all four citation metrics, and the data source—Web of Science (5IF, AI) or Scopus (CiteScore, SJR)—does not seem to influence the results. This last point is important, since Web of Science is considerably more selective than Scopus in the journals it covers. This suggests that similar results are obtained whether the population includes the full range of journals or just the upper portion of the distribution (based on citation impact). Finally, the results of this study may be limited to business and economics, but the methods can be applied to a wide range of subject areas—any disciplines for which expert journal ratings and citation metrics are available.
Conflict of interests
This research was conducted in the absence of any relationships that could be construed as potential conflicts of interest.
Data availability statements
The data compiled for this study will be supplied by the author on request.