

1 Introduction
2 Review of literature
2.1 Research impact contributing factors
2.2 Research Impact Quintuple Helix Model
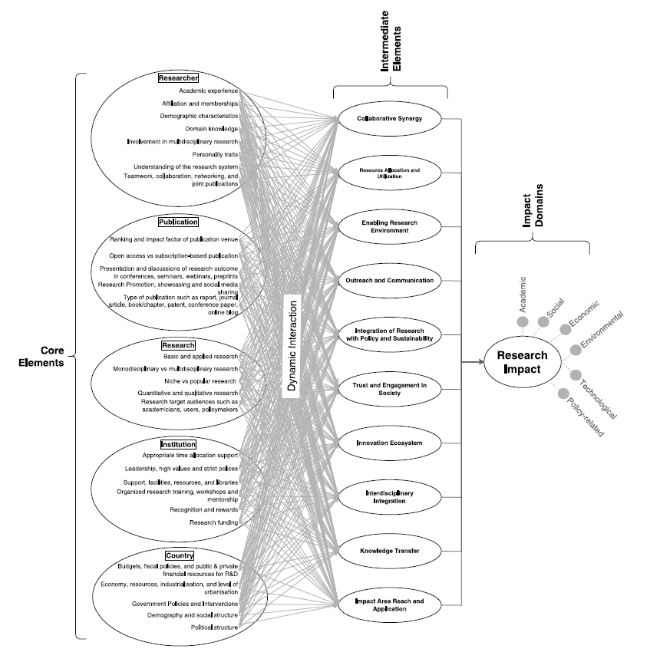
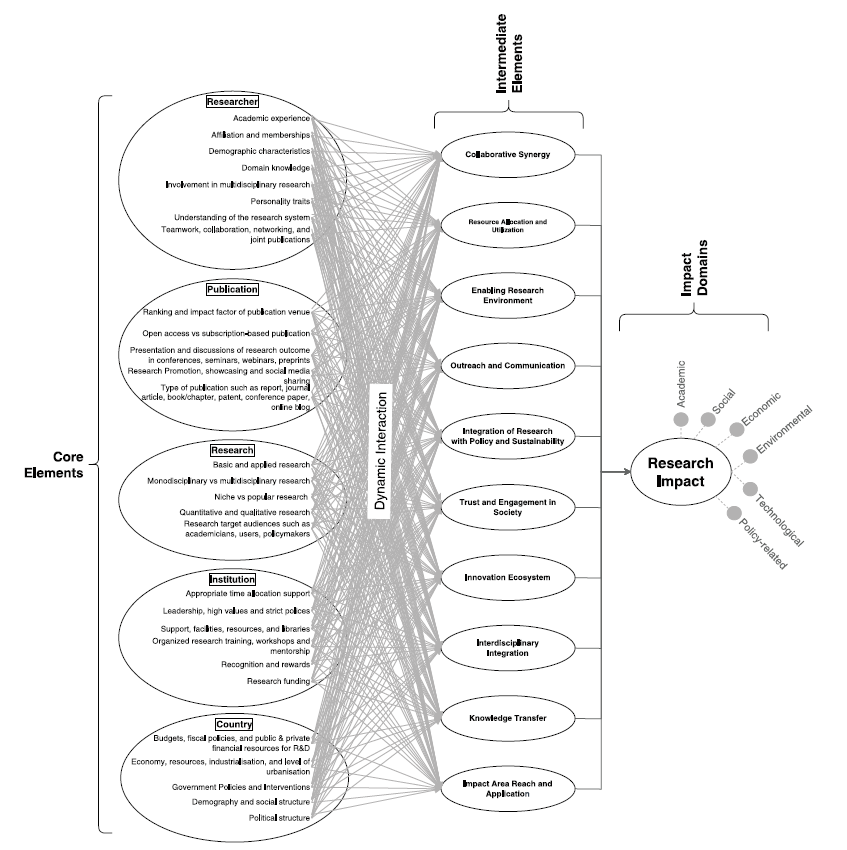
Figure 1. Interaction among research contribution factors.Source: After Arsalan et al. (2024) |
3 Methodology
3.1 Data collection
3.2 Statistical analysis
Figure 2. The conceptual Quintuple Helix Model for research impact. |
4 Results
Table 1. Distribution of participants. |
| PRA | Male | Female | Total | Regions | ||||||
|---|---|---|---|---|---|---|---|---|---|---|
| Count | PRA % | Gender % | Total % | Count | PRA % | Gender % | Total % | |||
| ASET | 86 | 61.4% | 21.9% | 13.7% | 54 | 38.6% | 22.8% | 8.6% | 140 |  |
| BS | 68 | 60.7% | 17.3% | 10.8% | 44 | 39.3% | 18.6% | 7.0% | 112 |  |
| HS | 39 | 61.9% | 9.9% | 6.2% | 24 | 38.1% | 10.1% | 3.8% | 63 |  |
| SS | 200 | 63.5% | 50.9% | 31.7% | 115 | 36.5% | 48.5% | 18.3% | 315 |  |
| Total | 393 | 62.4% | 100.0% | 62.4% | 237 | 37.6% | 100.0% | 37.6% | 630 |  |
PRA = Primary research area, AEST = Applied sciences, engineering and technology, BS = Basic sciences, HS = Health sciences, and SS = Social sciences. |
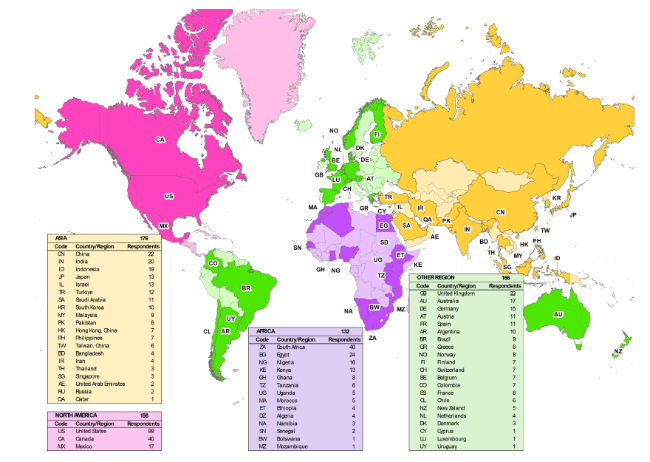
Figure 3. Spatial distribution of respondents. |
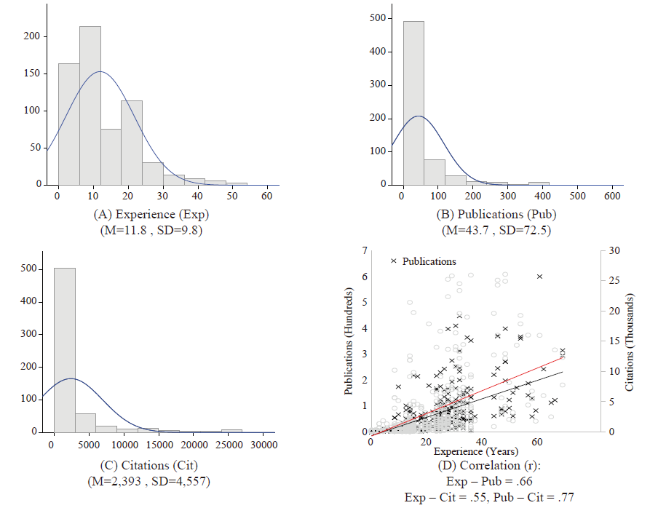
Figure 4. Researcher survey results: (A) Experience, (B) Publications, (C) Citations, and (D) Correlations between these metrics. |
Table 2. Summary statistics, proportions and one sample proportion test for individual factors. |
| Variable# | Descriptive Summary | Response Proportions | Rank | One sample Exact binomial test (n=630, One tailed successful proportion: π>.4) | ||||||||||||
|---|---|---|---|---|---|---|---|---|---|---|---|---|---|---|---|---|
| Mean | SD | Median | IQR | EP | Not significant | Slightly significant | Moderately significant | Highly significant | Extremely significant | Highly significant and above count (N) | Clopper-Pearson CI (95%) | p-Val | Successful Probability () | H0: π≤.4) | ||
| R1 | 1.85 | 0.82 | 2 | 1 | 36.98 | 38.57 | 41.59 | 16.35 | 3.33 | 0.16 | 29 | 22 | .024 - 1 | .999 | .035 | Accepted |
| R2 | 2.39 | 0.94 | 2 | 1 | 47.84 | 16.03 | 43.17 | 27.62 | 11.9 | 1.27 | 24 | 83 | .110 - 1 | .999 | .132 | Accepted |
| R3 | 1.95 | 0.89 | 2 | 1 | 38.92 | 34.92 | 42.54 | 16.19 | 5.71 | 0.63 | 28 | 40 | .048 - 1 | .999 | .063 | Accepted |
| R4 | 2.01 | 0.93 | 2 | 1.75 | 40.19 | 32.86 | 42.06 | 17.62 | 6.19 | 1.27 | 26 | 47 | .058 - 1 | .999 | .075 | Accepted |
| R5 | 2.40 | 1.00 | 2 | 1 | 48.06 | 17.30 | 42.38 | 26.03 | 11.27 | 3.02 | 23 | 90 | .120 - 1 | .999 | .143 | Accepted |
| P1 | 2.01 | 0.86 | 2 | 1 | 40.19 | 30.16 | 44.92 | 18.89 | 5.87 | 0.16 | 27 | 38 | .045 - 1 | .999 | .060 | Accepted |
| P2 | 3.19 | 0.94 | 3 | 1 | 63.78 | 3.02 | 21.43 | 34.92 | 34.92 | 5.71 | 14 | 256 | .374 - 1 | .387 | .406 | Accepted |
| P3 | 2.55 | 0.90 | 3 | 1 | 51.05 | 10.95 | 38.89 | 35.08 | 14.13 | 0.95 | 21 | 95 | .128 - 1 | .999 | .151 | Accepted |
| P4 | 3.23 | 0.90 | 3 | 1 | 64.54 | 2.70 | 17.62 | 39.84 | 33.97 | 5.87 | 13 | 251 | .366 - 1 | .547 | .398 | Accepted |
| P5 | 2.93 | 0.96 | 3 | 2 | 58.54 | 6.03 | 28.1 | 36.51 | 25.87 | 3.49 | 18 | 185 | .264 - 1 | .999 | .294 | Accepted |
| RR1 | 3.68 | 0.94 | 4 | 1 | 73.56 | 3.33 | 6.67 | 25.56 | 47.78 | 16.67 | 8 | 406 | .612 - 1 | .000** | .644 | Rejected |
| RR2 | 3.90 | 0.88 | 4 | 2 | 77.97 | 1.11 | 4.92 | 22.7 | 45.56 | 25.71 | 3 | 449 | .682 - 1 | .000** | .713 | Rejected |
| RR3 | 2.69 | 1.25 | 3 | 3 | 53.78 | 26.67 | 12.22 | 33.33 | 21.11 | 6.67 | 19 | 175 | .248 - 1 | .999 | .278 | Accepted |
| RR4 | 3.50 | 0.92 | 4 | 1 | 69.94 | 1.59 | 12.86 | 31.9 | 41.59 | 12.06 | 11 | 338 | .503 - 1 | .000** | .537 | Rejected |
| RR5 | 2.13 | 0.88 | 2 | 2 | 42.57 | 25.24 | 44.29 | 23.33 | 6.67 | 0.48 | 25 | 45 | .055 - 1 | .999 | .071 | Accepted |
| RR6 | 2.60 | 0.93 | 3 | 1 | 52.10 | 10.32 | 38.25 | 33.97 | 15.56 | 1.9 | 20 | 110 | .150 - 1 | .999 | .175 | Accepted |
| RR7 | 3.80 | 0.96 | 4 | 1 | 75.97 | 2.22 | 7.78 | 21.43 | 45.08 | 23.49 | 4 | 432 | .654 - 1 | .000** | .686 | Rejected |
| RR8 | 3.69 | 1.10 | 4 | 1 | 73.78 | 5.56 | 8.89 | 21.11 | 40 | 24.44 | 6 | 406 | .612 - 1 | .000** | .644 | Rejected |
| I1 | 4.02 | 0.98 | 4 | 1 | 80.44 | 3.33 | 3.33 | 16.67 | 41.11 | 35.56 | 2 | 483 | .737 - 1 | .000** | .767 | Rejected |
| I2 | 4.09 | 0.87 | 4 | 1 | 81.71 | 0.48 | 4.29 | 18.25 | 40.16 | 36.83 | 1 | 485 | .741 - 1 | .000** | .770 | Rejected |
| I3 | 3.78 | 0.89 | 4 | 1 | 75.68 | 0.48 | 8.41 | 24.6 | 45.24 | 21.27 | 5 | 419 | .633 - 1 | .000** | .665 | Rejected |
| I4 | 3.69 | 0.90 | 4 | 1 | 73.75 | 0.95 | 9.21 | 27.62 | 44.6 | 17.62 | 7 | 392 | .589 - 1 | .000** | .622 | Rejected |
| I5 | 3.52 | 1.20 | 4 | 1 | 70.44 | 7.78 | 11.11 | 26.67 | 30 | 24.44 | 10 | 343 | .511 - 1 | .000** | .544 | Rejected |
| I6 | 3.54 | 0.96 | 4 | 1 | 70.89 | 3.02 | 10.79 | 29.05 | 43.02 | 14.13 | 9 | 360 | .538 - 1 | .000** | .571 | Rejected |
| N1 | 3.03 | 0.92 | 3 | 2 | 60.67 | 3.49 | 26.67 | 36.67 | 29.37 | 3.81 | 17 | 209 | .301 - 1 | .999 | .332 | Accepted |
| N2 | 2.41 | 0.91 | 2 | 1 | 48.25 | 14.13 | 44.13 | 29.21 | 11.43 | 1.11 | 22 | 79 | .104 - 1 | .999 | .125 | Accepted |
| N3 | 3.42 | 0.92 | 3 | 1 | 68.48 | 1.59 | 14.13 | 35.56 | 37.78 | 10.95 | 12 | 307 | .454 - 1 | .000** | .487 | Rejected |
| N4 | 3.05 | 0.90 | 3 | 2 | 61.05 | 2.22 | 26.83 | 38.89 | 27.62 | 4.44 | 16 | 202 | .290 - 1 | .999 | .321 | Accepted |
| N5 | 3.06 | 1.08 | 3 | 2 | 61.11 | 7.78 | 24.44 | 30 | 30 | 7.78 | 15 | 238 | .346 - 1 | .881 | .378 | Accepted |
SD = Standard deviation, IQR = Inter-quartile range, CI = 95% confidence interval EP = Expected probability (Total response frequency for each variable / Maximum number of possible responses for the variable) Null Hypothesis: The proportion of highly significant is less than or equal to 0.4 (H0: <=.4) Alternate Hypothesis: The proportion of highly significant and above is more than 0.4 (Ha: >.4) ** Significant p-Val < 0.001 # See Table 4 |
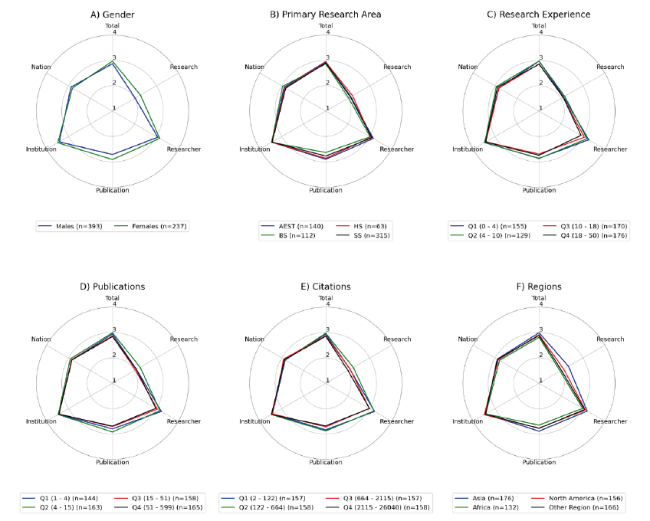
Figure 5. Comparison of mean scores for research impact factors across different groups. |
Table 3. Factors having significant mean differences (MD) within groups. |
| Group | Var♣ | Statistics | ES η2 | Group | Var♣ | Statistics | ES η2 | Group | Var♣ | Statistics | ES Cohen’s -d |
|---|---|---|---|---|---|---|---|---|---|---|---|
| PRA # | P3 | F(3, 626)=3.733, p=.011* | .018 | Citations# | R1 | F(3, 626)=3.542, p=.014* | .017 | Gender## | R1 | t(628)=-3.921, p=.000** | -.323 |
| RR2 | F(3, 626)=4.193, p=.006* | .020 | RR5 | F(3, 626)=2.922, p=.033* | .014 | R2 | t(628)=-3.106, p=.002* | -.255 | |||
| P-A | F(3, 626)=3.225, p=.022* | .015 | RR6 | F(3, 626)=2.904, p=.034* | .014 | R3 | t(628)=-3.044, p=.002* | -.250 | |||
| Publications# | R1 | F(3, 626)=2.793, p=.040* | .013 | R-A | F(3, 626)=2.718, p=.044* | .013 | R4 | t(628)=-3.088, p=.002* | -.254 | ||
| P4 | F(3, 626)=4.044, p=.007* | .019 | RR-A | F(3, 626)=5.631, p=.001* | .026 | R5 | t(628)=-3.194, p=.001* | -.263 | |||
| RR-A | F(3, 626)=4.524, p=.004* | .021 | P-A | F(3, 626)=2.713, p=.044* | .013 | P2 | t(628)=-2.934, p=.003* | -.241 | |||
| P-A | F(3, 626)=3.520, p=.015* | .017 | T-A | F(3, 626)=2.899, p=.034* | .014 | P3 | t(628)=-2.582, p=.010* | -.212 | |||
| T-A | F(3, 626)=3.801, p=.010* | .018 | Region# | R1 | F(3, 626)=4.356, p=.005* | .020 | P4 | t(628)=-2.591, p=.010* | -.213 | ||
| Experience# | RR2 | F(3, 626)=3.627, p=.013* | .017 | R3 | F(3, 626)=9.081, p=.000** | .042 | P5 | t(628)=-3.316, p=.001* | -.273 | ||
| RR4 | F(3, 626)=2.866, p=.036* | .014 | R4 | F(3, 626)=4.104, p=.007* | .019 | R-A | t(628)=-3.881, p=.000** | -.319 | |||
| RR6 | F(3, 626)=4.859, p=.002* | .023 | R5 | F(3, 626)=7.539, p=.000** | .035 | P-A | t(628)=-3.417, p=.001* | -.281 | |||
| RR-A | F(3, 626)=8.415, p=.000** | .039 | P5 | F(3, 626)=2.683, p=.046* | .013 | T-A | t(628)=-2.861, p=.004* | -.235 | |||
| T-A | F(3, 626)=3.495, p=.015* | .016 | R-A | F(3, 626)=8.123, p=.000** | .037 | ||||||
| P-A | F(3, 626)=2.990, p=.030* | .014 | |||||||||
| T-A | F(3, 626)=4.597, p=.003* | .022 |
ANOVA Effect Size: η2 = 0.01 => Small (S); η2 = 0.06 => Medium (M); η2 = 0.14 => Large (L) T-test Effect Size: Cohen’s d = 0.20 => Small (S); Cohen’s D = 0.50 => Medium (M); Cohen’s D = 0.80 => Large (L) Level of significance: ** Null hypothesis rejected with p <.001; * Null hypothesis rejected with p <.005 Null hypothesis (): There is no significant mean difference between groups ♣See Table 1 # One-way ANOVA test results ## Independent-Sample t-test results |
Table 4. Factor categories, variables and reliability. |
| Factor Groups (FGs) | Description | Variable | Reliability |
|---|---|---|---|
| Researcher | Academic experience | RR1 | Cronbach’s α = 0.588 After excluding RR1, RR3 & RR8 Cronbach’s α = 0.813 |
| Affiliation and memberships | RR2 | ||
| Demographic characteristics | RR3 | ||
| Domain knowledge | RR4 | ||
| Involvement in multidisciplinary research | RR5 | ||
| Personality traits | RR6 | ||
| Understanding of the research system | RR7 | ||
| Teamwork, collaboration, networking, and joint publications | RR8 | ||
| Research | Monodisciplinary, multidisciplinary and interdisciplinary research | R1 | Cronbach’s α =.896 |
| Niche vs popular research areas | R2 | ||
| Qualitative and quantitative research | R3 | ||
| Research target audiences such as academicians, users, policymakers | R4 | ||
| Basic and applied research | R5 | ||
| Publication | Post-publication Research Promotion, Showcasing and Social Media Sharing | P1 | Cronbach’s α =.846 |
| Open Access vs Subscription-based Publication | P2 | ||
| Pre-publication Presentations and Discussions of Research Outcomes in Conferences, Seminars, Webinars, and Preprints | P3 | ||
| Ranking and Impact Factor of Publication Venues | P4 | ||
| Publication Venues such as Reports, Journal Articles, Books/Chapters, Patents, Conference Papers, Online Blog | P5 | ||
| Institutional | Appropriate time allocation | I1 | Cronbach’s α =0.621 After excluding I1 & I5 Cronbach’s α = 0.847 |
| Leadership, high values and strict policies | I2 | ||
| Support, facilities, resources and libraries | I3 | ||
| Organised Research Training, Workshops and Mentorship | I4 | ||
| Recognition and rewards | I5 | ||
| Research funding | I6 | ||
| National | Budgets, Fiscal Policies, and Public-Private Financial Resources for R&D | N1 | Cronbach’s α = 0.711 After excluding N5 Cronbach’s α = 0.828 |
| Demography and social structure | N2 | ||
| Economy, Resources, Industrialisation, and Level of Urbanisation | N3 | ||
| Government Policies and Interventions | N4 | ||
| Political structure | N5 | ||
| Mean scores | Average of research factors group | R-A | |
| Average of researcher factors group | RR-A | ||
| Average of publication factors group | P-A | ||
| Average of institutional factors group | I-A | ||
| Average of national factors group | N-A | ||
| Average of all factors | T-A |
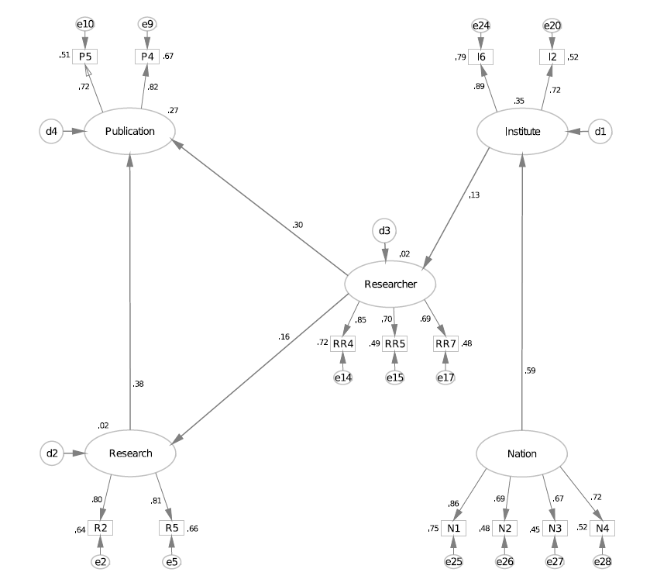
Figure 6. Optimised Path Model (OPM). |