

In our previous work, we learnt that annual fractional journal growth, x, decreases impact factor (all else being held equal) (Phan-Thien & Giacomin, 2024; Zatloukal et al., 2024a), and that the CiteScore is decreased even further (all else being held equal) (Phan-Thien et al., 2024; Zatloukal, 2024b). From these prior contributions, we learn that both of these journal bibliographic metrics depend upon (i) journal growth, and (ii) annual fractional citation growth, y. Table 1 defines our variables, both dimensionless and dimensional. From Table 1, we learn that x = 1 corresponds to no annual growth. By annual fractional citation growth, y, we mean articles published in year n1 continuing to attract citations and augmented by a fraction y in subsequent years simply, and at least, by virtue of having (i) more elapsed time or (ii) more exposure to other citing papers.
Table 1. Variables with Dimensions. |
| Name | Symbol | Calculation | Dimensions |
|---|---|---|---|
| fractional biennial publication growth, Eq. (32) | X | $\frac{2 p_{3}}{p_{1}+p_{2}}$ | dimensionless |
| fractional annual citation growth, Eq. (7) | Y | $\frac{1}{2}\left[\sqrt{(x+1)^{2}+4 \frac{\mathrm{IF}}{\overline{\mathrm{II}}}(2+x)}-(x+1)\right]$ | dimensionless |
| fractional annual publication growth | x | ratio of citable items in the current and previous year, p3/p2 | dimensionless |
| growth penalty, Eq. (5) | $\overline{\mathrm{IF}}\left(n_{3}\right)$ | $\frac{2(y+1+x)}{(y+1)(2+x)}$ | dimensionless |
| growth-adjusted impact factor, Eq. (13) | GIF | $\frac{\operatorname{IF}\left(n_{3}\right)}{\overline{\operatorname{IF}}\left(n_{3}\right)}$ | citations/publication |
| immediacy index | II | Web of Science | citations/publication |
| impact factor | IF | Web of Science | citations/publication |
| journal urgency, Eq. (15) | Ur | $2 \frac{\operatorname{GIF}\left(n_{3}\right)}{\overline{\mathrm{I}}}$ | dimensionless |
| mean value of variable i, Eqs. (12) and (19) | μi | i | |
| number of articles and reviews (citable items) | p | Web of Science | number of publications |
| number of articles and reviews (citable items) in year ni | pi | Web of Science | number of publications |
| standard deviation of variable i | σi | i | |
| three-year mean immediacy index | $\overline{\mathrm{II}}$ | arithmetic mean of II for the current and two previous years | citations/publication |
| year | ni | Web of Science | year |
In this paper, we explore the physics of this curious and important quantity y whose range is 0 ≤ y < +∞. Table 1 lists our variables, both dimensional and dimensionless. Though our work is driven mainly by curiosity, its many applications for journal rankings, for instance, have not escaped our attention.
In our previous work, we also learnt that for some bibliographic metrics, the partial derivative of the metric, with respect to annual fractional growth, x, can be negative, and whose range is -1 ≤ x < +∞. For instance, we find for the impact factor that:
$\frac{\partial \mathrm{IF}\left(n_{3}\right)}{\partial x}<0$
and similarly, for the CiteScore, that:
$\frac{\partial \mathrm{CS}\left(n_{3}\right)}{\partial x}<0$
in which the impact factor is given by (Eq. (1) of (Phan-Thien & Giacomin, 2024); Eq. (1) of (Li et al., 2024)):
$\operatorname{IF}\left(n_{3}\right)=\frac{y(y+1+x)}{2+x} \overline{\mathrm{II}}$
and the CiteScore by Eq. (5) of (Phan-Thien et al., 2024). When ∂⁄∂x of the bibliographic metric is negative, we call the metric anticompetitive. By anticompetitive, we at least mean that (holding all else constant), the metric can be increased by publishing fewer papers (x < 1). By extension, by anticompetitive, we also mean that (holding all else constant), the metric will decrease by publishing more papers (x > 1). Otherwise put, an industry adhering closely to either of the bibliographic metrics of Eqs. (1) or (2) inclines itself against its own product growth, and towards journal proliferation, namely, towards the creation of new journals.
Differentiating Eq. (3) yields:
$\frac{\partial \mathrm{IF}\left(n_{3}\right)}{\partial x}=y \frac{(2+x)-(y+1+x)}{(2+x)^{2}} \overline{\mathrm{I}}=\frac{y(1-y)}{(2+x)^{2}} \overline{\mathrm{I}}$
from which we learn that, so long as the journal citations are growing (y > 1), this derivative will be negative, and thus, IF(n3) satisfies the anticompetitive condition, Eq. (1). In other words, the impact factor of a journal in bibliometric decline (y < 1), can be compensated for by publishing fewer papers (holding all else constant); see also the closing example and FIG. 5. of (Phan-Thien & Giacomin, 2024).
We begin with the main result of our previous work, for the normalized impact factor (Eq. (9) of (Phan-Thien & Giacomin, 2024)):
$\overline{\mathrm{IF}}\left(n_{3}\right)=\frac{\operatorname{IF}\left(n_{3}\right)}{\mathrm{IF}_{0}\left(n_{3}\right)}=\frac{2(y+1+x)}{(y+1)(2+x)}$
wherein IF0 is called the zero-growth impact factor:
$\mathrm{IF}_{0}\left(n_{3}\right) \equiv \lim _{x \rightarrow 0} \operatorname{IF}\left(n_{3}\right)=\frac{y(y+1)}{2} \overline{\mathrm{II}}$
and wherein, from growth-adjustment theory (Eq. (8) of (Phan-Thien & Giacomin, 2024)):
$y=\frac{1}{2}\left[\sqrt{(x+1)^{2}+4 \frac{\mathrm{IF}}{\overline{\mathrm{II}}}(2+x)}-(x+1)\right]$
from which we learn that y depends on two, and only two, things: x and the ratio. For the special case of no journal growth, x = 1, Eq. (5) yields:
$\overline{\operatorname{IF}}\left(n_{3}\right)=\frac{\operatorname{IF}\left(n_{3}\right)}{\operatorname{IF}_{0}\left(n_{3}\right)}=\frac{2(y+2)}{3(y+1)}$
which, for the special case of no citation growth, y = 1, gives unity for the dimensionless impact factor,$ \overline{\mathrm{IF}}\left(n_{3}\right)$, as it must.
From Eq. (5), we get the ratio of partial derivatives:
$\frac{\partial \operatorname{IF}\left(n_{3}\right) / \partial x}{\partial \operatorname{IF}\left(n_{3}\right) / \partial y}=\frac{y^{2}-1}{x(2+x)}$
from which we learn that when a journal has no citation growth, this ratio is zero.
Otherwise put, the sensitivity of the impact factor IF to y, for a journal without citation growth, is much higher than to the journal growth itself, x. By contrast, when y = 2, for a journal that is not growing, x = 1, these sensitivities equate. Finally, when y = 3, for a journal that is not growing, x = 1, Eq. (9) yields the ratio 8⁄3.
In the limit, as x→∞, Eq. (5) gives the asymptote:
$\overline{\mathrm{IF}}_{x \rightarrow \infty}\left(n_{3}\right)=\frac{2}{1+y}$
and in the limit, as y→∞, Eq. (5) gives the asymptote:
$\overline{\mathrm{IF}}_{y \rightarrow \infty}\left(n_{3}\right)=\frac{2}{2+x}$
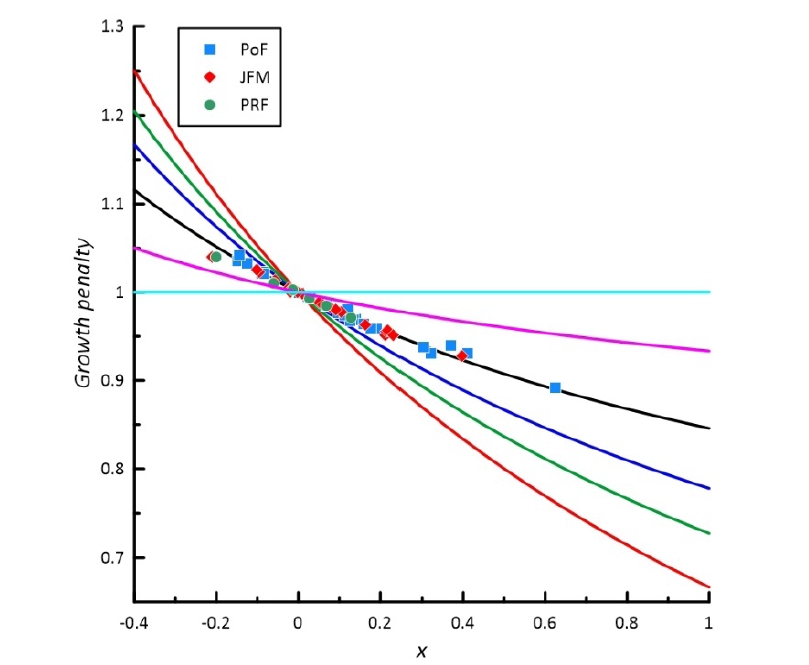
Figure 3 shows the y→∞ asymptotic behavior of Eq. (5), with the annual fractional citation growth curve rotating clockwise, about $\left[x, \overline{\operatorname{IF}}\left(n_{3}\right)\right]=[0,1]$. We find that all three members of our fluids journal cluster, over their 56 journal years, lie on or near the y ≅ 2.7243 isopleth.
With the exception of its added rightmost column and completions of Rows 1999 and 2000, Table 2 is TABLE I. of (Zatloukal et al., 2024a), in which the detailed calculations of each column are explained, with worked example. The entries in Table 3 and Table 4, were arrived at in the same way as Table 2. In Table 2 through Table 4, we use Eq. (7) for Column 7, and Eq. (6) for Column 8. In Table 2 through Table 4, numbers appearing in boldface consist of the numbers used in a self-consistent worked example, moving from left to right, to arrive at the lowest row of the two rightmost columns (compare with TABLE I. of (Zatloukal et al., 2024a)). Inspecting Columns 7 of Table 2 through Table 4, we discover that the values of y for all available years of all three fluids journals fall within 2.09 ≤ y ≤ 3.32 (Clarivate, 2024a, 2024b). Figure 1 illustrates this narrow scatter.
Table 2. Growth-adjusted impact factors of Physics of Fluids. |
| ni | p | IF | II | $\overline{\mathrm{II}}$ | x | y | $\overline{\mathrm{IF}}\left(n_{3}\right)$ | GIF | GIF⁄IF | Ur |
|---|---|---|---|---|---|---|---|---|---|---|
| 1997 | 369 | 1.630 | 0.298 | - | - | - | - | - | - | - |
| 1998 | 314 | 1.348 | 0.274 | - | -0.1491 | - | - | - | - | - |
| 1999 | 358 | 1.420 | 0.302 | 0.2913 | 0.1401 | 2.7098 | 0.9698 | 1.464 | 1.0310 | 10.051 |
| 2000 | 305 | 1.442 | 0.334 | 0.3033 | -0.1480 | 2.5718 | 1.0352 | 1.393 | 0.9660 | 9.186 |
| 2001 | 346 | 1.799 | 0.298 | 0.3113 | 0.1344 | 2.9904 | 0.9686 | 1.857 | 1.0322 | 11.931 |
| 2002 | 412 | 1.697 | 0.374 | 0.3353 | 0.1908 | 2.7873 | 0.9589 | 1.770 | 1.0430 | 10.558 |
| 2003 | 375 | 1.566 | 0.307 | 0.3263 | -0.0898 | 2.6067 | 1.0209 | 1.534 | 0.9796 | 9.402 |
| 2004 | 435 | 1.761 | 0.313 | 0.3313 | 0.1600 | 2.8577 | 0.9643 | 1.826 | 1.0369 | 11.023 |
| 2005 | 575 | 1.728 | 0.303 | 0.3077 | 0.3218 | 3.0100 | 0.9305 | 1.857 | 1.0747 | 12.07 |
| 2006 | 503 | 1.697 | 0.250 | 0.2887 | -0.1252 | 2.9110 | 1.0326 | 1.643 | 0.9682 | 11.382 |
| 2007 | 567 | 1.780 | 0.217 | 0.2567 | 0.1272 | 3.3182 | 0.9679 | 1.839 | 1.0331 | 14.328 |
| 2008 | 485 | 1.738 | 0.241 | 0.2360 | -0.1446 | 3.2934 | 1.0416 | 1.669 | 0.9603 | 14.144 |
| 2009 | 487 | 1.638 | 0.300 | 0.2527 | 0.0041 | 3.1370 | 0.9989 | 1.640 | 1.0012 | 12.98 |
| 2010 | 445 | 1.722 | 0.267 | 0.2693 | -0.0862 | 3.0710 | 1.0229 | 1.683 | 0.9774 | 12.499 |
| 2011 | 488 | 1.926 | 0.355 | 0.3073 | 0.0966 | 3.1179 | 0.9763 | 1.973 | 1.0244 | 12.841 |
| 2012 | 499 | 1.942 | 0.319 | 0.3137 | 0.0225 | 3.0639 | 0.9944 | 1.953 | 1.0057 | 12.451 |
| 2013 | 587 | 2.040 | 0.349 | 0.3410 | 0.1764 | 3.0678 | 0.9588 | 2.128 | 1.0431 | 12.481 |
| 2014 | 604 | 2.031 | 0.434 | 0.3673 | 0.0290 | 2.8743 | 0.9931 | 2.045 | 1.0069 | 11.135 |
| 2015 | 553 | 2.017 | 0.374 | 0.3857 | -0.0844 | 2.7402 | 1.0205 | 1.976 | 0.9797 | 10.246 |
| 2016 | 554 | 2.232 | 0.444 | 0.4173 | 0.0018 | 2.8094 | 0.9996 | 2.233 | 1.0004 | 10.702 |
| 2017 | 617 | 2.279 | 0.415 | 0.4110 | 0.1137 | 2.9117 | 0.9737 | 2.341 | 1.0272 | 11.392 |
| 2018 | 659 | 2.627 | 0.724 | 0.5277 | 0.0681 | 2.7187 | 0.9848 | 2.668 | 1.0156 | 10.112 |
| 2019 | 859 | 3.514 | 0.984 | 0.7077 | 0.3035 | 2.7925 | 0.9377 | 3.747 | 1.0663 | 10.589 |
| 2020 | 1212 | 3.521 | 1.116 | 0.9413 | 0.4109 | 2.3793 | 0.9304 | 3.784 | 1.0747 | 8.04 |
| 2021 | 1970 | 4.980 | 1.325 | 1.1417 | 0.6254 | 2.6676 | 0.8917 | 5.585 | 1.1215 | 9.784 |
| 2022 | 2203 | 4.6 | 1.1 | 1.18 | 0.12 | 2.37 | 0.98 | 4.7 | 1.02 | 8 |
| 2023 | 3008 | 4.1 | 1.6 | 1.34 | 0.37 | 2.09 | 0.94 | 4.4 | 1.07 | 6.6 |
Table 3. Growth-adjusted impact factors of Journal of Fluid Mechanics. |
| ni | p | IF | II | $\overline{\mathrm{II}}$ | x | y | \overline{\mathrm{IF}}\left(n_{3}\right) | GIF | GIF⁄IF | Ur |
|---|---|---|---|---|---|---|---|---|---|---|
| 1997 | 370 | 1.609 | 0.370 | - | - | - | - | - | - | - |
| 1998 | 334 | 1.672 | 0.338 | - | -0.0973 | - | - | - | - | - |
| 1999 | 340 | 1.686 | 0.226 | 0.3113 | 0.0180 | 2.8359 | 0.9957 | 1.693 | 1.0042 | 10.877 |
| 2000 | 321 | 1.601 | 0.374 | 0.3127 | -0.0559 | 2.7180 | 1.0133 | 1.580 | 0.9869 | 10.106 |
| 2001 | 389 | 1.912 | 0.357 | 0.3190 | 0.2118 | 3.0852 | 0.9511 | 2.010 | 1.0513 | 12.602 |
| 2002 | 398 | 1.882 | 0.369 | 0.3667 | 0.0231 | 2.7511 | 0.9947 | 1.892 | 1.0053 | 10.319 |
| 2003 | 360 | 1.811 | 0.339 | 0.3550 | -0.0955 | 2.6974 | 1.0230 | 1.770 | 0.9774 | 9.972 |
| 2004 | 378 | 1.853 | 0.384 | 0.3640 | 0.0500 | 2.7478 | 0.9886 | 1.874 | 1.0113 | 10.297 |
| 2005 | 401 | 2.061 | 0.446 | 0.3897 | 0.0608 | 2.8133 | 0.9860 | 2.090 | 1.0141 | 10.726 |
| 2006 | 487 | 2.022 | 0.472 | 0.4340 | 0.2145 | 2.6617 | 0.9560 | 2.115 | 1.0460 | 9.747 |
| 2007 | 501 | 2.026 | 0.413 | 0.4437 | 0.0287 | 2.5724 | 0.9938 | 2.039 | 1.0064 | 9.191 |
| 2008 | 450 | 2.315 | 0.422 | 0.4357 | -0.1018 | 2.7583 | 1.0251 | 2.258 | 0.9754 | 10.365 |
| 2009 | 450 | 2.283 | 0.433 | 0.4227 | 0 | 2.8245 | 1 | 2.283 | 1 | 10.802 |
| 2010 | 524 | 2.457 | 0.534 | 0.4630 | 0.1644 | 2.8565 | 0.9634 | 2.550 | 1.0379 | 11.015 |
| 2011 | 565 | 2.459 | 0.550 | 0.5057 | 0.0782 | 2.6852 | 0.9828 | 2.502 | 1.0175 | 9.895 |
| 2012 | 557 | 2.183 | 0.445 | 0.5097 | -0.0142 | 2.4648 | 1.0030 | 2.176 | 0.9968 | 8.538 |
| 2013 | 679 | 2.294 | 0.594 | 0.5297 | 0.2190 | 2.5498 | 0.9569 | 2.397 | 1.0449 | 9.05 |
| 2014 | 663 | 2.383 | 0.670 | 0.5697 | -0.0236 | 2.4282 | 1.0050 | 2.371 | 0.9950 | 8.324 |
| 2015 | 669 | 2.514 | 0.526 | 0.5967 | 0.0090 | 2.4483 | 0.9981 | 2.519 | 1.0020 | 8.443 |
| 2016 | 739 | 2.821 | 0.591 | 0.5957 | 0.1046 | 2.6526 | 0.9775 | 2.886 | 1.0230 | 9.689 |
| 2017 | 806 | 2.893 | 0.627 | 0.5813 | 0.0907 | 2.7261 | 0.9799 | 2.952 | 1.0204 | 10.157 |
| 2018 | 993 | 3.137 | 0.708 | 0.6420 | 0.2320 | 2.7434 | 0.9516 | 3.297 | 1.0510 | 10.271 |
| 2019 | 975 | 3.333 | 0.833 | 0.7227 | -0.0181 | 2.5719 | 1.0040 | 3.320 | 0.9961 | 9.188 |
| 2020 | 973 | 3.627 | 1.095 | 0.8787 | -0.0021 | 2.4158 | 1.0004 | 3.626 | 0.9997 | 8.253 |
| 2021 | 1360 | 4.245 | 1.151 | 1.0263 | 0.3977 | 2.5270 | 0.9282 | 4.573 | 1.0773 | 8.912 |
| 2022 | 1078 | 3.7 | 0.9 | 1.05 | -0.21 | 2.15 | 1.04 | 3.6 | 0.97 | 6.9 |
| 2023 | 1056 | 3.6 | 0.9 | 0.98 | -0.02 | 2.25 | 1 | 3.6 | 1 | 7.3 |
Table 4. Growth-adjusted impact factors of Physical Review Fluids. |
| ni | p | IF | II | $\overline{\mathrm{II}}$ | x | y | $\overline{\mathrm{IF}}\left(n_{3}\right)$ | GIF | GIF⁄IF | Ur |
|---|---|---|---|---|---|---|---|---|---|---|
| 2016 | 234 | N/A | 0.188 | - | - | - | - | - | - | - |
| 2017 | 471 | 2.021 | 0.452 | - | 1.0128 | - | - | - | - | - |
| 2018 | 484 | 2.442 | 0.576 | 0.4053 | 0.0276 | 3.0190 | 0.9932 | 2.459 | 1.0070 | 12.13 |
| 2019 | 546 | 2.512 | 0.443 | 0.4903 | 0.1281 | 2.7858 | 0.9716 | 2.585 | 1.0291 | 10.55 |
| 2020 | 583 | 2.537 | 0.590 | 0.5363 | 0.0678 | 2.6389 | 0.9852 | 2.575 | 1.0150 | 9.603 |
| 2021 | 575 | 2.895 | 0.706 | 0.5797 | -0.0137 | 2.6947 | 1.0032 | 2.886 | 0.9969 | 9.957 |
| 2022 | 538 | 2.7 | 0.6 | 0.63 | -0.06 | 2.45 | 1.01 | 2.7 | 1 | 8.6 |
| 2023 | 431 | 2.5 | 0.8 | 0.7 | -0.2 | 2.17 | 1.04 | 2.4 | 0.96 | 6.9 |
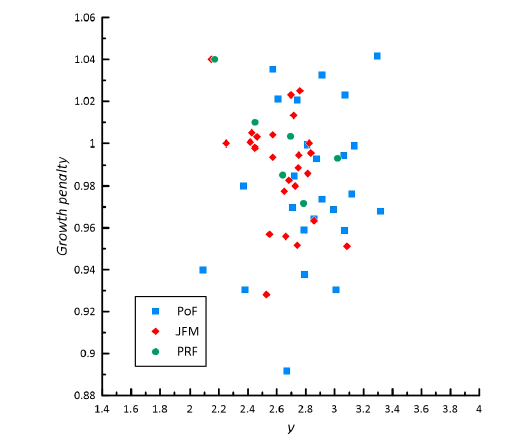
Figure 1. Scatter-plot of growth penalty versus y over the period 1999-2023. |
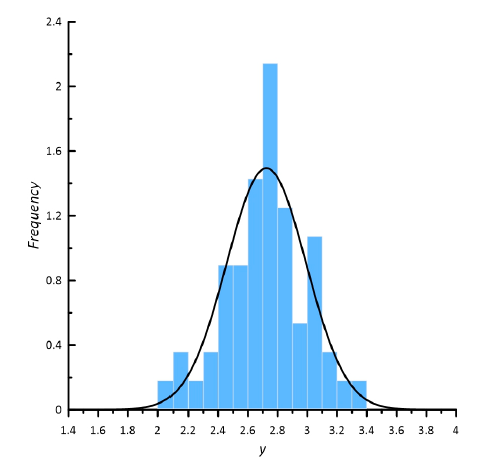
We next use these data of Figure 1 to test growth-adjustment theory, arriving at the fitted value to Eq. (5) of y ≅ 2.7243. The histogramatic analysis of Figure 2 deepens our understanding of the narrow scatter discovered in y. We find the normalized distribution of y to be Gaussian:
$f(y)=\frac{1}{\sigma_{\mathrm{y}} \sqrt{2 \pi}} \exp \left[-\frac{\left(y-\mu_{\mathrm{y}}\right)^{2}}{2 \sigma_{\mathrm{y}}{ }^{2}}\right]$
where μ ≅ 2.7243 is the mean value of y, and σ ≅ 0.267, the standard deviation, and whose integrated area is one. We normalize the corresponding histogram by dividing by N∆y where ∆y = 0.1 is the bin-width and N is the number of journal years (N = 56). Otherwise put, within this narrow standard deviation, the annual fractional citation growth for all 56 years of this three fluids journal cluster is y ≅ 2.724 ± 2σ (in which we chose 2σ to embrace the 95% confidence interval. This is the main result of this work. We find the narrow Gaussian distribution of Figure 2 to be intrinsically beautiful.
The narrow scatter of Figure 2 motivates the plot of Figure 3 showing the one curve on which, within the scatter, all 56 journal years lie. Our theory of Eq. (5) thus finds good agreement with the measured values of annual fractional citation growth. This suggests that, at least for fluids journals, the theory on which the method of impact factor growth-adjustment is based, is correct.
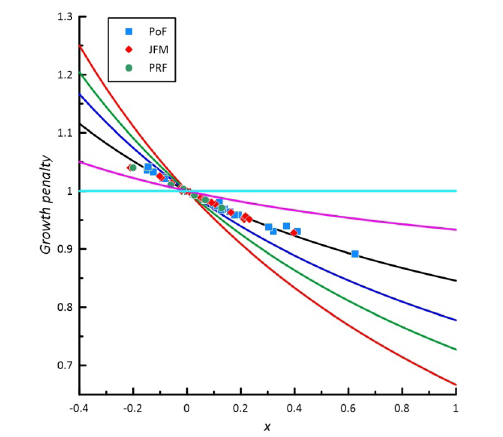
Figure 3. Growth penalty versus x from Eq. (5) over the period 1999-2023: μy ≅ 2.724 (black), y = 1 (cyan) and y = 1.5 (magenta). y = 5 (blue), y = 10, (green), y = ∞ (red). |
We further find that the three fluids journal cluster data and fitted curve of Figure 3, lie near the y→∞ asymptote, and far from the y→0 asymptote. In other words, good agreement between the three fluids journals is explained by their y→∞ asymptotic confinement. We will return to this subject.
We can deepen our understanding of annual fractional citation growth by considering the growth-adjusted impact factor (TABLE II. of (Zatloukal et al., 2024a)):
$\operatorname{GIF}\left(n_{3}\right) \equiv \frac{\operatorname{IF}\left(n_{3}\right)}{\operatorname{IF}\left(n_{3}\right)}$
into which we substitute Eqs. (5) and (3) to get:
$\operatorname{GIF}\left(n_{3}\right)=\frac{y(y+1+x)}{2+x} \overline{\mathrm{II}} \frac{(y+1)(2+x)}{2(y+1+x)}=\frac{\overline{\mathrm{I}}}{2} y(y+1)$
from which we uncover the new and dimensionless variable:
$\mathrm{Ur} \equiv 2 \frac{\operatorname{GIF}\left(n_{3}\right)}{\overline{\mathrm{II}}}$
which we use to get the rightmost columns of Table 2 through Table 4. Serving as our own lexicographers, we call this new bibliographic metric journal urgency, because it compares the longer term journal impact (numerator) with the journal immediacy (denominator). Regarding Eq. (13), our theory is silent on whether y causes Ur, or whether Ur causes y. Eq. (15) is a main result of this work.
The annual fractional citation growth is thus the positive root of the quadratic:
y2 + y - Ur = 0
or
$y=\frac{1}{2}(\sqrt{4 \mathrm{Ur}+1}-1)$
from which we learn that, unlike anticompetitive bibliographic metrics, such as IF or CS, y does not depend on x at all. Otherwise put, ∂y⁄∂x = 0.
Substituting Eq. (17) into Eq. (12) yields:
$g(\mathrm{Ur})=\frac{1}{\sigma \sqrt{2 \pi}} \exp \left[-\frac{\left(\frac{1}{2}(\sqrt{4 \mathrm{Ur}+1}-1)-\mu\right)^{2}}{2 \sigma^{2}}\right]$
whose form differs from Eq. (12), and thus which is Gaussian in, but not Gaussian in Ur. However, Figure 4 and the histogramatic analysis of Figure 5 deepen our understanding of Ur and the narrow scatter in Ur. We find the normalized distribution of Ur to be nearly Gaussian:
$g(\mathrm{Ur}) \cong \frac{1}{\sigma_{\mathrm{Ur}} \sqrt{2 \pi}} \exp \left[-\frac{\left(\mathrm{Ur}-\mu_{\mathrm{Ur}}\right)^{2}}{2 \sigma_{\mathrm{Ur}}{ }^{2}}\right]$
where μUr ≅ 10.23 is the mean value of Ur, and σUr ≅ 1.70, the standard deviation. Figure 5 illustrates this.
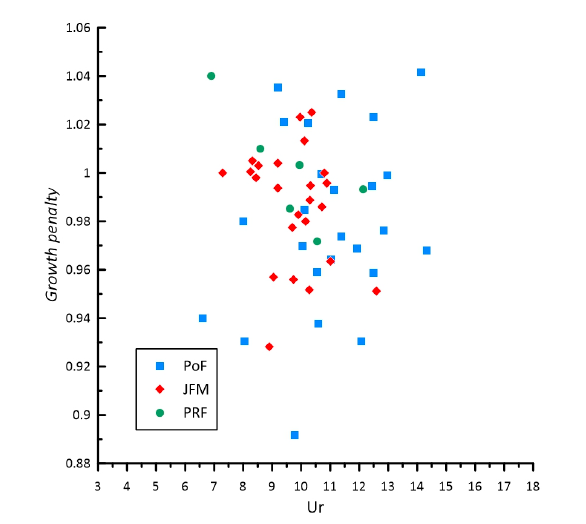
Figure 4. Scatter-plot of growth penalty versus Ur over the period 1999-2023. |
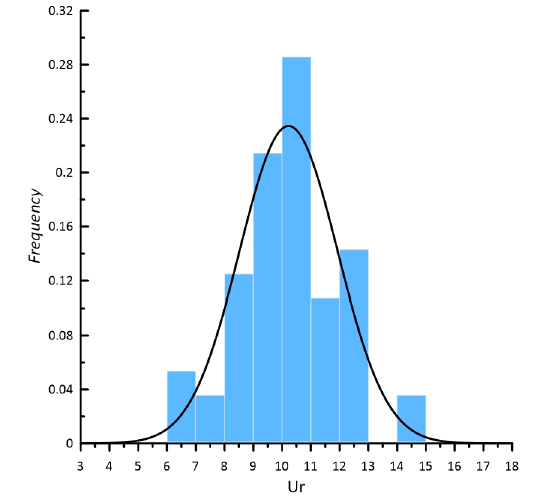
Figure 5. Distribution of ratio of twice the growth-adjusted impact factor to three-year running average immediacy index, Ur, for the fluids journal tri-cluster over the period 1999-2023 which is nearly Gaussian. Curve from Eq. (19) with μUr ≅ 10.23 and σUr ≅ 1.70. Eq. (18) overwrites Eq. (19) within a line width. Histogram bin-width, ∆Ur = 1. |
From Eq. (17) we learn that (i) annual fractional citation growth depends on just one new dimensionless quantity, Ur, (ii) for small Ur, y ≈ Ur, and (iii) for large Ur,. y ≈$\sqrt{\mathrm{Ur}}-\frac{1}{2}$By small Ur, we mean Ur ≪ 1, and by large Ur, we mean Ur ≫ 1. For y ≈ Ur, the distributions of the annual fractional citation growth and Ur match, that is, f(y) = g(Ur). For our three fluids journal cluster, Ur ≫ 1 obtains and thus, Ur ≅ 10 is large. We further explore Eq. (17) along with its asymptotes in Figure 6, from which we learn that (a) the mean value μUr ≅ 10.23, for our set of 56 fluids journal years, and (b) that near this mean value, y(Ur) is nearly linear. Otherwise put, for the three fluids journals at issue, the distribution of Ur values is nearly Gaussian, and in this nearly linear region of Figure 6, Eq. (18) recovers Eq. (12) as it should.

Figure 6. Annual fractional citation growth versus Ur from Eq. (17) with small and large Ur asymptotes y ≈ Ur (leftmost) and $ y \approx \sqrt{\mathrm{Ur}}-\frac{1}{2}$ (rightmost). Operating point to the three fluids journal cluster for 56 journal years is near the large asymptote Ur, in the nearly linear region. |
Figure 7 shows that Ur is distributed more broadly than y, and Figure 8 shows why. Figure 8 also shows how Eq. (18) recovers Eq. (12). To deepen our understanding of the new bibliographic metric Ur, we re-examine the growth-adjustment theory for the CiteScore.
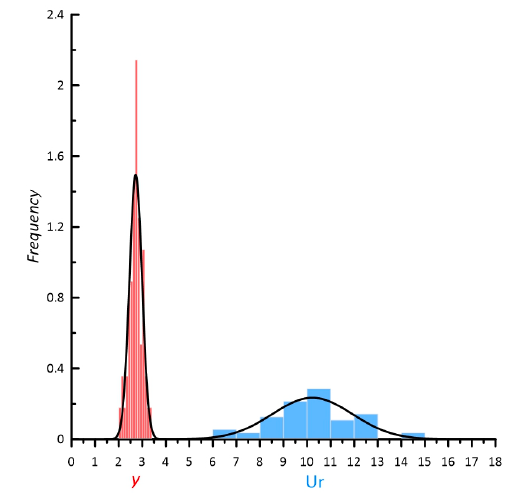
Figure 7. Comparison of annual fractional citation growth distribution from Eq. (12) versus Ur distribution from Eq. (17). Unit areas under each distribution. Histogram bin-widths, ∆y = 0.1 (left) and ∆Ur = 1 (right). |
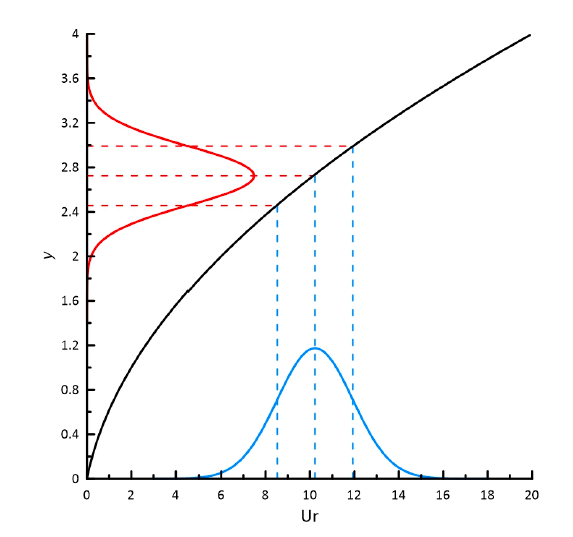
Figure 8. Annual fractional citation growth distribution of Figure 2 [from Eq. (12)] projected geometrically (horizontal dashed lines) onto the curve of Eq. (17) projected orthogonally in turn (vertical dashed lines) onto the Ur distribution of Figure 5 [from Eq. (18)]. Since y is both Gaussian and nearly linear with Ur near the operating point, the projected Ur distribution is nearly Gaussian. |
Suppose the immediacy index values II1 through II4 do not vary a great deal so that they are each about equal to their three-year running average (n2 through n4):
$ \mathrm{II}_{i} \cong \overline{\mathrm{II}}$
which we call the running average approximation and which we test in Figure 9, for the three fluids journal cluster under study (see also (Adams, 2005)). We find the approximation to be accurate. We can thus replace each of the IIi in Eq. (5) of (Phan-Thien et al., 2024) by their three-year mean,$ \mathrm{II}$, and then factor, to obtain for the CiteScore:
$ \operatorname{CS}\left(n_{4}\right)=\bar{\Pi} \bar{I} \frac{\left(1+y+y^{2}+y^{3}\right)+(1+x)\left(1+y+y^{2}\right)+(1+x)^{2}(1+y)+(1+x)^{3}}{4+6 x+4 x^{2}+x^{3}}$
and then for the CiteScore growth penalty:
$\overline{\mathrm{CS}}=\frac{4\left[\left(1+y+y^{2}+y^{3}\right)+(1+x)\left(1+y+y^{2}\right)+(1+x)^{2}(1+y)+(1+x)^{3}\right]}{\left(4+6 x+4 x^{2}+x^{3}\right)\left[\left(1+y+y^{2}+y^{3}\right)+\left(1+y+y^{2}\right)+(1+y)+1\right]}$
The growth-adjusted CiteScore is then:
$\mathrm{GSC}=\frac{\mathrm{CS}\left(n_{4}\right)}{\overline{\mathrm{CS}}}=\frac{\overline{\mathrm{II}}}{4}\left(4+3 y+2 y^{2}+y^{3}\right)$
which uncovers the new dimensionless bibliographic metric:
$\mathrm{Ug} \equiv 4 \frac{\operatorname{GIF}\left(n_{4}\right)}{\overline{\mathrm{II}}}$
which we call CiteScore urgency and which (i) depends only on y, and (ii) is the positive root of the cubic:
y3+2y2+3y+4=Ug
which has two complex conjugate roots and one real positive (the latter being the solution sought):
$y=A-\frac{5}{9 A}-\frac{2}{3}$
where:
$A \equiv\left(\frac{1}{2} \mathrm{Ug}+\sqrt{\frac{1}{4} \mathrm{Ug}^{2}-\frac{35}{27} \mathrm{Ug}+\frac{50}{27}}\right)^{\frac{1}{3}}$
Substituting Eq. (17) into Eq. (25) relates one of our new journal urgency metrics to the other:
$\mathrm{Ug}=3+\frac{\mathrm{Ur}}{2}+\frac{1}{2}(2+\mathrm{Ur}) \sqrt{4 \mathrm{Ur}+1}$
which, for large Ur, such as for the three fluids journal cluster at issue in this paper:
$\mathrm{Ug} \cong \mathrm{Ur} \sqrt{\mathrm{Ur}}+\frac{\mathrm{Ur}}{2}+\frac{17}{8} \sqrt{\mathrm{Ur}}+3+\cdots ; \mathrm{Ur} \gg 1$
From Eq. (28) we glean the one to one correspondence between the two new dimensionless metrics Ur and Ug. Figure 10 illustrates Eq. (28) [along with its large Ur asymptote, Eq. (29)]. Near the operating point, Eq. (28) and its large Ur asymptote agree to within a pen-width.
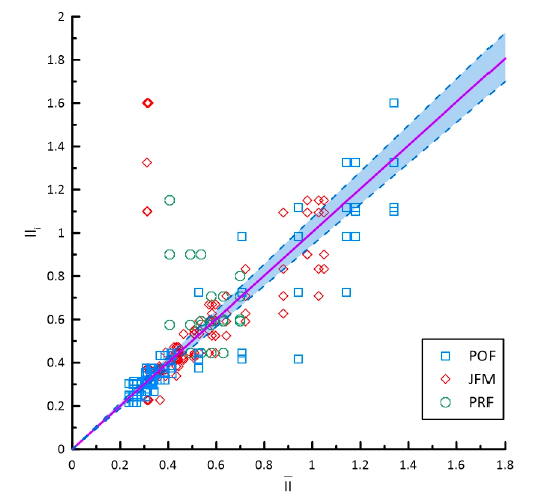
Figure 9. Test of the running average approximation of Eq. (20), showing confidence interval on the regression proportionality:. Regression employed 212 ordered pairs of the 56 journal years of the three fluids journal cluster. |
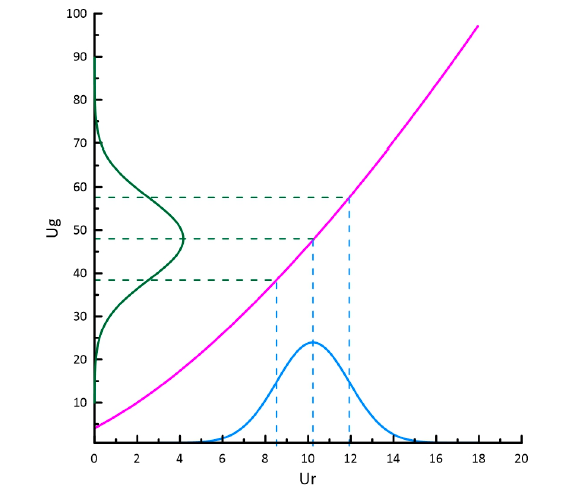
Figure 10. Illustration of one urgency metric Ug as a function of the other, Ur, from Eq. (28). The large Ur asymptote of Eq. (29) is also illustrated, along with the operating point (10.23,48.00) of the three fluids journal cluster. Eqs. (28) and (29) agree within a pen-width. Graphical projection method of Figure 8 used to project the Ug distribution from the Ur distribution of Figure 5. |
We next examine the partial of CiteScore with respect to journal growth. Differentiating Eq. (21):
$\frac{\partial \operatorname{CS}\left(n_{3}\right)}{\partial x}=-y \frac{[x(3 x+8)+6] y^{2}+2(x+2)^{2}(x+1) y+[x(x+4)+6](x+1)^{2}}{\left(4+6 x+4 x^{2}+x^{3}\right)^{2}} \overline{\mathrm{II}}$
from which we learn that, for all values of journal citation growth (y ≥ 0), this derivative will be negative, and thus, CS(n3) always satisfies the anticompetitive condition, Eq. (1). In other words, the CiteScore of a journal can always be improved by publishing fewer papers (holding all else constant); see also the closing example and FIG. 4. of Phan-Thien et al. (2024). Unlike impact factor, the CiteScore is always anticompetitive.
We next explore how Ug is distributed, and compare this with how Ur is distributed (see Figure 5, Figure 7 and Figure 8). Figure 10 shows that the function Ug(Ur) is nearly linear near the three fluids journal cluster operating point. So we can apply the projection method of Figure 8 to Figure 10 to arrive at the Gaussian distribution of Ug values for the three fluids journal cluster explored herein. The histogramatic analysis of Figure 11 compares the measured Ug distribution over 56 journal years with the curve obtained graphically in Figure 10, showing good agreement, as it should.

Figure 11. Distribution of ratio of four times the growth-adjusted CiteScore to three-year running average immediacy index, Ug, for the fluids journal tri-cluster over the period 1999-2023 which is nearly Gaussian. Curve obtained graphically in Figure 10 obeys Eq. (19) with μUg ≅ 48.00 and σUg ≅ 9.59. Histogram bin-width, ∆Ug = 4. |
In this paper, we explore the physics of citation growth. We do so for the cluster of competing fluids journals, as examples: Physics of Fluids, Journal of Fluid Mechanics and Physical Review Fluids, over the years for which the data are available, 1999-2023. We discover that, with little scatter, all three fluids journals follow the same function of fractional annual journal publication growth [Eqs. (5) and (6)], with the same annual fractional citation growth (vide Figure 3). We find the growth-adjustment theory advanced in (Phan-Thien & Giacomin, 2024) to be in good agreement with the experimental data of the three fluids journal cluster against which the theory is tested.
We quantify the narrow and nearly Gaussian distribution of these fractional annual journal publication growth values for a set of 56 fluids journal years. We learn that the annual fractional citation growth does not change much from one journal or year to the next, and the value y ≅ 2.724 ± 2σ obtains (vide Figure 2). We explain these findings with the growth-adjustment theory advanced in prior contributions (Phan-Thien & Giacomin, 2024; Phan-Thien et al., 2024). To deepen our understanding of this finding, we recast growth-adjustment theory, and uncover a new dimensionless bibliographic metric called journal urgency: the ratio of annual fractional citation growth to the 4-year running average immediacy index [Eq. (15)]. To further deepen our understanding, we recast our growth adjustment theory for CiteScore, only to find yet another new dimensionless bibliographic metric, which we call CiteScore urgency. We relate journal urgency, Ur, to CiteScore urgency, Ug, only to find that Ur and Ug depend on each other and nothing else [Eq. (28)]. We find that the new urgency metrics (journal urgency and CiteScore urgency) do not depend upon journal growth, x, and thus require no growth adjustment [Eq. (17)].
We find that whereas impact factor is only anticompetitive when y > 1, CiteScore is anticompetitive for all fractional citation growth y. Thus, for a journal with y > 1, the pursuit of increased impact factor inclines the journal against its own growth. However, for y < 1, growth inclines the journal against its own impact. By contrast, the pursuit of increasing CiteScore inclines the journal against its own growth for all y. When inclined against the growth of individual journals, a growing publication industry is also inclining itself towards journal proliferation. This is the problem with the pursuit of increased anticompetitive bibliographic metrics.
Figure 12 plots citation growth versus journal growth. We call this the growth map. Figure 12 maps the anticompetitive landscape for our three fluids journal cluster. The region y > 1 (crosshatched horizontally in blue) illustrates where the impact factor is anticompetitive, a subarea of the region y > 0 (crosshatched vertically in orange) where the CiteScore is anticompetitive. Figure 12 shows that, as a practical matter, all 56 journal years of the three fluids journal cluster are well within y > 1. Hence, the three fluids journal cluster operates in the anticompetitive zones of both bibliographic metrics.
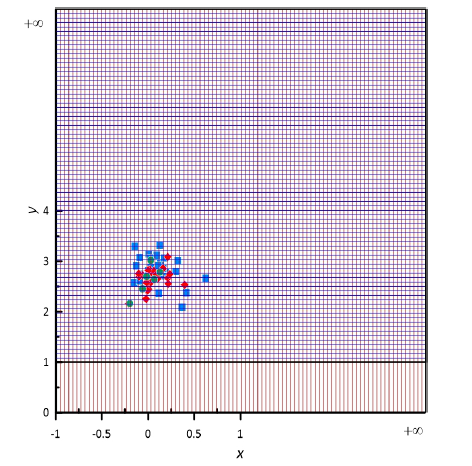
Figure 12. Region y > 0 (crosshatched in orange) is where the CiteScore is anticompetitive too. Subregion y > 1 (crosshatched in blue) is where impact factor is anticompetitive. All 56 journal years of the three fluids journal cluster are well within both anticompetitive zones: POF, JFM and PRF. |
We find the fractional annual citation growth, y, journal urgency, Ur, and CiteScore urgency, Ug, to be narrowly distributed, respectively ±10% (Figure 2), ±17% (Figure 5), and ±20% (Figure 11) for the three fluids journal cluster over the journal years for which data are available (56 fluids journal years). We find all three quantities to be following Gaussian distributions.
We further found that the immediacy index chosen from any of 4 consecutive years is roughly equal to its 3-year running average for the last 3 of those 4 consecutive years (Figure 9). We call this the running average approximation, and it allows for an important simplification in bibliographic metric analysis [of Eq. (5) of (Phan-Thien et al., 2024) to get Eq. (21)], at least for the 56 fluids journal year cluster considered here.
Our work here has been limited to a three fluids journal cluster. To these three, it would be intriguing to add other large cognate fluids journals such as Soft Matter, Physical Review E, the Journal of Molecular Liquids, AIAA Journal, Physics of Plasmas, Langmuir, and the Journal of Colloid and Interface Science. It would also be interesting to compare with large and more general science titles such as The Journal of Chemical Physics, the Journal of Applied Physics, Applied Physics Letters, the Proceedings of the National Academy of Sciences and Physical Review Letters. We leave these important but laborious explorations for another day.
Our work here is silent on the influence of topic size on, the mathematics of which has been carefully explored (Li et al., 2024; Sjögårde & Didegah, 2022). Our work here focussed on citation growth of the journal, and not of the individual researcher, the mathematics of which has also been carefully explored (Karami & Fazli, 2016).
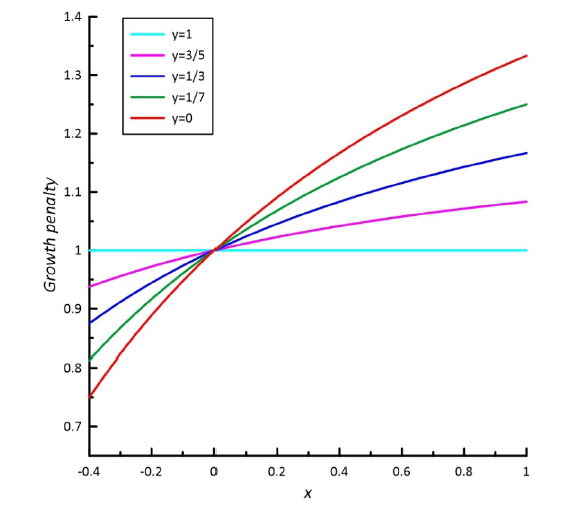
Figure 3 informs about y ≥ 1 but in closing, we focus on 0 ≤ y ≤ 1. Differentiating Eq. (5), we get:
$\frac{\overline{\partial \mathrm{IF}}\left(n_{3}\right)}{\partial x}=\frac{-2(y-1)}{(y+1)(x+2)^{2}}$
from which we glean Figure 13, which teaches in turn, that this derivative is positive for 0 ≤ y < 1. What this says is that, if your journal is weak enough (0 ≤ y < 1), then its impact factor will suffer no penalty for its own growth. The slope change at y = 1, from negative (Figure 3) to positive (Figure 13) is traceable to the xy interactions arising in Eq. (5). On the contrary, growth helps. However, for the fluids journal cluster, over their 56 journal years, examined here, y has never fallen below 1. Though as far as we know 0 ≤ y < 1 is not unphysical (y < 0 is unphysical), we know of no fluids journal so weak as to satisfy 0 ≤ y < 1. Comparing Figure 3 with Figure 13, we learn that the anticompetitive property of the impact factor only inclines against strong journals. Otherwise put, an industry adhering closely to either of the bibliographic metrics of Eq. (32) inclines itself (i) against its own product growth, and not only (ii) towards the journal proliferation, but towards the proliferation of weak journals (those satisfying 0 ≤ y ≤ 1). Our work has thus uncovered a new third anticompetitive property of the impact factor, traceable to xy interactions, namely, interactions between journal growth and citation growth.
Figure 13. Growth penalty versus x from Eq. (5) over the period 1999-2023, y = 1 (cyan) and y = 0.60 (magenta). y = 0.33 (blue), y = 0.14 (green), y = 0 (red). |
Would the weakest of fluids journal actually follow the ascending curves of Figure 13? Are there any fluids journals so weak as to operate or to have operated in the range 0 ≤ y ≤ 1? We leave further exploration of these important curiosities for another day.
This work focused entirely on the role of annual calendar-year publication growth, x. Since the denominator of the impact factor is a two calendar-year interval, the reader might have expected analysis in terms of biennial calendar-year growth:
$X \equiv \frac{2 p_{3}}{p_{1}+p_{2}}$
where, p3 = xp2 and p2 = xp1 so that:
$X=\frac{2 x}{1+x}$
Since X(x), we would not expect the replacement definition of Eq. (32) to affect our conclusions.
Sometimes, one journal will spinoff (or twig) a narrower title. In 1994, for instance, Physics of Fluids twigged Physics of Plasmas. Anticompetitive property (iii) motivates this particular form of journal proliferation. So long as the twigging lowers y for either the trunk, or the twig, twigging lowers the growth penalties on the bibliographic metrics, new and old. Anticompetitive property (iii) also explains why twigging is nearly irreversible. Only rarely does the trunk subsume the twig. We know of no fluids journal trunks subsuming their twigs. By contrast, general science titles do sometimes subsume failing original fluids journal titles, as was so for the Journal of Rheology, by the Journal of Applied Physics, in 1933 (see APPENDIX of (Beris & Giacomin, 2014)).
The reader may think our work on bibliographic metrics does not apply to journal publishing predating the formal definition of bibliographic metrics. However, just because impact factor did not yet exist, does not mean authors did not yet care about its numerator, or its denominator, or by extension, implicitly about their ratio. At this juncture, we know of no way to test bibliometric theory with data earlier than those available from the WOS database. We call these data jurassic. We leave the calculation of bibliographic metrics from jurassic journal data for another day.
Sometimes, one journal will alphabetize into narrower lettered titles. In 1989, for instance, Physics of Fluids alphabetized into Physics of Fluids A and Physics of Fluids B. Anticompetitive property (iii) motivates this form of journal proliferation too. So long as the alphabetizing lowers y for any of the letters, alphabetizing lowers the growth penalties on the bibliographic metrics, new versus old.
Our work is also silent on whether or not the author pays to publish; this is because payment does not enter into the mathematical physics of citation growth (Craig et al., 2007). Otherwise put, the anticompetitive properties of impact factor or of CiteScore are independent of how the significant costs of scientific publishing are borne.
Author contributions
A.J. Giacomin (giacomin@aip.org): Conceptualization (Equal), Method (Equal), Visualization (Equal), Writing - original draft (Equal);
M. Zatloukal (mzatloukal@utb.cz): Method (Equal), Visualization (Equal), Writing - original draft (Equal), Writing - review & editing (Equal);
M.A. Kanso (kansom@mit.edu): Resources (Equal), Validation (Equal), Writing - original draft, Writing - review & editing (Equal);
N. Phan-Thien (nhan@nus.edu.sg): Method (Equal), Validation (Equal), Visualization (Equal), Writing - review & editing (Equal).