

1 Introduction
2 Salami publications: a literature review
3 The Italian scientific accreditation (ASN)
4 Methods
4.1 Research hypotheses
4.2 Dataset
Table 1. Dataset of analysis. |
| 2008-2012 | 2013-2017 | |||||
|---|---|---|---|---|---|---|
| UDA* | No. of SDSs | Professorsǂ | Authorship | Publications | Authorship | Publications |
| 1 | 10 | 2,306 (38-33-30) | 21,017 | 15,652 | 25,472 | 19,525 |
| 2 | 8 | 1,598 (38-39-23) | 67,986 | 22,019 | 102,995 | 24,936 |
| 3 | 12 | 2,222 (45-34-21) | 42,376 | 23,631 | 49,859 | 28,319 |
| 4 | 12 | 780 (43-36-21) | 7,760 | 5,378 | 11,488 | 7,803 |
| 5 | 19 | 3,549 (47-30-23) | 47,560 | 30,231 | 57,221 | 37,088 |
| 6 | 50 | 6,973 (47-31-21) | 124,216 | 67,840 | 167,062 | 90,835 |
| 7 | 30 | 2,353 (42-33-25) | 24,239 | 13,661 | 34,405 | 19,719 |
| 8 | 9 | 1,098 (35-36-29) | 9,467 | 6,831 | 16,989 | 12,301 |
| 9 | 42 | 3,903 (35-35-30) | 64,453 | 43,065 | 95,848 | 65,508 |
| 10 | 8 | 799 (41-32-27) | 6,236 | 4,635 | 10,690 | 7,984 |
| Total | 200 | 25,581 (42-33-25) | 415,310 | 211,103** | 572,029 | 281,484** |
* 1 - Mathematics and computer science, 2 - Physics, 3 - Chemistry, 4 - Earth sciences, 5 - Biology, 6 - Medicine, 7 - Agricultural and veterinary sciences, 8 - Civil engineering, 9 - Industrial and information engineering, 10 - Psychology. ǂ Counts refer to academic ranks and SDSs as of 31/12/2012. In brackets, the share of assistant, associate and full professors, respectively. ** The value is lower than the column total due to publications authored by professors from different UDAs. |
4.3 The econometric model
Table 2. Descriptive statistics for variables of the econometric model. |
| Time | Variable | Obs | Min | Max | Mean | Median | Std Dev. |
|---|---|---|---|---|---|---|---|
| Varying | Number of publications | 51,162 | 0 | 619 | 19.3 | 12 | 31.4 |
| Originality of bibliographies | 49,586 | 0 | 1 | 0.730 | 0.749 | 0.199 | |
| Specialization index | 49,695 | 0.111 | 1 | 0.616 | 0.6 | 0.224 | |
| Age | 51,162 | 29 | 72 | 51.3 | 52 | 8.1 | |
| Rank | |||||||
| Assistant professor | 51,162 | 0 | 1 | 0.366 | |||
| Associate professor | 51,162 | 0 | 1 | 0.371 | |||
| Full professor | 51,162 | 0 | 1 | 0.263 | |||
| Average number of co-authors | 49,695 | 1 | 3,007 | 23.1 | 6.4 | 170.1 | |
| Share of international publications | 49,695 | 0 | 1 | 0.289 | 0.231 | 0.270 | |
| University location | |||||||
| North | 51,162 | 0 | 1 | 0.435 | |||
| Center | 51,162 | 0 | 1 | 0.276 | |||
| South | 51,162 | 0 | 1 | 0.289 | |||
| Constant | Female | 25,581 | 0 | 1 | 0.330 | - | - |
| ASN status | |||||||
| Full professor | 25,581 | 0 | 1 | 0.239 | - | - | |
| Accredited associate professor | 25,581 | 0 | 1 | 0.107 | - | - | |
| Accredited assistant professor | 25,581 | 0 | 1 | 0.159 | - | - | |
| Not accredited assistant or associate prof. | 25,581 | 0 | 1 | 0.494 | - | - |
Table 3. Correlation matrix of variables in the statistical model. |
| 1 | 2 | 3 | 4 | 5 | 6 | 7 | 8 | 9 | |
|---|---|---|---|---|---|---|---|---|---|
| 1 | - | ||||||||
| 2 | -0.112 | - | |||||||
| 3 | -0.228 | 0.496 | - | ||||||
| 4 | 0.065 | 0.220 | -0.064 | - | |||||
| 5 | -0.051 | -0.030 | -0.048 | 0.071 | - | ||||
| 6 | -0.008 | -0.068 | -0.003 | 0.026 | -0.008 | - | |||
| 7 | 0.020 | 0.121 | -0.009 | -0.061 | -0.165 | -0.020 | - | ||
| 8 | -0.034 | -0.020 | 0.097 | -0.168 | -0.028 | -0.045 | 0.320 | - | |
| 9 | -0.127 | -0.036 | 0.270 | -0.349 | -0.289 | -0.007 | 0.370 | 0.262 | - |
| 10 | 0.087 | 0.141 | -0.161 | 0.260 | -0.019 | -0.011 | -0.050 | -0.250 | -0.552 |
1 - Gender; 2 - Age; 3 - Academic rank; 4 - Status_ASN; 5 - Specialization Index; 6 - Geographical location; 7 - LN_co_authors; 8 - International; 9 - LN_publication; 10 - Originality of bibliographies. |
5 Results
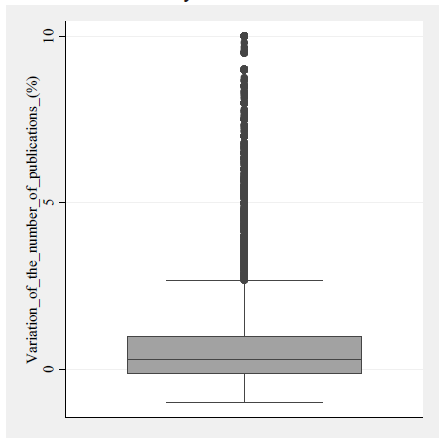
Figure 1. Distribution of the variation in the number of publications (2013-2017 vs. 2008-2012) authored by 25,581 Italian professors in the dataset. |
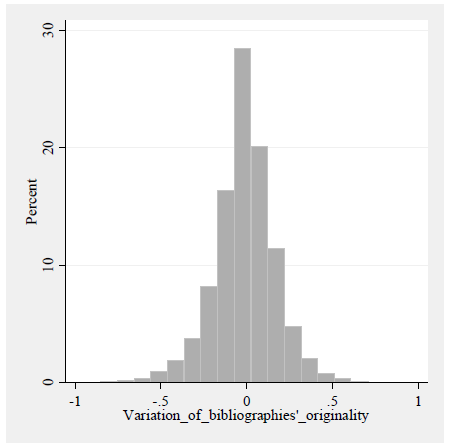
Figure 2. Distribution of the variation in bibliographies’ originality (2013-2017 vs. 2008-2012) of publications authored by the 25,581 Italian professors in the dataset. |
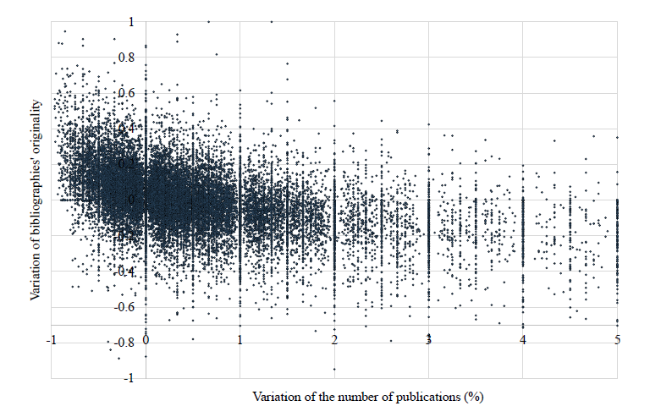
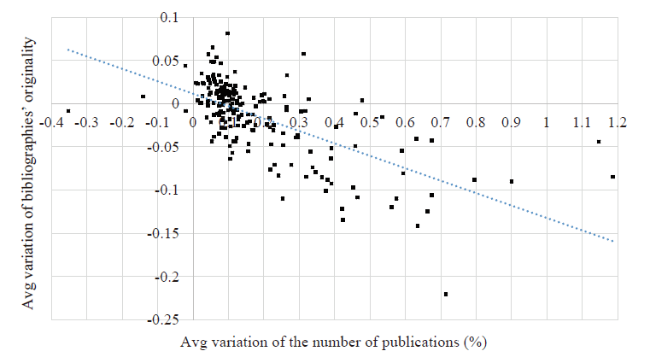
Figure 3. Variation of the number of publications and of bibliographies’ originality (2013-2017 vs. 2008-2012), for the 25,581 Italian professors in the dataset.*Note: * 700 observations in the dataset. *aset. **il of the x-axis were omitted, for improving data visualization. |
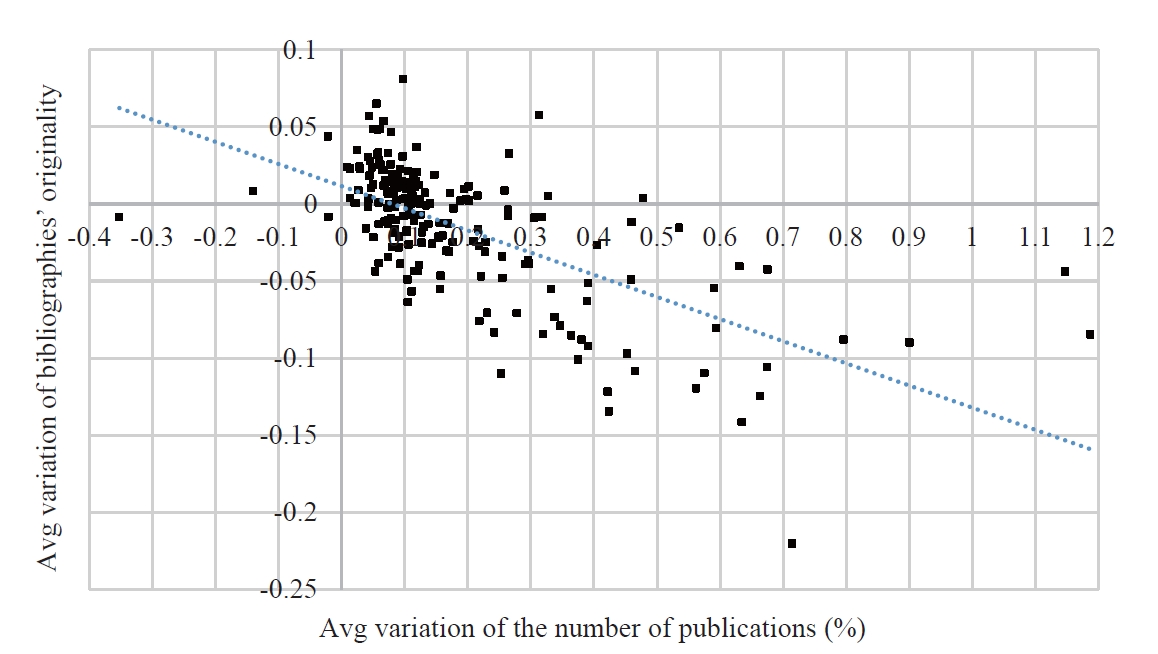
Figure 4. Average variation of the number of publications and of bibliographies’ originality (2013-2017 vs. 2008-2012), for the 25,581 Italian professors in the dataset by SDSs. |
Table 4. Estimates of the main parameters of the OLS model for the analysis of the number of publications of Italian professors overall. |
| Model 1 | Model 2 | |
|---|---|---|
| Post_ASN | 0.4301*** (0.0077) | - |
| Gender | -0.1121*** (0.0082) | -0.1117*** (0.0082) |
| Age | -0.0494*** (0.0006) | -0.0492*** (0.0006) |
| Academic rank (Assistant as baseline) | ||
| Associate | 0.5615*** (0.0089) | 0.5348*** (0.0123) |
| Full | 1.1598*** (0.0115) | 1.1072*** (0.0149) |
| Acad. Rank#Post_ASN | ||
| Assistant | - | 0.3791*** (0.0129) |
| Associate | - | 0.4384*** (0.0118) |
| Full | - | 0.4835*** (0.0143) |
| Specialization_Index | -0.1203*** (0.0240) | -0.1197*** (0.0240) |
| Constant | 3.1897*** (0.0513) | 3.1972*** (0.0512) |
| F(205, 50956) | 148.54 | 147.18 |
| Prob > F | 0.0000 | 0.0000 |
| R-squared | 0.3597 | 0.3601 |
| Root MSE | 0.8092 | 0.8090 |
200 dummies for as many SDSs for controlling field effects. Linear regression - Number of obs = 51,162. Robust standard errors in brackets. |
Table 5. Estimates of the PostASN parameter of the OLS model for the analysis of the number of publications of Italian professors, by UDA. |
| UDA* | Obs | Coef. | Robust Std. Err. | t | P>t | [95% Conf. Interval] | R-squared | |
|---|---|---|---|---|---|---|---|---|
| 1 | 4,614 | 0.2788 | 0.0234 | 11.93 | 0.000 | 0.2330 | 0.3246 | 0.2482 |
| 2 | 3,195 | 0.2935 | 0.0393 | 7.46 | 0.000 | 0.2164 | 0.3707 | 0.2615 |
| 3 | 4,442 | 0.2010 | 0.0222 | 9.07 | 0.000 | 0.1576 | 0.2445 | 0.2541 |
| 4 | 1,564 | 0.5637 | 0.0389 | 14.5 | 0.000 | 0.4875 | 0.6400 | 0.3078 |
| 5 | 7,101 | 0.2456 | 0.0179 | 13.69 | 0.000 | 0.2104 | 0.2808 | 0.2804 |
| 6 | 13,942 | 0.4143 | 0.0157 | 26.43 | 0.000 | 0.3836 | 0.4451 | 0.3684 |
| 7 | 4,708 | 0.5535 | 0.0233 | 23.71 | 0.000 | 0.5077 | 0.5992 | 0.3503 |
| 8 | 2,192 | 0.7974 | 0.0350 | 22.81 | 0.000 | 0.7288 | 0.8660 | 0.3330 |
| 9 | 7,808 | 0.5851 | 0.0195 | 30 | 0.000 | 0.5468 | 0.6233 | 0.3432 |
| 10 | 1,596 | 0.7474 | 0.0438 | 17.05 | 0.000 | 0.6614 | 0.8334 | 0.3659 |
* 1 - Mathematics and computer science, 2 - Physics, 3 - Chemistry, 4 - Earth sciences, 5 - Biology, 6 - Medicine, 7 - Agricultural and veterinary sciences, 8 - Civil engineering, 9 - Industrial and information engineering, 10 - Psychology. SDS dummies in each UDA, for controlling field effects. |
Table 6. Estimates of the main parameters of the OLS model for the analysis of the originality of bibliographies of Italian professors’ publications. |
| Model 1 | Model 2 | |
|---|---|---|
| Post_ASN | -0.0153*** (0.0016) | - |
| Gender | 0.0024 (0.0017) | 0.0023 (0.0017) |
| Age | 0.0049*** (0.0001) | 0.0048*** (0.0001) |
| Academic rank (Assistant as baseline) | ||
| Associate | -0.0509*** (0.0019) | -0.0466*** (0.0026) |
| Full | -0.1034*** (0.0024) | -0.0946*** (0.0031) |
| Acad. rank#Post_ASN | ||
| Assistant | - | -0.0068*** (0.0026) |
| Associate | - | -0.0164*** (0.0025) |
| Full | - | -0.0241*** (0.0029) |
| University location (South as baseline) | ||
| Center | -0.0027 (0.0020) | -0.0026 (0.0020) |
| North | -0.0027 (0.0018) | -0.0026 (0.0018) |
| Specialization_Index | 0.0343*** (0.0041) | 0.0345*** (0.0041) |
| International collab. intensity | -0.0679*** (0.0037) | -0.0678*** (0.0037) |
| Number of co-authors | -0.0179*** (0.0016) | -0.0178*** (0.0016) |
| Constant | 0.6883*** (0.0107) | 0.6869*** (0.0107) |
| F(209, 49376) | (209,49376) 130.74 | (211,49374) 129.78 |
| Prob > F | 0.0000 | 0.0000 |
| R-squared | 0.3271 | 0.3274 |
| Root MSE | 0.1637 | 0.1637 |
200 dummies for as many SDSs for controlling field effects. Linear regression - Number of obs = 49,586. Robust standard errors are in brackets. |
Table 7. Estimates of the main parameters of the OLS model for the analysis of the originality of bibliographies of Italian professors’ publications based on their ASN Status. |
| Coef. | Robust Std. Err. | t | P>t | [95% Conf. | Interval] | |
|---|---|---|---|---|---|---|
| Gender | 0.0013 | 0.0016 | 0.77 | 0.440 | -0.0020 | 0.0013 |
| Age | 0.0029 | 0.0001 | 22.82 | 0.000 | 0.0026 | 0.0029 |
| Status_ASN_n (Full as baseline) | ||||||
| Assistant_accredited | 0.0021 | 0.0037 | 0.57 | 0.566 | -0.0051 | 0.0021 |
| Associate_accredited | -0.0338 | 0.0037 | -9.11 | 0.000 | -0.0410 | -0.0338 |
| Not_accredited | 0.0989 | 0.0029 | 34.15 | 0.000 | 0.0932 | 0.0989 |
| Status_ASN_n#Post_ASN | ||||||
| Assistant_accredited | 0.0093 | 0.0034 | 2.69 | 0.007 | 0.0025 | 0.0093 |
| Associate_accredited | 0.0077 | 0.0039 | 1.94 | 0.052 | -0.0001 | 0.0077 |
| Full professor | -0.0148 | 0.0031 | -4.81 | 0.000 | -0.0208 | -0.0148 |
| Not accredited | -0.0307 | 0.0023 | -13.5 | 0.000 | -0.0351 | -0.0307 |
| Specialization_Index | 0.0271 | 0.0040 | 6.78 | 0.000 | 0.0193 | 0.0271 |
| International collab. intensity | -0.0564 | 0.0036 | -15.74 | 0.000 | -0.0635 | -0.0564 |
| Number of co-authors | -0.0161 | 0.0015 | -10.46 | 0.000 | -0.0191 | -0.0161 |
| Constant | 0.7005 | 0.0116 | 60.57 | 0.000 | 0.6778 | 0.7005 |
Linear regression - Number of obs = 49,586. F(213, 49372) = 145.83; Prob > F = 0.0000; R-squared = 0.3500; Root MSE = 0.1609. |
Table 8. Composition of two subsets of the total population for analysis. |
| Set | Subset 1 | Subset 2 | Total Obs |
|---|---|---|---|
| A - Professors registering a marked decrease in output between the two periods | Unproductive after 2012, with at least 5 publications before (54 obs) | Professors registering a decrease of at least 60% in their output after 2012 compared to the period before (960 obs) | 1,014 |
| B - Professors registering a marked increase in output between the two periods | Unproductive before 2012, with at least 5 publications after (310 obs) | Professors registering an output at least 5 times higher after 2012, compared to the period before (700 obs) | 1,010 |