

1 Introduction
Research integrity and academic standards serve as the cornerstone of scientific and technological innovation, the lifeline of researchers, and the guarantor of the authenticity and reliability of scientific research outcomes. In recent years, research integrity and academic standards are esteemed by the state, society, and the academic community. However, some researchers still risk purchasing counterfeit papers and publishing them in international journals to secure promotions or other benefits swiftly. Consequently, numerous “Paper mills” have emerged, driven by commercial motives to produce customized theses, furnish false data, and offer manuscript submission and revision services—tailored to the client’s financial willingness—as well as related “full-service premium packages”. In a large-scale investigation of academic fraud in 2020, investigators from external journals classified over 1,300 papers as “suspicious,” underscoring the pervasive impact of “Paper mills” activities that have undoubtedly cast a dark shadow across the entire academic community (Else & Van Noorden, 2021).
1.1 Current situation of “Paper mills”
According to the 2022 SCI Retraction Briefing, instances occurred where publishers retracted multiple papers simultaneously. In 2022 alone, there were over 4,600 retractions, bringing the Retraction Watch Database’s total to over 37,000. The provided graphic shows a steady increase in the rate of retractions to around 8 per 10,000 published papers (Oransky, 2022).
In 2022, Xinhua News Agency published an in-depth report on the “one-stop” services of underground “Paper mills”. The report highlighted that individuals involved in dissertation “production” possess scientific research capabilities, ensuring the dissertations meet certain quality standards. Many have undergone systematic education, being PhD graduates in related fields, and have joined so-called “biotechnology companies”. Notably, some were unaware they would be engaged in thesis writing prior to joining these companies. Furthermore, the report disclosed the mass production methods employed by “Paper mills”. Despite the lack of originality in papers from “Paper mills”, they possess a deep understanding of major journals’ or publishers’ preferences, enabling them to select research areas where formulas are more readily applicable. This phenomenon seriously undermines the academic community’s integrity and quality, necessitating urgent and effective countermeasures.
Should such “fake paper services” remain unregulated, the foundation of global academic ethics and integrity risks being compromised. Recently, there has been a gradual increase in the withdrawal rate of academic papers, prompting China to implement measures aimed at enhancing research integrity.
In 2020, the General Office of the Ministry of Science and Technology (MOST) released a notice to reinforce the core responsibility of entities involved in national science and technology programs, including special projects and funds, towards fostering a culture of research integrity. Subsequently, in 2022, MOST issued guidelines detailing procedures and penalties for investigating and addressing research misconduct. In 2023, the General Office of the Ministry of Science and Technology released a notice urging universities to reduce existing academic misconduct in publications, prevent further instances, and bolster scientific integrity among researchers.
1.2 Current difficulties in detecting “Paper mills”
The development of automated “Paper mills” detection models is contingent on relevant datasets. Currently, major databases like the Retraction Watch Database and Web of Science only record the content of retracted articles, lacking datasets related to the citations of these papers. This absence hinders further research efforts.
Regarding citation pattern irregularities, Chakraborty et al. (2021) highlighted phenomena like mutual citations and self-citations as indicators of improper citations. Liu et al. (2024) verified the presence of irrelevant citations in paper-mill papers using a manually labelled dataset. However, these paradigms lack sufficient complexity and detail for direct application in automated “Paper mills” citation detection.
For automated “Paper mills” detection, Papermill Alarm—a software tool analyzing titles and abstracts of scientific papers for text similarity to forged articles—is monitored closely by publishers. However, it only detects features at the textual level without addressing the inappropriate aspects of citations (Else, 2022).
1.3 Our contribution
We collected over 1,600 articles retracted due to “Paper mills” activities, securing their DOIs and gathering essential data including citations, citations of citations, and citations of the cited papers via the “OpenCitations” channel. Upon constructing a citation network homomorphic graph from these “Paper mills” citations and observing suboptimal performance, we enhanced the graph with additional details (journals, publishers, titles, authors, etc.). This resulted in a more complex heteromorphic graph with 5 million nodes and 11 million edges, laying the foundation for further modeling and “Paper mills” detection.
We introduced the PDCN model, a citation network-based approach for “Paper mills” detection, which considers both paper node characteristics and the structural intricacies of various meta-path compositions.
Specifically, we employed the KeyBert model to extract title keywords, which were then processed by the BERT model to derive text features. This approach emphasizes noun adjectives in titles and addresses the issue of synonym-induced variability in text feature extraction.
Furthermore, we integrated graph neural network algorithms for automated “Paper mills” detection to discern structural features. Our chosen heterogeneous graph attention network model produces node embeddings through hierarchical aggregation of neighborhood features along meta-paths. To enable thorough learning of specific structural features by thesis nodes, we devised several meta-paths optimized for “Paper mills” detection.
Not all features learned by the graph neural network model aid in detecting “Paper mills” papers, prompting us to incorporate a classifier module to discern and leverage useful features more effectively.
Our work can be summarized in the following three contributions:
1. We constructed the inaugural citation network heterogeneous graph for “Paper mills” detection, featuring 5 million nodes and 11 million edges. This heterogeneous graph mirrors real-world citation networks and can be shared with researchers for further study on automated “Paper mills” detection models.
2. We introduced a “Paper mills” detection model that merges keyword features from document titles with the structural dynamics of citation networks. Our design of multiple meta-paths, advantageous for detecting “Paper mills” papers, addresses the limitations of models relying solely on textual document features. Furthermore, we employed LGBM classifiers to refine feature learning from node embeddings and accurately identify “Paper mills” papers.
3. Testing the PDCN model on our citation network heterogeneous graph yielded an accuracy up to 82% and an F1-score of 81%, surpassing baseline models like RGCN, HGT, etc. Moreover, we can provide scientific explanations for our model’s judgments based on the meta-paths and the weights of neighboring nodes.
2 Related work
2.1 Manual discovery of “Paper mills” features
At present, the detection of thesis mills is still mainly based on manual detection, in which the reviewers of publishers or journals identify thesis mill papers by some more significant features of thesis mills. In this paper, we select a few representative studies to introduce.
In terms of paper text, previous reports mention that the stylistic similarity method is the best method we have for estimating the prevalence of “Paper mills” research, and that this method captures real papers plagiarised by “Paper mills”, or where authors have packed real data into boilerplate essays (Else & Van Noorden, 2021; Van Noorden, 2023). Candal-Pedreira et al. (2022) found that so-called “tortured phrases” are used in “Paper mills” so-called “torture phrases”, i.e., unusual phrases rather than established ones, which may be a suspicious feature of academic misconduct.
In terms of other information related to the paper, Seifert’s study found 20 characteristics of “Paper mills” papers, including commercial email addresses, unavailability of original data, and absence of academic institutions by the authors (Seifert, 2021). da Silva and Nazarovets (2023) analysed retractions of 23 withdrawn papers, and obtained anomalies in the emails and identities of the authors of retracted papers, the proportion of citing retracted papers, and the proportion of citing retracted papers that had been withdrawn disproportionate citation of retracted literature and other characteristics. In addition, Wittau et al. (2024) suggested in their paper that “Paper mills” are taking advantage of the fact that journals are unaware of submissions to other journals to submit their papers multiple times (or even simultaneously).
In summary, some of the features described above exist in a single dimension and are difficult to use in an automated “paper mill” detection tool.
2.2 Automatic identification of “Paper mills”
Automated detection at the textual level of “Paper mills” papers is already available with tools such as “Papermill Alarm”, which analyses the titles and abstracts of academic papers and detects text similar to that found in fraudulent articles.
In terms of citations, Rogerson (2014) describes the clues identified in “Paper mills” papers, including the fact that “Paper mills” papers inappropriately cite information outside of their subject area and bibliographic “mash-ups”, where academic journals and books are mixed into a single reference. Chakraborty et al. (2021) analysed a dataset of papers related to the Microsoft Scholarly Search and summarised the results of the “Paper mills” detection. We summarised three paradigms for “Paper mills” paper detection, including self-looping, pairwise cross-citation and group cross-citation. However, they were not able to propose a multilayer model using different sets of the above features (da Silva & Nazarovets, 2023).
2.3 Shortcomings and improvements of related work
In summary, manually discovered features of dissertation “Paper mills” papers are difficult to be directly applied to automatic detection systems, and the generalisation is not strong. In addition, most of the current automatic identification tools analyse the titles, abstracts and texts of papers, and citation-related research lacks deeper feature mining.
The PDCN model proposed in this paper constructs a citation network heterogeneous graph from the perspective of citation and cited papers, combines with the heterogeneous graph attention network model for the detection of “Paper mills” papers, discovers multi-dimensional, deep-level features of “Paper mills” papers, and carries out validation and analysis on the huge citation network dataset constructed by ourselves.
3 Pattern discovery and feature mining
3.1 Citation pattern classification
We identified three citation patterns related to “Paper mills” activities and developed the PDCN model, which utilizes these patterns for automated “Paper mills” detection.
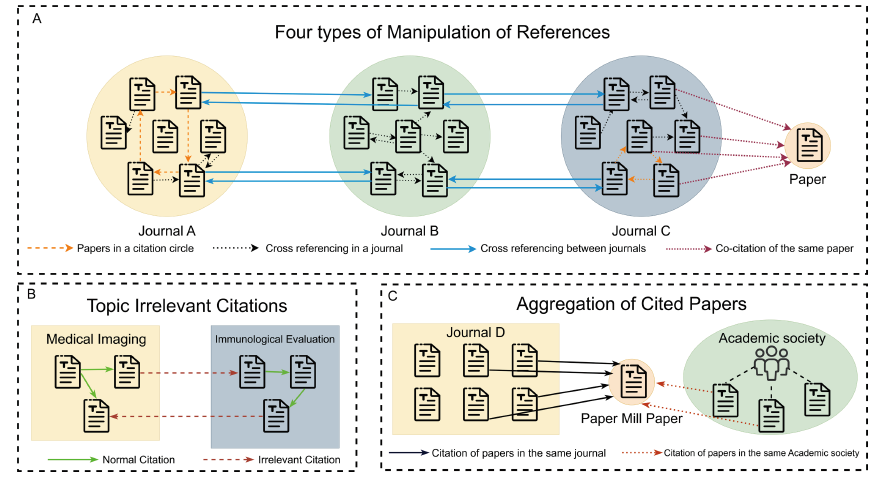
The three citation patterns include manipulated citations, irrelevant citations, and aggregation of the cited papers, as shown in Figure 1.
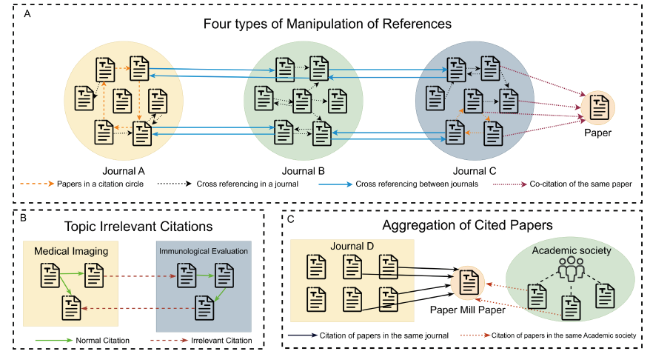
Figure 1. Three “Paper mills” citation patterns. |
Manipulated citation involves researchers using unethical methods to inappropriately manipulate references, aiming to artificially inflate citation counts or the paper’s impact factor, as illustrated in Figure 1-A. Manipulation of references includes four types:
1. Circular citation within a journal involves multiple papers from the same publication citing each other to artificially boost citation counts, as shown by the orange arrows in Figure 1-A.
2. Cross-citation of within the same journal, occurs when two papers from the same journal are cross-cited in order to increase citations, as shown by the black arrows in Figure 1-A.
3. Cross-citation between journals involves multiple papers from two different publications citing each other, as shown by the blue arrows in Figure 1-A.
4. Simultaneous citation of papers within journals refers to the fact that when multiple papers published in the same journal belong to the same batch of “paper production”, they often cite the same batch of papers, as shown by the red arrows in Figure 1-A.
The study conducted by Chakraborty et al. (2021) quantifies the occurrences of the first and third types of manipulated citations using the Microsoft Academic Search dataset, thereby validating the pertinence of our proposed citation mode.
Irrelevant citations are references in academic papers that lack relevance or are only marginally related to the paper’s subject matter. These citations fail to offer substantial support or essential information for the topic, as illustrated in Figure 1-B. Irrelevant citations encompass two forms: references to papers unrelated to the topic and the inclusion of citations directly from those referenced papers.
Aggregation of cited papers refers to the need to increase the number of citations in a short period of time after the publication of “Paper mills” papers, which are cited in articles with similar provenance, as shown in Figure 1-C. Aggregation includes the fact that the cited papers belong to a journal, publisher, or scholarly society.
3.2 Metapath design
Based on these citation patterns above, we designed multiple meta-paths, which can be calculated how much these citation patterns play a role in our automated detection of “Paper mills” model (see Chapter 6 for details) by using the heterogeneous graphical attention network model (see Chapter 4 for details) and learning on the heterogeneous graph of citation networks that we constructed.
Meta-paths represent sequences that delineate the interactions among various node types, facilitating the exploration of similarities and influences between node (Chakraborty et al., 2021). In the context of automated “Paper mills” detection, we devised the following meta-paths, detailed in Figure 2:
1. Paper-Paper denotes the one-hop citation relationship of thesis nodes.
2. Paper-Paper-Paper denotes the two-hop citation relationship of thesis nodes.
3. Paper-Journal-Paper indicates that two papers were published in the same journal.
4. Paper-Publisher-Paper indicates that both papers were published under the same publisher.
5. Paper-Academic society-Paper indicates that the two papers were published by the same academic society.
6. Paper-Aux_Paper-Paper indicates that both papers cite the same paper. The Paper-Aux_Paper-Paper meta-path is a weighted meta-path, and we split the weighted meta-path into traditional meta-paths with different elements in the attribute value set, and we design two meta-paths with the number of papers cited by two papers at the same time being less than or equal to 5, and greater than 5.
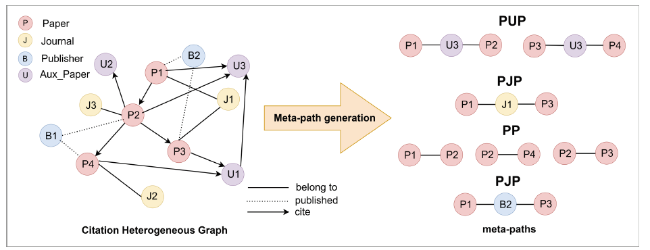
Figure 2. The process of constructing meta-paths from heterogeneous graphs. |
3.3 Matching of citation patterns and meta-paths
Table 1. Matching table for citation patterns and meta-paths. |
| Pattern Classification | Specific modalities | Meta-paths | |||||
|---|---|---|---|---|---|---|---|
| 1-PP* | 2-PPP | 3-PBP | 4-PJP | 5-PAuP | 6-PUP | ||
| Manipulation of References | Circular citation of papers in a journal |  |  | ||||
| Cross referencing in a journal |  |  |  | ||||
| Cross-referencing of papers between journals |  |  |  | ||||
| Papers within journals citing the same papers |  |  |  | ||||
| Irrelevant Citations | Citing papers that are not relevant to the topic |  | |||||
| Carrying citations directly from cited references |  |  | |||||
| Aggregation of Cited Papers | Same publisher |  |  | ||||
| Same journal |  |  | |||||
| Same academic society |  |  | |||||
Note*: 1-PP meta-paths indicate direct references to papers, so each specific pattern is matched on. |
4 Methodology
In this study, we introduced the PDCN model, designed for the automated detection of “Paper mills” papers via the citation network, with the model’s structure illustrated in Figure 3. The PDCN model extracts textual information features from each node via a textual feature extraction module and enables nodes to assimilate structural features using a heterogeneous graph attention network module. Ultimately, it identifies “Paper mills” nodes using the classifier module.
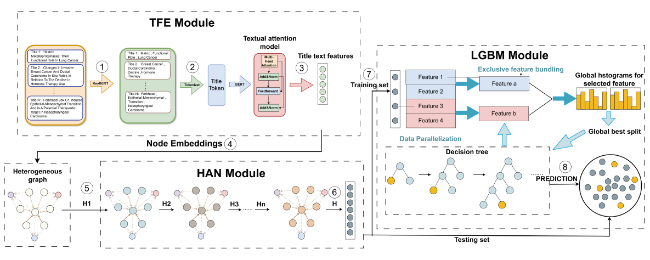
Figure 3. The framework of our proposed PDCN model. |
4.1 Text feature extraction module
The text feature extraction module of the PDCN model first uses KeyBert, an unsupervised keyword extraction algorithm, to extract the keywords/phrases in the title of the paper, and then puts the keywords/phrases into the BERT (Devlin et al., 2018) model to get the encoded features.
KeyBert first encodes the text into BERT embedded representations and then uses the cosine similarity measure to measure the similarity between the embedded representations. Next, the diversity problem is solved by using MSS and MMR algorithms to select the best set of keywords/phrases.
The BERT model is applied to the pre-training phase by using the Transformer architecture, which applies a bi-directional training approach to extract contextually relevant word vector representations. Specifically, we use the BERT model, which has been pre-trained on the “Paper mills” dataset, to disambiguate the keywords of the thesis node headings into a series of tokens, and encode these tokens through the embedding layer to produce the corresponding vector representations.
4.2 Heterogeneous graph attention network module
The Heterogeneous Graph Attention Network module of the PDCN model follows a hierarchical attention structure: node-level attention and semantic-level attention (as shown in Figure 4) to allow essay nodes to learn the graph structure of the citation network (Wang et al., 2019). Node-level attention aggregates the features of individual neighbors on a given meta-path to obtain semantically specific node embeddings; semantic-level attention is used to distinguish differences in meta-paths and to obtain the optimal weighted combination of essay node embeddings for the “Paper mills” detection task.
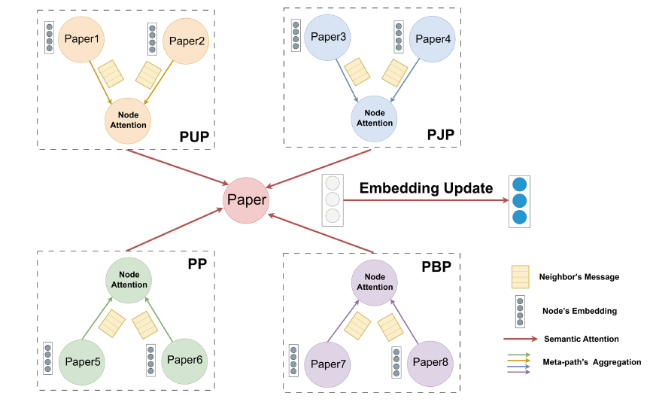
Figure 4. Hierarchical attention structure. |
4.2.1 Node-level attention
Node-level attention can go as far as learning the importance of neighbors based on specific meta-paths for each node in a heterogeneous graph, and aggregating the representations of these neighbors that are meaningful for detecting “Paper mills” to form node embeddings. We utilized self-attention to learn the weights between various nodes. Given a pair of nodes (i, j) connected via a meta-path Φ, the node-level attention $\alpha_{i j}^{\varnothing}$ can be to learn the importance of node j for node i. The importance of the meta-path based node pair (i, j) can be expressed as:
$e_{i j}^{\varnothing}=\operatorname{att}_{\text {node }}\left(h_{i}^{\prime}, h_{j}^{\prime} ; \varnothing\right)$
Here attnode denotes the deep neural network that performs node-level attention.
After obtaining the importance between pairs of nodes based on meta-paths, we normalize them and obtain the weight coefficients by Softmax function:
$\alpha_{i j}^{\varnothing}=\operatorname{softmax}_{j}\left(e_{i j}^{\varnothing}\right)=\frac{\exp \left(\sigma\left(\alpha_{\varnothing}^{T} \cdot\left[h_{i}^{\prime} \leftrightarrow h_{j}^{\prime}\right]\right)\right)}{\sum_{k \in N_{i}^{\varnothing}} \exp \left(\sigma\left(a_{\varnothing}^{T} \cdot\left[h_{i}^{\prime} \leftrightarrow h_{k}^{\prime}\right]\right)\right)}$
where σ is the activation function, ↔ is the connection operation, and $a_{\varnothing}^{T}$ is the node-level attention vector of the meta-path Φ.
The embedding of node i based on the meta-path can be aggregated by neighboring features with the following corresponding coefficients:
$z_{i}^{\varnothing}=\sigma\left(\sum_{j \in N_{i}^{\varnothing}} \alpha_{i j}^{\varnothing} \cdot h_{j}^{\prime}\right)$
where $z_{i}^{\varnothing}$ is the learned embedding of node i of the metapath.
Since heterogeneous graphs have scale-free properties and thus the variance of the graph data is large, we extend the node-level attention to multi-head attention to make the training process more stable. Specifically, we repeat node-level attention K times and connect the learned embeddings into semantics-specific embeddings.
4.2.2 Semantic-level attention
Each node in a heterogeneous graph contains multiple types of semantic information, and a node embedding for a particular kind of semantics can only reflect the node in one way. In order to learn a more comprehensive node embedding, we need to fuse multiple semantics, which can be represented by meta-paths.
To understand the importance of each meta-path, we first transform semantics-specific embeddings by nonlinearity. Then, we measure the importance of the semantic-specific embeddings in terms of the similarity of the transformed embeddings to the semantic-level attention vector q. This can be interpreted as the importance of each metapath, denoted by $ w_{\varnothing_{i}}$, as follows:
$w_{\varnothing_{i}}=\frac{1}{|V|} \sum_{i \in V} q^{T} \cdot \tanh \left(W \cdot z_{i}^{\varnothing}+b\right)$
Where W is the weight matrix, b is the bias vector and q is the semantic level attention vector. The weights of the meta-paths are normalized with the importance of all meta-paths using the Softmax function.
Finally using the learned meta-path weights as coefficients, we can fuse these semantic-specific embeddings to obtain the final embedding Z as follows:
$ Z=\sum_{i=1}^{P} w_{\varnothing_{i}} \cdot z_{i}^{\varnothing}$
We use the final embedding in the task of “Paper mills” inspection, and since the number of “Paper mills” papers is much smaller than the number of regular papers, we design the corresponding loss function to minimize the cross-entropy at all labeled nodes between the true and predicted values:
$ L=-\sum_{l \in y_{L}} Y^{l} \ln \left(Z^{l}\right) \cdot w[\operatorname{labels}[l]]$
Yl and Zl are the labels and embeddings of labeled nodes, and is the inverse of the ratio of the number of common papers to the number of papers in the “Paper mills”, which is [1:32] under our dataset. The model is optimized by backpropagation to learn the embeddings of the nodes, guided by the labeled data.
4.2.3 Big graph training methods
The large size of our heterogeneous graph dataset and the high feature dimensionality of thesis nodes make it impossible to load the entire graph into memory for computation. Therefore, we built a subgraph to update the information of all neighboring nodes required for embedding a node in a batch, and ensured that the number of neighbors of each node remained consistent through sampling techniques, so that a batch of nodes and their related neighboring embedding could form a Tensor and be put into the graphics card for computation. In this way, even a particularly large graph can be put into our model for training.
4.3 Classifier module
LightGBM (Ke et al., 2017) is a machine learning algorithm based on gradient boosting tree, the main idea is to use weak classifiers (decision trees) to iteratively train to get the optimal model, which has the advantages of high efficiency, low memory consumption, high accuracy, and high scalability. LightGBM is obtained by optimizing the algorithm based on XGBoost, and the optimization includes gradient-based one-sided sampling (GOSS) and mutually exclusive feature bundling (EFB).
4.3.1 Gradient-based one-sided sampling
The GOSS sampling method strikes a good balance between reducing the number of data instances and maintaining the accuracy of the learned decision tree. GOSS retains all instances with large gradients, and randomly samples the instances with small gradients, with a constant multiplier introduced for sampling in order to minimize the impact on the original data distribution.
First, we retain instances with large gradients to obtain a subset A of instances; then, for the remaining set Ac consisting of instances with smaller gradients, we further randomly sample a subset B of size b×|Ac| and finally, we split the instances on the subset AUB based on the estimated variance gain $ \widetilde{V}_{j}(d)$. where the variance gain is given by the following equation, and a and b are set hyperparameters, respectively.
$ \widetilde{V}_{j}(d)=\frac{1}{n}\left(\frac{\left(\sum_{x_{i} \in A_{l}} g_{i}++\frac{1-a}{b} \sum_{x_{i} \in B_{l}} g_{i}\right)^{2}}{n_{l}^{j}(d)}+\frac{\left(\sum_{x_{i} \in A_{r}} g_{i}++\frac{1-a}{b} \sum_{x_{i} \in B_{r}} g_{i}\right)^{2}}{n_{r}^{j}(d)}\right)$
4.3.2 Mutually exclusive feature bundling
This is a near lossless approach to reduce the number of valid features. In a sparse feature space, where many features are mutually exclusive, i.e., they never take non-zero values at the same time, it is then possible to bundle the exclusionary features into a single feature.
Specifically, a graph with weighted edges whose weights correspond to the total conflicts between features is first constructed, then features are sorted in descending order according to their degree in the graph, and finally, each feature in the ordered list is examined and assigned to an existing bundle with a small punch, or a new bundle is created.
5 Data source and collection
5.1 Dataset acquisition
As shown in Figure 5(a), we collected about 1,800 papers labelled as “Paper mills” by the “Retraction Watch database”. As shown in Figure 6, we extracted the metadata of these papers, focusing on obtaining the DOIs. We then obtained the DOIs of the cited papers and citing papers of these “Paper mills” papers through the “OpenCitations” channel, and subsequently extended the search was expanded to include two levels of citation relationships centered on these “Paper mills” papers. We recorded metadata for all papers encountered, including journal, publisher, title, author, etc.
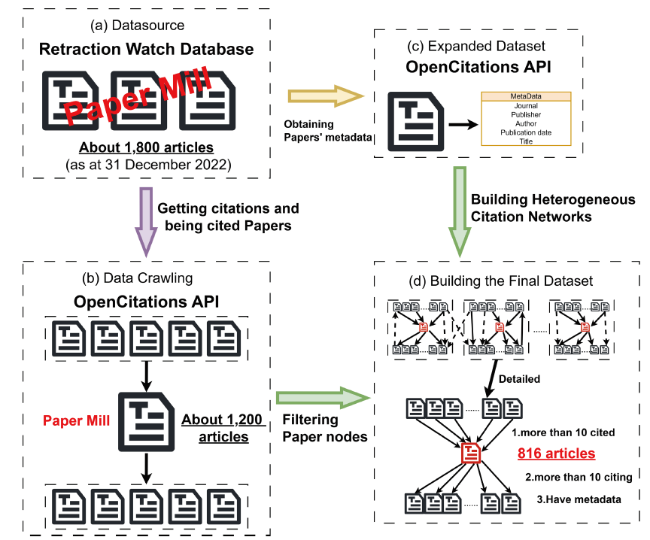
Figure 5. Dataset Construction Process. |
Figure 6. “Paper mills” cases. |
5.2 Data processing methods
As shown in Figure 5(d), owing to the limitations of the “OpenCitations” database, it may not be possible to retrieve all citations for a paper. Therefore, we only included papers and their citations in our records if the total number of citations exceeds 10, effectively reducing isolated nodes within the citation network. Simultaneously, we removed nodes lacking complete metadata and their associated edges, and ultimately leaves with 816 paper factory papers.
We recorded the search paths and corresponding metadata, designating papers one hop away from “Paper mills” papers as normal due to potential topic similarity. This categorization aims to minimize the topic’s impact on model classification. Papers two hops away from “Paper mills” papers were labeled as auxiliary nodes, serving in the creation of meta-paths. A total of six meta-path types were designed, detailing the node types, edge types, and meta-path counts in Table 2.
Table 2. Heterogeneous map dataset details. |
| Edge (A-B) | Num of A | Num of B | Meta-path | Num of Meta-path | Feature dimension | Training set | Validation set | Testing set |
|---|---|---|---|---|---|---|---|---|
| Paper-Paper | 25,900 | 25,900 | PP | 549,452 | 768 | 14,258 | 3,872 | 7,770 |
| 25,900 | 25,900 | PPP | 1,339,889 | |||||
| Paper-Journal | 25,900 | 3,226 | PJP | 2,742,868 | ||||
| Paper-Publisher | 25,900 | 285 | PBP | 81,173,164 | ||||
| Paper-Auxiliary_Paper | 25,900 | 500w | PUP | 62,193 | ||||
| 25,900 | 500w | PUP5 | 45,854 | |||||
| Paper-Academic Society | 25,900 | 16,010 | PAuP | 18,016 |
Ultimately, we constructed a heterogeneous graph incorporating journals, publishers, and citation relationships from the metadata, represented through multiple adjacency matrices.
5.3 Overview of the dataset
The heterogeneous graph dataset includes 5 types of edges, 5 types of nodes, and divides the dataset into training, validation, and test sets in the manner of 5.5:1.5:3 for thesis nodes. The final size of the citation network obtained and the distribution of the dataset are shown in Table 2 (where edge types A-B denote edges connecting node type A and node type B).
6 Experimental results and analysis
To assess the PDCN model’s effectiveness in detecting “Paper mills” papers, we employed various graph neural network models as baselines on our proprietary dataset. We conducted several comparative experiments to further demonstrate the superiority of the proposed PDCN model over baseline models. Additionally, we devised ablation studies to understand the contribution of different model components to the detection process. Ultimately, we investigated the foundation of the PDCN model’s detection capability by examining the interactions of “Paper mills” nodes with their neighbors across various meta-paths.
6.1 Experimental indicators
Since the task of the PDCN model is to detect “Paper mills”, we only consider the precision (P), recall (R), and F1 score for the category of “Paper mills” when evaluating the classification results obtained by the final classifier, which is calculated as follows:
$\begin{array}{l}P=\frac{T P}{T P+F P}, \\R=\frac{T P}{T P+F N},\end{array}$,
$ F 1=\frac{2 \times P \times R}{P+R}$
Where, TP denotes the number of “Paper mills” papers predicted as “Paper mills” papers, TN denotes the number of normal papers predicted as normal papers, FP denotes the number of normal papers predicted as “Paper mills” papers, and FN denotes the number of “Paper mills” papers predicted as normal papers.
In the task of detecting “Paper mills”, we are more concerned about whether the model can accurately determine a “Paper mills” paper without misjudgment, so the precision rate (P) is particularly important in our evaluation indexes.
At the same time, we also introduce two classical metrics for evaluating classification: the Normalized Mutual Information (NMI) and the Rand Index (ARI), both of which are used to measure the degree of similarity between the real labels and the classification results.
6.2 Baseline model
Since there are no citation network-based models for “Paper mills” detection investigated, we use a variety of graph neural network models such as RCCN and GIN as baseline models, as well as a bag-of-words representation of the paper’s title as the initial embedding of the graph neural network model nodes. A brief description of these methods is given below:
Bag-of-words model (Zhang et al., 2010): Bag-of-words model is a method of converting text into vectors, which ignores the order and structural information of words in the text, counts the number of occurrences of words in all titles, and creates a sparse matrix that contains the number of occurrences of the corresponding word in each article title.
RGCN (Chen et al., 2019): We use RGCN to get the embedding of the paper nodes, and then use Softmax classifier to categorize the paper nodes and find out the “Paper mills” papers.
HGT (Hu et al., 2020): HGT can maintain its specific representation space by different types of nodes and edges.
GIN (Xu et al., 2018): GIN model can get the feature representation of each node to achieve the classification of the graph.
RGAT (Wang et al., 2020): In RGAT, each node has a feature vector and the allocation of attention is decided by calculating the similarity between the nodes.
Also at the text level, we conducted classification experiments using LDA-Logistic Regression models for titles, abstracts, and bodies of “Paper mills” papers and regular papers.
6.3 PDCN model parameterization
We use the KeyBert model to extract keywords for each “Paper mills” paper title, the length of the extracted keywords is (1.2), and only the first 10 keywords or key phrases are returned. Then we use the BERT text attention model for text feature extraction, using the model pre-trained on a large-scale corpus in the hugging face repository as a baseline, and fine-tuning the training in the “Paper mills” title data. The maximum encoded text length encoder_max_length of the Tokenizer is set to 510.
In the Heterogeneous Graph Attention Network model, the batch_size for training is set to 128, the learning rate is set to 0.001, the number of attention heads is set to 64, the number of hidden layer units is set to 64, the weight decay is set to 0.001, the embedding dimension of the output is set to 4096, the number of rounds of training iterations is set to 200, and the patience value is set to 30.
For the classifier we use LGBM model, the number of base learners generated is 600, the number of leaf nodes on the decision tree is 31 and the minimum number of samples on a single leaf node is 40.
6.4 Experimental results
6.4.1 Comparison experiment
In this paper, we have chosen some graph neural network models as the comparison method, including RGCN, HGT, GIN, RGAT. The experimental results are shown in Table 3, and we can see that the PDCN model achieves better performance than the classical graph neural network model on our own dataset. Most of the baseline models have high recall (R) but low precision (P), which means that a large number of common papers are recognized as “Paper mills” papers. The PDCN model can not only detect most of the “Paper mills” papers, but also has fewer misclassifications, and its classification results are closer to the labels.
Table 3. Comparison of experimental results. |
| Model | Precision | Recall | F1-score | NMI | ARI |
|---|---|---|---|---|---|
| RGCN | 0.047 | 0.794 | 0.089 | 0.013 | -0.01 |
| HGT | 0.095 | 0.303 | 0.145 | 0.023 | 0.091 |
| GIN | 0.333 | 0.954 | 0.494 | 0.325 | 0.438 |
| RGAT | 0.029 | 0.845 | 0.058 | 0.001 | 0.007 |
| LDA-Title | 0.381 | 0.1039 | 0.1633 | ||
| LDA-Abstract | 0.549 | 0.437 | 0.487 | ||
| LDA-Full-text | 0.438 | 0.259 | 0.326 | ||
| PDCN | 0.819 | 0.795 | 0.805 | 0.626 | 0.788 |
To verify the generalization capability of the PDCN model, we utilized nine retracted papers from the renowned medical journal Molecular Medicine Reports as of August 1, 2024. Employing the same dataset construction method, we compiled a total of 11 paper mill papers and 366 regular papers. These papers were then tested using the PDCN model. The results demonstrated that the model achieved an average accuracy of 88% and a recall rate of 81%, successfully identifying 7 out of the 11 paper mill papers.
6.4.2 Ablation experiment
Our PDCN model consists of three modules, namely, a text feature extraction model (T), a heterogeneous graph attention network model (H), and a classification model based on gradient boosting decision trees (L). We explore the effect of each module on the overall model performance separately. The experimental results are shown in Table 4.
Table 4. Experimental results of ablation experiments. |
| Model | Precision | Recall | F1-score | NMI | ARI |
|---|---|---|---|---|---|
| H | 0.101 | 0.865 | 0.186 | 0.091 | 0.129 |
| T+H | 0.057 | 0.857 | 0.108 | 0.038 | 0.039 |
| T+L | 0.231 | 0.041 | 0.069 | 0.018 | 0.058 |
| H+L | 0.428 | 0.439 | 0.434 | 0.234 | 0.414 |
From the ablation experiments we can get the following conclusions:
(1) Structural features identified by the heterogeneous graph attention network model prove more beneficial for detecting “Paper mills” papers than node features derived from textual analysis. This indicates that the citation structure of “Paper mills” papers possesses distinct characteristics.
(2) The significant influence of the LGBM classifier suggests that not all features from the heterogeneous graph attention network model aid in “Paper mills” detection, with LGBM effectively isolating crucial features for this purpose.
(3) The textual feature extraction module significantly enhances model performance, with title keywords aptly capturing thesis node characteristics. This also suggests “Paper mills” titles exhibit unique structural and lexical patterns.
6.5 Model explanatory analysis
6.5.1 Meta-path interpretive analysis
Based on the ablation experiments in the previous subsection, it can be seen that the heterogeneous graph attention network is the most important in our PDCN model, and the aggregation of each node for each meta-path in this model is based on the weights of the meta-paths, and we statistically averaged the weights of the meta-paths for each meta-path of all the nodes, as shown in Table 5.
Table 5. Meta-path weights in the heterogeneous graph attention network. |
| Name of Meta-path | Meta-path weights |
|---|---|
| PP | 0.0049 |
| PPP | 0.0052 |
| PJP | 0.4129 |
| PBP | 0.0052 |
| PUP | 0.0111 |
| PUP5 | 0.3353 |
| PAuP | 0.2255 |
The table shows that the meta-paths PUP5 and PJP significantly impact node aggregation. We provide a separate explanatory analysis of these two meta-paths for detecting “Paper mills” papers below.
The meta-path PUP5 connects two paper nodes citing the same paper, suggesting that “Paper mills” papers often cite batches of papers.
The meta-path PJP links papers published in the same journal. We identify journals with many “Paper mills” submissions, such as “Journal Of Cellular Biochemistry” and “RSC Advances.” This pattern may stem from Paper mills mimicking the preferred structure or style of these journals, aiming to increase their acceptance rate.
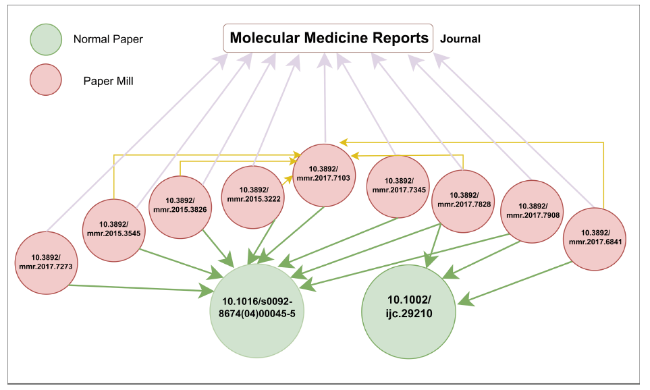
6.5.2 “Paper mills” case study
In the heterogeneous map dataset we created, 15 “Paper mills” papers were simultaneously published in “Molecular Medicine Reports” and cited the article “MicroRNAs: Genomics, Review, Biogenesis, Mechanism, and Function.” Additionally, three of these papers cited another article concurrently, as depicted in Figure 6, where only a selection is shown, and the nodes represent the papers’ DOIs. This evidence further confirms the validity of the explanatory analysis in Subsection 6.5.1.
7 Conclusion and future work
Amid recurring instances of scientific research dishonesty that have significantly undermined the academic environment, and with the government’s strong emphasis on fostering scientific integrity and academic standards, this study aims to develop a comprehensive citation network dataset and apply graph neural network algorithms for detecting “Paper mills” papers.
Specifically, we developed a heterogeneous graph with millions of nodes and edges, and concurrently established the PDCN model, which is an adaptation of the original attention network model. The textual feature extraction module effectively captures the title features, serving as the initial node embeddings. Multiple meta-paths were designed to enable the attention network model to layer and optimally combine neighboring connections and pathways, enhancing the paper node embeddings’ ability to encapsulate the citation network’s complex structure and semantics. Ultimately, the classifier accurately identifies “Paper mills” papers utilizing node embeddings generated by the graph neural network model.
In the future, this method can be fused with text, image and other detection methods to form a detection platform to provide more comprehensive automated “Paper mills” detection services for publishers, management agencies and journals.
Meanwhile, the present model can be improved and enhanced in the following three aspects. First, thesis nodes could be segmented into distinct categories based on specific features, with a dedicated classifier developed for each category. Second, expanding the dataset and designing more comprehensive meta-paths could be explored. Lastly, implementing a multi-supervision mechanism and integrating the PDCN model’s three modules into a unified framework for end-to-end classification training is another avenue for exploration.
Funding information
The work is supported by the National Science Foundation of China (Grant No. 62176026), Project of “Image Inspection Basic Data and Platform Construction”, Department of Science and Technology Supervision and Integrity Building, Ministry of Science and Technology (Grant No. GXCZ-D-21070106),and ISTIC-Taylor & Francis Group Academic Frontier Watch Joint Laboratory Open Grant.
Author contributions
Jun Zhang (2023140696@bupt.cn): proposed the research idea, collected, cleaned and analyzed the data, designed the research program, conducted the experiments and wrote the paper.
Jianhua Liu (liujh@wanfangdata.com.cn): participated in research idea design, provided basic data, directed experiments, participated in writing the paper.
Haihong E (ehaihong@bupt.edu.cn): participating in the design of research ideas, directing experiments, and revising the paper.
Tianyi Hu (hutianyi@bupt.edu.cn): participating in research idea design, collecting, cleaning and analyzing data, designing research scheme.
Xiaodong Qiao (qiaox@wanfangdata.com.cn): supervised the experiments.
Zichen Tang (tangzichen@bupt.edu.cn): supervised the experiments.