


1 Introduction and contribution
2 Background
2.1 The concept of metric-wiseness
Table 1. Description of the dataset (Adapted from Rousseau et al., 2021). |
| Sample | Total Sapienza | |||||
|---|---|---|---|---|---|---|
| Faculty | Group | N | % in sample | % in category | N | % |
| Mathematics, Physics and Natural Sciences | Exact sciences | 59 | 18.85 | 14.15 | 417 | 12.61 |
| Architecture | Engineering & Technology | 9 | 2.88 | 5.36 | 168 | 5.08 |
| Civil and Industrial Engineering | 37 | 11.82 | 12.80 | 289 | 8.74 | |
| Information Engineering, Informatics and Statistics | 38 | 12.14 | 17.12 | 222 | 6.72 | |
| School of Aerospace Engineering | 2 | 0.64 | 20.00 | 10 | 0.30 | |
| Pharmacy and Medicine | Medical sciences | 36 | 11.50 | 7.81 | 461 | 13.94 |
| Medicine and Dentistry | 32 | 10.22 | 5.50 | 584 | 17.66 | |
| Medicine and Psychology | 29 | 9.27 | 8.76 | 331 | 10.01 | |
| Arts and Humanities | Humanities and Social sciences | 38 | 12.14 | 10.11 | 376 | 11.37 |
| Economics | 11 | 3.51 | 6.15 | 179 | 5.41 | |
| Law | 4 | 1.28 | 4.65 | 86 | 2.60 | |
| Political Science, Sociology and Communication Science | 18 | 5.75 | 9.84 | 183 | 5.54 | |
| TOTAL | 313 | 9.47 | 3,306 | |||
*We report the size of the sample (N), % of faculty in the sample (% in sample = column (3)/313), and % of faculty compared to the relevant group within Sapienza (% in category = column (3)/column (6)). The last two columns show the total number of academics in place in Sapienza on December 31, 2018 (“N”) and their % (“%”) distributed by faculty. |
2.2 Disciplinary differences in academics’ views on metrics
2.3 Research evaluation in Italy
3 Methods
3.1 Survey design
3.2 Data collection
Table 2. Distribution of participants by function and gender compared with the distribution of the population of Sapienza University on December 31, 2018 (“Total N” and “%”). (Adapted from Rousseau et al., 2021). |
| Function | N. of resp. | % in sample | % sample compared to total N in category | Total N | % |
|---|---|---|---|---|---|
| Full professor | 60 | 19.17 | 8.90 | 674 | 20.39 |
| Associate professor | 121 | 38.66 | 10.42 | 1,161 | 35.12 |
| Full-time assistant professor | 69 | 22.04 | 6.26 | 1,102 | 33.33 |
| Contract professor (professori incaricati) | 8 | 2.56 | - | - | - |
| Temporary assistant professor L. 230/05 | 1 | 0.32 | - | - | - |
| Temporary assistant professor L 240/10 Tipo A | 23 | 7.35 | 10.85 | 212 | 6.41 |
| Temporary assistant professor 240/10 Tipo B | 16 | 5.11 | 10.19 | 157 | 4.75 |
| Other (retired) | 15 | 4.79 | - | - | - |
| Gender | |||||
| Male | 199 | 63.58 | 10.04 | 1,982 | 59.95 |
| Female | 113 | 36.10 | 8.53 | 1,324 | 40.05 |
| X | 1 | 0.32 | - | - |
*We report the sample size (N of resp.), % of function/gender in the sample (% in sample = column (2)/313), and % of function/gender compared to the relevant group within Sapienza (% sample compared to total N in category = column (2)/column (5)). The last two columns show the total number of academics in place in Sapienza on December 31, 2018 (“N”) and their % ( “%”) distributed by function and gender. |
3.3 Exploratory document analysis
4 Results: Measuring researchers’ heterogeneity
Table 3. Cronbach’s alpha for the components capturing metric-wiseness. |
| Cronbach’s alpha | ||
|---|---|---|
| Component 1 | Technical knowledge of indicators | Not applicable (true - false statements) |
| Component 2 | Use of indicators | 0.3278 |
| Component 3 | Researchers’ intrinsic motivation | 0.3735 |
| Component 4 | External pressure | 0.6135 |
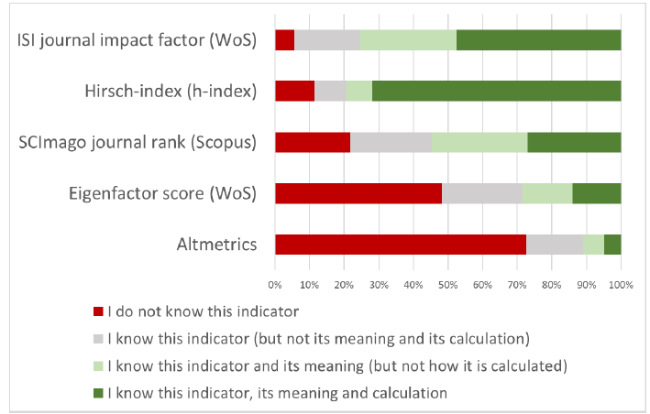
4.1 Component 1: Technical knowledge of indicators
Figure 1. Technical knowledge of indicators (N=263). |
Table 4. Technical knowledge of indicators (ranked according to the number of correct answers). |
| N = 263 | True, I am sure | True, I think | I do not know | False, I think | False, I am sure | Correct answers |
|---|---|---|---|---|---|---|
| C1.S1 - Bibliometric indicators can easily be compared across disciplines [FALSE] | 8 | 21 | 34 | 95 | 105 | 200 |
| (3.0%) | (8.0%) | (12.9%) | (36.1%) | (39.9%) | (76.0%) | |
| C1.S2 - Open Access journals never have a Web of Science impact factor [FALSE] | 7 | 16 | 78 | 82 | 80 | 162 |
| (2.7%) | (6.1%) | (29.7%) | (31.2%) | (30.4%) | (61.6%) | |
| C1.S3 - On average older researchers have higher h-indices [TRUE] | 54 | 96 | 52 | 49 | 12 | 150 |
| (20.5%) | (36.5%) | (19.8%) | (18.6%) | (4.6%) | (57.0%) | |
| C1.S4 - Citations received in conference proceedings are always included in an article’s total number of received citations in the Web of Science [FALSE] | 12 | 35 | 117 | 68 | 31 | 99 |
| (4.6%) | (13.3%) | (44.5%) | (25.9%) | (11.8%) | (37.6%) |
4.2 Component 2: Attitudes towards the use of indicators
Table 5. Component 2 was ordered by the increasing number of participants who agreed. |
| N = 263 | Absolutely agree | Agree | Neutral | Disagree | Absolutely disagree |
|---|---|---|---|---|---|
| C2.S1 - Bibliometric indicators are equally useful in evaluating disciplinary and interdisciplinary research | 7 | 46 | 79 | 87 | 44 |
| (2.7%) | (17.5% | (30.0%) | (33.1%) | (16.7%) | |
| C2.S2 - Besides citation-based indicators, one must, in applied fields, also take patent-based and similar indicators into account when evaluating researchers | 22 | 94 | 108 | 22 | 17 |
| (8.4%) | (35.7%) | (41.1%) | (8.4%) | (6.5%) | |
| C2.S3 - The social influence of research must be taken into account in evaluating researchers | 34 | 81 | 83 | 45 | 20 |
| (12.9%) | (30.8%) | (31.6%) | (17.1%) | (7.6%) | |
| C2.S4 - Besides citation-based indicators, one must also take journal standing within a field into account | 41 | 130 | 64 | 18 | 10 |
| (15.6%) | (49.4%) | (24.3%) | (6.8%) | (3.8%) | |
| C2.S5 - A purely bureaucratic, automatic and quantitative approach to research evaluation is unbiased for an individual researcher | 62 | 39 | 42 | 47 | 73 |
| (23.6%) | (14.8%) | (16.0%) | (17.9%) | (27.8%) | |
| C2.S6 - The quality of a researcher should be measured in relative terms within a field rather than in absolute terms | 126 | 108 | 22 | 4 | 3 |
| (47.9%) | (41.1%) | (8.4%) | (1.5%) | (1.1%) |
4.3 Component 3: Intrinsic motivation of researchers
Table 6. Component 3 statements were ordered in increasing levels of absolutely agreeing participants. |
| N = 263 | Absolutely agree | Agree | Neutral | Disagree | Absolutely disagree |
|---|---|---|---|---|---|
| C3.S1 - If I do not have the expertise to solve a particular problem, I do not hesitate to ask a colleague to collaborate with me | 14 | 25 | 68 | 80 | 76 |
| (5.3%) | (9.5%) | (25.9%) | (30.4%) | (28.9%) | |
| C3.S2 - I select research problems inspired by my own curiosity | 29 | 49 | 48 | 51 | 86 |
| (11.0%) | (18.6%) | (18.3%) | (19.4%) | (32.7%) | |
| C3.S3 - I select topics for research based on their potential to advance science | 82 | 120 | 49 | 7 | 5 |
| (31.2%) | (45.6%) | (18.6%) | (2.7%) | (1.9%) |
4.4 Component 4: External pressure
Table 7. Component 4 statements were ordered in increasing levels of absolutely agreeing participants. |
| N = 263 | Absolutely agree | Agree | Neutral | Disagree | Absolutely disagree |
|---|---|---|---|---|---|
| C4.S1 - My institution influences how I communicate the results of my research | 10 | 52 | 87 | 70 | 44 |
| (3.8%) | (19.8%) | (33.1%) | (26.6%) | (16.7%) | |
| C4.S2 - I feel ‘publish or perish’ pressure in carrying out my research | 12 | 48 | 96 | 70 | 37 |
| (4.6%) | (18.3%) | (36.5%) | (26.6%) | (14.1%) | |
| C4.S3 - I select topics for research based on their potential to get published quickly | 15 | 35 | 84 | 88 | 41 |
| (5.7%) | (13.3%) | (31.9%) | (33.5%) | (15.6%) | |
| C4.S4 - It is important to use social media (Twitter, blogs…) to share the results of my research | 27 | 104 | 88 | 36 | 8 |
| (10.3%) | (39.5%) | (33.5%) | (13.7%) | (3.0%) | |
| C4.S5 - It is important to use academic research networks (Mendeley, ResearchGate…) to share the results of my research | 30 | 90 | 65 | 59 | 19 |
| (11.4%) | (34.2%) | (24.7%) | (22.4%) | (7.2%) | |
| C4.S6 - My likelihood of being promoted depends only on the number of articles published in journals indexed in WoS or Scopus | 38 | 96 | 55 | 55 | 19 |
| (14.4%) | (36.5%) | (20.9%) | (20.9%) | (7.2%) | |
| C4.S7 - ANVUR influences my publication strategies | 41 | 58 | 51 | 49 | 64 |
| (15.6%) | (22.1%) | (19.4%) | (18.6%) | (24.3%) | |
| C4.S8 - Open Science (including publication, conservation and reuse of research data) is relevant for my research | 42 | 95 | 101 | 21 | 4 |
| (16.0%) | (36.1%) | (38.4%) | (8.0%) | (1.5%) | |
| C4.S9 - My likelihood of being promoted depends mainly on the number of articles of which I am first or corresponding author | 53 | 104 | 68 | 32 | 6 |
| (20.2%) | (39.5%) | (25.9%) | (12.2%) | (2.3%) | |
| C4.S10 - I feel completely free to publish my research in any way I want | 99 | 128 | 27 | 7 | 2 |
| (37.6%) | (48.7%) | (10.3%) | (2.7%) | (0.8%) | |
| C4.S11 - The Ministry of Education and Research (MIUR) influences my publication strategies | 107 | 86 | 32 | 29 | 9 |
| (40.7%) | (32.7%) | (12.2%) | (11.0%) | (3.4%) | |
| C4.S12 - My institution (Sapienza) influences my publication strategies | 144 | 92 | 19 | 6 | 2 |
| (54.8%) | (35.0%) | (7.2%) | (2.3%) | (0.8%) |
4.5 Additional relevant results from the survey
Table 8. The most important motivation for publishing (participants could select 3 out of 16 listed items). |
| N = 313 | N | % |
|---|---|---|
| To contribute to the scientific progress in your discipline | 177 | 57% |
| To share your research findings with the academic community | 146 | 47% |
| To improve your chances of receiving research funding | 95 | 30% |
| Your personal intrinsic motivation | 84 | 27% |
| To increase your chances to be promoted | 69 | 22% |
| To improve your standing among your peers | 55 | 18% |
| To help others (e.g. doctoral students, project collaborators...) | 54 | 17% |
| To increase your probability of finding a new position | 32 | 10% |
| To improve your standing in your current institution | 30 | 10% |
| To make your current position permanent | 26 | 8% |
| To increase the prestige and the resources allocated to your department | 23 | 7% |
| To improve the standing of your institution | 19 | 6% |
| To share your research findings with policymakers and practitioners | 18 | 6% |
| To fulfill project requirements | 16 | 5% |
| To fulfill administrative requirements | 16 | 5% |
| To get a monetary reward | 2 | 1% |
Table 9. Familiarity with calls to reform existing research evaluation practices. |
| Do you know…? (N = 263) | Yes, I know this | Yes, I have heard about this but do not know its content | No, I don’t know this | |||
|---|---|---|---|---|---|---|
| The DORA declaration | 27 | (10.3%) | 29 | (11.0%) | 207 | (78.7%) |
| The Leiden Manifesto | 25 | (9.5%) | 41 | (15.6%) | 197 | (74.9%) |
| Responsible metrics | 14 | (5.3%) | 42 | (16.0%) | 207 | (78.7%) |
| Metric Tide report | 7 | (2.7%) | 22 | (8.4%) | 234 | (89.0%) |
4.6 Results of the qualitative content analysis
Table 10. Keyword search analysis of four documents of recent research evaluation reform initiatives. |
| Initiative document | Number of times the keyword “heterogeneity” or “diversity” or “variety” or “multiplicity” or “dissimilarity” is present in the document |
|---|---|
| DORA declaration (DORA, 2015) | Variety 1 time cited (“6. Greatly reduce emphasis on the journal impact factor as a promotional tool, ideally by ceasing to promote the impact factor or by presenting the metric in the context of a variety of journal-based metrics”.) |
| Leiden Manifesto (Hicks et al., 2015) | No keywords cited |
| Hong Kong Declaration (Moher et al., 2020) | Variety 2 times cited but with a generic meaning of many not related to evaluation principles (“Selective publishing of research with positive results (i.e. publication bias) distorts science’s evidence base and has been demonstrated in a variety of disciplines including economics, psychology, and clinical and preclinical health research”; “The Center for Open Science’s Transparency and Openness Promotion initiative provides information on data transparency standards for a wide variety of discipline journals”.) Diversity 3 times cited (“We present five principles: responsible research practices; transparent reporting; open science (open research); valuing a diversity of types of research; and recognizing all contributions to research and scholarly activity”; “Some funders have already recognized the relevance of a broad range of research activities. The Research Impact Assessment Platform (Researchfish) works to capture some of this diversity and can generate reports on the impact of a broad spectrum of funded research”; “The HKPs do not address gender and other forms of diversity, inclusiveness, and related issues”.) |
| European Commission (2021) Scoping document | Variety 2 times cited (“Career assessment should take into account the variety of activities of academics such as teaching, research, entrepreneurship, management or leadership”; “To achieve excellent and relevant higher education, support is also needed to stimulate pedagogical innovation, focused on the learners, with a variety of learning spaces and flexible, interdisciplinary paths”.) Diversity 10 times cited (“Foster diversity, inclusiveness and gender equality”, “Develop a European framework for diversity and inclusion, including on gender gaps, identifying challenges and solutions for universities, and the needed support of public authorities”, “To encourage universities to implement institutional change through concrete measures for diversity and inclusion, including voluntary, quantified targets for inclusion and inclusive gender equality plans…”; “Universities are key to promote active citizenship, tolerance, equality and diversity, openness and critical thinking for more social cohesion and social trust, and thus protect European democracies”; “To support the diversity within the European higher education sector”; “The diversity and international standing of the EU education systems” the different types of higher education institutions are all hallmarks of our European way of life. This diversity is a strength, as it allows for choice and for creativity and synergy through mobility and cooperation”, “The European Union and Member States have a shared interest in supporting the higher education sector by joining their forces around a joint vision for the higher education sector, building on the richness of its diversity”; “Diversity, inclusiveness and gender equality in the higher education sector have become more important than ever”; “support universities as lighthouses of our European way of life:… 2) diversity and inclusion”.) |