

1 Introduction
With the rapid development of the economy and society, an increasing number of enterprises are engaging in technological innovation activities. Confronted with the complexities of research and development innovation and their own resource constraints, companies are gradually shifting their innovation strategies from self-reliance to open innovation. More organizations are embedding themselves in technology alliance networks, leveraging external heterogeneous resources to facilitate innovation and enhance economic performance (Thomaz & Swaminathan, 2015). Embedding in alliance networks is a critical strategic decision for companies to engage in cross-border resource searches, overcome technological barriers, and achieve significant technological breakthroughs. By collaborating with innovative entities within these alliance networks, including universities, research institutions, and other corporations, companies gain access to valuable knowledge spillovers (Jacob & Duysters, 2017). This integration and absorption of external resources and information can effectively compensate for their own limitations in the innovation process and ultimately enhance their innovation performance (Chakravarty et al., 2020).
Despite a wealth of research exploring the impact of alliance networks on firm innovation, conclusions remain inconsistent. Some studies indicate that firms gain significant innovation advantages within these networks, whereas others find that the influence of alliance networks on innovation is minimal (Cong et al., 2017; Han et al., 2020). This discrepancy has prompted a profound reflection within the academic community regarding the study of alliance networks. The primary reason for this inconsistency lies in the failure to consider the contextual differences in firm’s embedding within networks, as well as the essential distinctions in resource flow and knowledge acquisition among different types of networks. Such oversights have led to ongoing debates about the understanding of alliance networks’ effects on firm innovation.
Furthermore, the roles of network structure and network relationships, two classic dimensions of network embedding (Granovetter, 1985), are often conflated (Yan et al., 2020). Network structure typically refers to the connectivity patterns and location advantages among the nodes within the network, while network relationships emphasize the quality and trust level of the interactions between nodes. Although many studies have separately examined the impacts of these two dimensions on firm innovation, in fact, they do not operate in isolation. Structure embedding and relationship embedding jointly influence firm innovation outcomes. A firm’s innovative output is not only shaped by the structural characteristics of the network it occupies but also by the depth and quality of its relationships with other firms. This complex interplay makes the innovation process incapable of being explained through simple linear relationships. Therefore, investigating how to combine the characteristics of structures and relationships to examine their joint impact on firm innovation is a significant objective of this study.
Against this backdrop, this research aims to explore two key questions: First, what heterogeneous embedding types exist for firms within alliance networks from a social network perspective? Second, how do the structural and relational characteristics of firms within alliance networks jointly influence innovation? Specifically, this study examines how firms’ multidimensional network embedding characteristics interact under different network types and ultimately affect their innovation outcomes. By addressing these research gaps, this study seeks not only to provide new insights into the diversity of alliance networks and their impact on firm innovation but also to offer theoretical guidance and references for managers in effectively managing, constructing alliance networks, and selecting suitable strategic partners.
In this study, we propose a combined effects framework of network structure and relationships through an in-depth analysis of the existing literature and theories, establishing the theoretical foundation for our study. Our empirical analysis is based on joint patent application data from Chinese manufacturing firms, covering a dataset of 84,521 patents. This substantial data foundation allows us to comprehensively construct the alliance networks of firms and identify their relative positions and relationships within the network. To achieve this, we employ K-Means clustering techniques to identify the types of heterogeneous network embedding within the alliance networks. These embedding types not only reflect different strategies employed by firms in resource acquisition and utilization but also reveal variations in their innovative capabilities. Following the principle of “birds of a feather flock together,” firms with similar network topological structures are grouped into the same network type, resulting in the formation of four alliance network types: dyadic network, star network, ringlike network, and complex network. Building on this foundation, we utilized decision tree models to explore the interactions between structural and relational characteristics across diverse embedding types. This methodology enables a detailed analysis of how various structural and relational characteristics specifically impact firm innovation, thereby revealing their nonlinear relationships and interactive effects. Meticulous analysis not only aids in understanding how network characteristics influence firm innovation but also provides practical guidance for management, assisting firms in optimizing their alliance strategies in a dynamic market environment.
2 Literature review and theoretical foundation
2.1 Literature review
The relationship between alliance networks and firm innovation has been a prominent focus in both resource-based view (RBV) and social capital theory. According to the resource-based view, a firm’s access to heterogeneous and rare resources through its alliances can create sustained competitive advantages, which in turn promotes innovation performance (Barney, 1991; Teece, 1986). Firms embedded in alliance networks can leverage external resources and complementary capabilities from their partners to generate new knowledge, develop novel products, and improve operational efficiency (Ahuja, 2000). Coleman’s (1988) social capital framework posits that networks provide firms with social capital, trust, and collaboration opportunities, which are crucial for innovation. Firms benefit from their relational embedding in alliance networks, gaining access to information and resources otherwise unavailable through their internal capacities. Burt’s (1992) structural holes theory further supports the notion that firms occupying positions that bridge disconnected network nodes gain unique advantages, such as non-redundant information, which drives innovation. However, not all networks benefit firms equally—how firms are embedded structurally and relationally in their alliances matters significantly.
Network structure embedding is related to the location of enterprises in the network. Enterprises in the center of the network can have access to more information flow and knowledge sources, which helps them to identify and grasp market opportunities, so as to improve innovation performance (Coleman, 1988). First, through structural network embedding, organizations can improve their capacity to acquire heterogeneous knowledge (Yao et al., 2020). effective cross-boundary search and facilitates the integration of diverse knowledge backgrounds. These diverse knowledge reservoirs enrich firms’ innovative resources and create conditions for knowledge integration and major technological breakthroughs (Jin & Shao, 2022). Second, network embedding facilitates the establishment of bridges with distant innovation entities, expediting the dissemination of heterogeneous knowledge. By leveraging the structural advantages of network embedding, firms can overcome innovation obstacles and enhance the efficiency of resource allocation within the network (Chuluun et al., 2017).
However, the network embedding also hurts firm innovation (Huang et al., 2022; Uzzi, 1997). Network embedding might reinforce firms’ reliance on existing networks, leading to excessive dependence on local searches and resulting in repetitive and redundant information, hindering the acquisition of new knowledge. Additionally, maintaining relationships with alliance partners in the embedded network demands firms’ investment of time and resources, potentially diverting attention and resources away from other innovative endeavors and affecting the allocation of resources for other product developments (Jiang et al., 2018). From the perspective of social capital, the close ties among partners in alliance networks can foster high levels of trust, facilitating stable knowledge sharing and reciprocal cooperation. However, some scholars have found that the strength of cooperation between firms embedded in the network and other partners is negatively correlated with innovation efficiency (Broekel et al., 2015).
Some studies have discussed the possible synergistic effects between different forms of network embedding, suggesting that both structural and relational aspects jointly influence firm innovation. Schilling and Phelps (2007) argue that firms embedded in alliance networks with high clustering and short average path lengths tend to achieve greater innovation output than those in networks lacking these features. Ahuja (2000) highlights the mixed effects of network centrality, density, and connectivity on firm innovation, suggesting that while firms benefit from close collaboration, overly dense or overly central positions might limit access to diverse knowledge and stifle creativity. Similarly, Gargiulo and Benassi (2000) suggest that highly cohesive networks can lead to the homogenization of information, reducing innovative outputs. Bellamy et al. (2014) investigated the interaction between network reachability and network interconnectivity, two structural features in enterprise supply chain networks, which jointly impact firm innovation. Cheng et al. (2022) found that the synergistic effects of network centrality and relationship strength hinder firm innovation, while the synergistic effects of structural holes and relationship strength can promote firm innovation.
Moreover, existing studies have primarily focused on the level of firms’ embeddedness in alliance networks, overlooking the significance of the specific types of alliance networks they are embedded within (Zhang & Zhou, 2024). Although some scholars have categorized networks into industry-academia-research networks, industry-academia networks (Protogerou et al., 2013), and supplier networks based on firms’ cooperation with members from different alliance networks, these discussions merely address differences in the primary bodies of alliance cooperation without considering the diverse network environments or types in which the firms are situated. Large-scale networks are inclined to offer focal firms a wealth of knowledge heterogeneity and ensure ample resource support for innovation (Xie et al., 2016), whereas small-scale networks foster greater knowledge transfer efficiency, which is a key factor in achieving high-quality innovation breakthroughs (Dong et al., 2017). Hence, the manner in which firms embed themselves into alliance network environments that are compatible with their goals and choose suitable alliance partners has emerged as a prevalent area of academic interest.
Apart from the alliance network, there are other network modes based on technical cooperation, each serving a distinct purpose in fostering innovation (Morandi, 2013). The R&D exchanges among alliance members form the inventor’s cooperation network (Reck et al., 2022), while the linkage and combination of knowledge elements constitute the knowledge network (Wang et al., 2018). Furthermore, industry-university alliances and industry-university-research networks involve the collaboration and exchange of knowledge and resources among members with different innovation characteristics (Tian et al., 2022). The structural and relational characteristics of enterprises embedded in these diverse network types differ, thereby rendering the “black box” of network embedding’s influence on the intrinsic mechanism of enterprise innovation more intricate and multifaceted. A critical gap in the literature is the heterogeneity of network types and how different network structures influence a firm’s innovation performance. Traditional network studies often fail to distinguish the diversity of network configurations and their varying impacts on innovation. According to Wasserman and Faust (1994), network topologies such as centralization and clustering should be considered when analyzing network influence on innovation. Different network types exhibit distinct structural properties, leading to varying outcomes in terms of resource acquisition, knowledge sharing, and innovation capabilities.
In summary, the literature review reveals that while alliance networks undoubtedly influence firm innovation, their effects are complex and contingent on the network’s structure and relational attributes. The current study extends this research by classifying networks into distinct types and examining the combined effects of structural and relational embeddedness on innovation performance, addressing the existing gaps and providing a more comprehensive framework for understanding the impact of alliance networks on firm innovation.
2.2 Theoretical foundation
The resource-based view posits that a firm’s competitive advantage arises from its ability to acquire and manage heterogeneous resources, including tangible and intangible assets, organizational capabilities, and inter-firm relationships (Barney, 1991). Based on RBV, firms can enhance their innovation performance by optimizing and leveraging internal resources (Teece, 1986). Social capital, often embedded within network ties, provides a firm with access to essential resources such as knowledge, skills, and technological advancements (Coleman, 1988). In alliance networks, the firm’s embeddedness determines the quality and quantity of these resources and their effect on innovation outcomes (Lavie, 2006). From the perspective of the social network theory, a firm’s innovation performance is strongly influenced by its position within an alliance network and its relationships with other actors. Networks constitute an important channel for enterprises to obtain external complementary resources. Structural embeddedness, referring to the firm’s position in the network, plays a key role in facilitating resource exchanges and knowledge flows, contributing to higher innovation efficiency (Granovetter, 1985). Relational embeddedness, which pertains to the strength of relationships such as the intensity of cooperation and the breadth of collaborations, can further amplify these effects by fostering trust and repeated interactions (Uzzi, 1997).
However, the influence of network embeddedness on firm innovation is complex and may involve nonlinear and synergistic effects. Studies have shown that the impact of network structure and relational characteristics on innovation outcomes varies across firms, network types (Zhang et al., 2019) and network configurations (Reck et al., 2022). Existing research indicates that different firms exhibit diverse network embedding patterns, which can lead to varying innovation performance (Owen-Smith and Powell, 2004). This underscores the need to examine both the structural and relational dimensions of embeddedness simultaneously to capture their interactive effects.
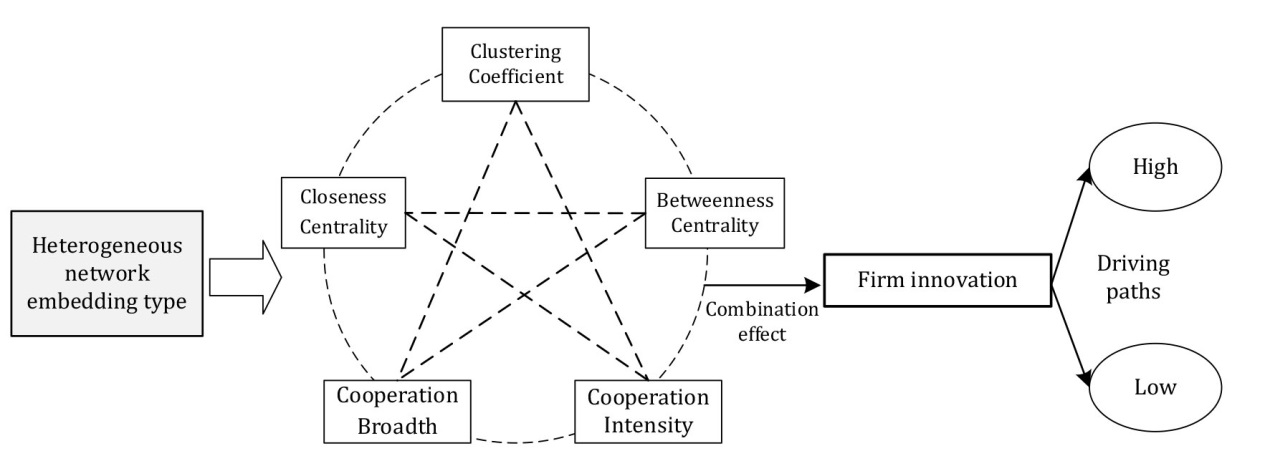
Drawing upon the RBV and social network theory, this study develops a multidimensional framework to explore how different types of network embeddedness, both structural and relational influence firm innovation performance. Inspired by Zhang et al. (2019), and Reck and Fliaster (2024), we categorize firms into different network embedding types based on their network topological features and investigate the combination effects of the network embeddedness characteristics on firm innovation. Furthermore, while structural and relational embeddedness each offer unique benefits, their combined effect is crucial for driving innovation. Firms with advantageous structural positions such as high closeness centrality, betweenness centrality, clustering coefficient can leverage these positions more effectively when they also maintain strong, high-quality relationships such as collaboration intensity and breadth with their partners. Building on these theoretical foundations, this study proposes the following hypotheses. The theoretical framework is shown in Figure 1.

Figure 1. Theoretical framework. |
H1: Firms within alliance networks exhibit heterogeneous embedding types, reflecting varying structural and relational characteristics.
H2: The interaction of network structural embeddedness including closeness centrality, betweenness centrality, clustering coefficient and relational embeddedness, including collaboration intensity and breadth exerts a combined effect on firm innovation performance.
Closeness centrality reflects how efficiently a firm can reach other members within the network, enhancing its ability to quickly access critical knowledge and resources, and accelerating innovation processes. Betweenness centrality positions a firm as a bridge between otherwise disconnected firms, allowing it to broker novel knowledge flows and serve as a conduit for innovative ideas. Clustering coefficient indicates how interconnected a firm’s partners are, fostering trust and cohesive collaboration, which facilitates knowledge-sharing and incremental innovation. On the relational side, cooperation intensity captures the strength and frequency of interactions between firms, enabling deep exchanges of knowledge and fostering trust, which are critical for coordinated high-quality innovation. Finally, cooperation breadth refers to the diversity of a firm’s partners, allowing it to access varied knowledge bases, thereby increasing the likelihood of breakthrough or radical innovation. Together, these five variables create a multidimensional framework that integrates both the structural and relational dimensions of network embeddedness, showing how firms can optimize their network positions and relationships to drive superior innovation outcomes.
3 Research design
3.1 Data and source
The data in this study were sourced from the joint patent applications of listed Chinese industrial companies collected from the Incopat database. Patent data are particularly suitable for this study because of their effectiveness in measuring firms’ innovation activities. Patents reflect tangible outputs of technological innovation, allowing for a direct assessment of firms’ innovation performance. On one hand, patents serve as the legal representation of a company’s technological innovations, quantifying and characterizing specific technological advancements. Compared to other forms of innovation, such as business model innovation or managerial innovation, patents offer greater operational and measurable advantages, making them especially suitable for analyzing technological innovation performance. On the other hand, the information derived from joint patent applications can directly reveal the technological alliance relationships between firms. This feature positions patent data as an ideal source for academic research on corporate alliance networks. It enables the construction of technological alliance networks among firms and facilitates the analysis of how the embedding characteristics within these networks influence innovation performance.
A total of 84,521 patents were collected from listed companies in the Chinese manufacturing industry between 2005 and 2020. Each patent includes information fields such as “Number of applicants”, “Number of claims”, “Patent citations”, “Patent cited” and “Authorization status”. To construct the alliance cooperation network of enterprises, only the data entries with the patent applicant type classified as “enterprise” and where the number of patent applicants was greater than or equal to two were retained. Patents with incomplete information were excluded. If two companies apply for a patent simultaneously, the two companies are connected with edges to form a network relationship. After this screening, a final dataset of 25,489 patent documents was obtained, encompassing a total of 2,159 distinct enterprises. Relevant variables in this study were calculated with the help of Ucinet software, which lays the data foundation for the subsequent data analysis.
3.2 Variables
Firm innovation performance (PE) refers to the outcomes and effects of a company on its innovation activities. These outcomes are typically reflected in areas such as new product development, improvements in production processes, enhanced market competitiveness, and increased economic benefits. PE is a vital indicator of a company’s innovation level and effectiveness, often measured by the number of patents, and is the most commonly used proxy in the field of innovation management. However, traditional research often relies solely on patent quantity to assess innovation performance, viewing patents as legal acknowledgments of technological outputs that reflect a firm’s R&D capabilities. This approach, although prevalent, has limitations, as the sheer number of patents does not comprehensively capture their actual value and quality. Some patents may be applied for opportunistic or strategic reserves, failing to directly indicate a company’s innovation impact or market competitiveness.
To provide a more comprehensive assessment of innovation performance, an increasing number of scholars are emphasizing the quality of patents. This study integrates both patent quantity and quality, using the average patent quality per firm as a metric for innovation performance, conducted in two steps.
Step 1: Assessing patent quality. Based on existing research, numerous indicators can reflect patent quality. In this paper, we consider five aspects to characterize patent quality: technological breadth, technological impact, technological scope, knowledge base, and practical utility. We operationalize these dimensions using the following indicators.
Claims: The count of claims indicates the breadth of legal protection afforded to the patent’s technological aspects. An elevated number of claims typically suggests a wider technological ambit covered by the patent, signifying superior patent quality (Grimaldi & Cricelli, 2020).
Patent citations: The frequency of forward citations reflects the patent’s technological influence and its significance. A patent extensively cited by subsequent patents is deemed to exert a constructive effect on its respective domain (Alcácer & Gittelman, 2006).
IPC numbers: The International Patent Classification System provides a uniform framework for classifying the technological fields of patents (Zhou & Li, 2024). The number of four-digit IPC codes reveals the breadth of technological knowledge encompassed by the patent, indicating the diversity of the technological domains it spans.
Non-patent literature citations: The volume of non-patent literature citations provides evidence of a patent’s underlying knowledge base. A patent that incorporates references to non-patent literature is predicated on a comprehensive knowledge foundation, further attesting to its quality (Cammarano et al., 2017).
Authorization status: The authorization status (1 or 0) of a patent, signifying its examination and approval, generally reflects its practical utility and legal robustness. Patents that have been authorized are likely to exhibit higher quality (Li et al., 2020).
Step 2: Weighted average of patent quality. To measure innovation performance, the quality of patents is averaged with appropriate weights. The significance of different patent quality indicators in evaluating innovation performance may vary, and there may be overlaps or redundancies among certain indicators (Zhang et al., 2017). This study further employs the coefficient of variation method to weight the patent quality indicators, thus reducing information redundancy in the composite measure. The calculation formula is as follows:
$P E=\frac{1}{N} \sum_{k=1}^{N}\left(w_{1} * q_{k 1}+w_{2} * q_{k 2}+w_{3} * q_{k 3}+w_{4} * q_{k 4}+w_{5} * q_{k 5}\right) $
qkj is the j-th quality metric of the k-th patent for a company, and wj(j=1,2,3,4,5) represents the weight of the j-th quality indicator, which is calculated by using the the coefficient of variation method, that is
$w_{j}=\frac{\sqrt{\frac{1}{N-1} \sum_{k=1}^{N}\left(q_{k j}-\bar{q}_{j}\right)^{2}}}{\frac{1}{N} \sum_{k=1}^{N} q_{k j}} $
This approach ensures that the weights reflect both the reliability and the significance of each indicator, accommodating the differences in scale and variability. The sum of all weights across the metrics Equals 1. To facilitate understanding of the measurement process and significance of this indicator, we have created a conceptual diagram illustrating the measurement approach for firm innovation performance. This diagram also contrasts our methodology with the traditional practice of using patent quantity as a proxy for innovation performance. In this study, the calculated weights were 0.20, 0.24, 0.21, 0.19, and 0.16, respectively, as illustrated in Figure 2.
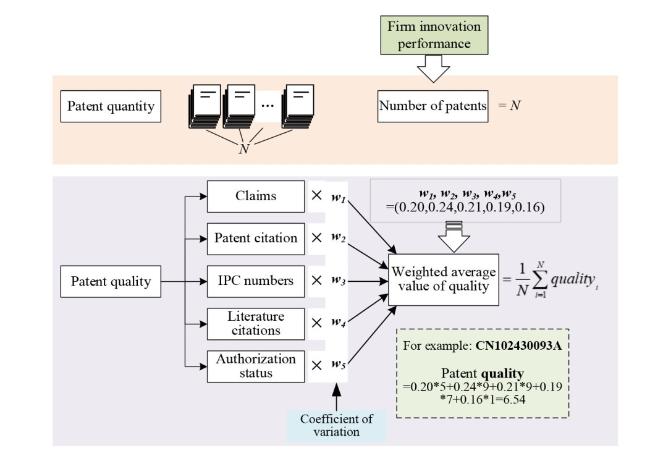
Figure 2. The calculation of firm innovation performance. |
For the explanatory variables, this study primarily considered two dimensions: structural embeddedness and relational embeddedness. The former includes the structural characteristics of the network, such as betweenness centrality, closeness centrality, and clustering coefficient. Relational embeddedness encompasses two relational features, that are cooperation intensity and cooperation breadth.
Betweenness centrality (BC) reflects the degree to which a firm acts as a broker or intermediary between other firms in the network (Zhang & Zhou, 2024). Firms with high betweenness centrality control critical paths of information flow and are often positioned to capture novel ideas and technologies from different parts of the network. This central position allows them to create more innovative combinations of knowledge (Burt, 1992). It is measured by the ratio of the number of shortest paths passing through a specific node to the number of actual shortest paths between any two nodes:
$B C_{i}=\sum_{s, t \in I} \frac{\sigma_{s t}(i)}{\sigma_{s t}}$
σst denotes the number of shortest paths between nodes s and t, and σst(i) represents the number of shortest paths passing through focus i.
Closeness centrality (CC) measures how quickly a firm can access other nodes in the network. Firms with high closeness centrality have more direct access to valuable information and resources from a larger pool of network members. This positioning enhances their ability to innovate by accelerating knowledge acquisition and responding to changes in the competitive environment (Freeman, 1979). The closeness centrality of the i-th nodal firm in the alliance network is calculated as:
$C C_{i}=\frac{M-1}{\sum_{j \neq i} \operatorname{dist}(j, i)} $
where dist(j,i) is the shortest path between the nodes i and j, M denotes the total number of nodes within the network.
Clustering coefficient (CL) refers to the extent to which a firm’s network partners are interconnected. A high clustering coefficient indicates that a firm is part of tightly knit subgroups, promoting trust and frequent collaboration. This enhances firms’ capacity for incremental innovation through close cooperation and shared expertise (Guan et al., 2015). It is calculated as:
$C L_{i}=\left\{\begin{array}{l} \frac{2 e_{i}}{k_{i}\left(k_{i}-1\right)}, k_{i}>1 \\ 0, k_{i} \leq 1 \end{array}\right. $
where ki denotes the number of cooperators that as directly connected to the focal firm i. ei represents the edge numbers of other nodes that are connected to the firm i.
The knowledge and resources that a firm can acquire within an alliance network are not solely determined by its network embedded structure, but also influenced by the level of relationship embeddedness with other partners (Huggins & Thompson, 2017). Specifically, the cooperation intensity (CI) represents the average frequency of interactions between firms and their partners in the alliance network. It directly affects the efficiency and quality of a firm’s access to external knowledge resources. When the exchange and communication between firms and other innovative organizations are more frequent, the average number of cooperative interactions increases. This fosters a deeper understanding of the firm’s own technological knowledge required for R&D and the resource endowments of its partners. On the other hand, cooperation breadth (CB) refers to the number of partners an enterprise collaborates with. It reflects the diversity of partners within the alliance. Along with the degree centrality in the network structure, CB serves as a proxy indicator of partner diversity. In this study, the ratio of the number of joint patents filed by an enterprise to the total number of partners is used to measure the CI in the alliance network, and the number of non-repeated partners is used to quantify its CB.
3.3 Methods
3.3.1 Social network analysis
Social network analysis (SNA) is widely utilized in innovation management research to examine network topology and the dynamics of collaboration (Casanueva et al., 2013). In this study, the enterprise alliance cooperation network is modeled as an undirected weighted network, where the nodes represent individual firms, and the edges signify collaborative relationships. The edge weights denote the frequency of cooperation between firms, reflecting knowledge flow within the network. High edge weights indicate frequent cooperation, suggesting strong ties and enhanced knowledge mobility between firms. SNA techniques allow us to compute network indicators, such as centrality, which reflect the strategic position of firms in the network and the mechanism of social capital exchange. These metrics are critical for analyzing how firms leverage their network position to innovate.
3.3.2 K-Means clustering and decision tree model
In this study, we employ two widely-recognized yet traditional methods, K-Means clustering and the Classification and Regression Tree (CART), to enhance the analysis. Despite being labeled as traditional, these methods remain effective in network analysis and have seen extensive use in social science research due to their flexibility and interpretability (Kohtamaki et al., 2020). K-Means clustering is used to classify firms based on their network embedding characteristics, facilitating the identification of heterogeneous groups within the data. By grouping firms with similar network structures and environments, this method uncovers underlying patterns, adhering to the principle of “birds of a feather flock together”. The resulting clusters represent firms with similar levels of network embeddedness, and this step serves as a foundation for deeper analysis of firm innovation. And the CART model, is a decision tree-based classification method, is applied to identify the combination effects of various network embedding conditions on firm innovation. CART operates by recursively partitioning the data, using the Gini coefficient to create decision rules. Internal nodes in the decision tree represent the network factors, while leaf nodes indicate the final classification outcomes, categorized as high or low levels of firm innovation performance. CART is particularly suited for detecting complex, nonlinear relationships among network factors, enabling us to extract key combinations of variables that influence innovation outcomes (Zhou & Li, 2023). By applying this method, this study gains insight into the conditional effects of network structure and relational factors on firm innovation performance.
4 Data analysis results
4.1 Data description
To prevent the interference of outliers in the original sample with the results of the data analysis, we applied a trimming technique, removing extreme values in the upper and lower 1% tails while retaining the sample size. This step effectively cleansed the data for outliers. Additionally, we computed the Pearson correlation coefficients between each variable and the basic descriptive statistics for each variable, as shown in Table 1. The results revealed that the clustering coefficient exhibited the strongest correlation with innovation performance, with a correlation coefficient of -0.547. Furthermore, the correlation coefficients between all other variables were also below 0.6. Moreover, we calculated the variance inflation factors and found that all the results were below 2, far less than 10. Therefore, we can conclude that there is no presence of multicollinearity.
Table 1. Descriptive statistics and correlation analysis results. |
| Mean | Std | Median | MIN | MAX | PE | CB | CI | BC | CC | CL | |
|---|---|---|---|---|---|---|---|---|---|---|---|
| PE | 2.462 | 0.758 | 2.436 | 0.917 | 4.472 | 1.000 | |||||
| CB | 2.715 | 3.190 | 2.000 | 1.000 | 20.000 | -0.272*** | 1.000 | ||||
| CI | 6.784 | 15.000 | 2.000 | 0.285 | 104.28 | -0.067*** | 0.115*** | 1.000 | |||
| BC | 0.0004 | 0.002 | 0.000 | 0.000 | 0.011 | 0.053* | 0.586*** | 0.045* | 1.000 | ||
| CC | 0.035 | 0.036 | 0.012 | 0.000 | 0.100 | -0.067** | 0.270*** | 0.002 | 0.340*** | 1.000 | |
| CL | 0.328 | 0.438 | 0.000 | 0.000 | 1.000 | -0.547*** | 0.205*** | -0.077*** | -0.101*** | 0.172*** | 1.000 |
Note: * indicates p<0.05, ** indicates p<0.01, ***indicates p<0.001. |
4.2 Heterogeneous alliance network type division
The K-Means method was employed to cluster the overall topological features of the alliance network, including network size, network density, average path length, average clustering coefficient, and network diameter. This classification aimed to group all node firms into different network embedding scenarios. To determine the optimal number of clusters, the elbow algorithm was used to calculate the average distortion degree of the feature data for various numbers of clusters, ultimately settling on four clusters for classification.
Firms belonging to the same cluster demonstrate high similarity in terms of network connectivity, cooperation patterns, and the alliance environment. Conversely, firms in different clusters exhibit greater differences in these respects. These alliance network embedding contexts were labeled as dyadic alliance network, star alliance network, ringlike alliance network, and complex alliance networks based on the visualized topology of the alliance network, as depicted in Figures 3-6, respectively.
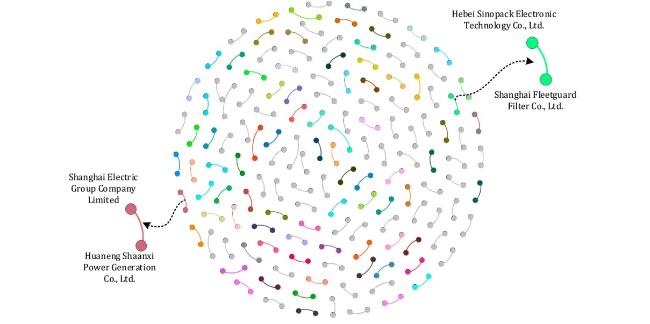
Figure 3. Dyadic alliance network. |
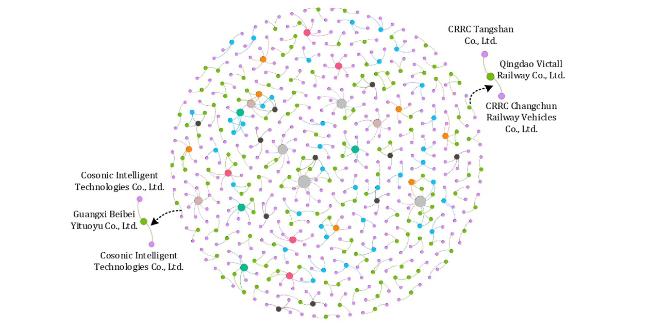
Figure 4. Star alliance network. |

Figure 5. Ringlike alliance network. |
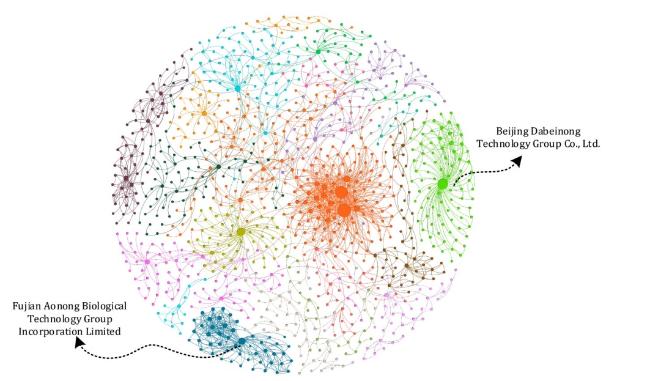
Figure 6. Complex alliance network. |
In the dyadic network, each innovation entity forms a partnership with only one other entity, resulting in a relatively simple and direct cooperation path. Examples of this type of network can be seen in cases like Hebei Sinopack Electronic Technology Co., Ltd. and Shanghai Fleetguard Filter Co. Ltd., where they have a one-to-one alliance partnership.
In the star network, one of the prominent features is the presence of at least one core node in each sub-alliance group. These core nodes are crucial for the survival and functioning of the smaller groups within the alliance network. For instance, Cosonic Intelligent Technologies Co., Ltd. could potentially be one of the core nodes in this type of network.
In the ringlike network, there is a high degree of interconnectivity between partners, and the network nodes interact with each other to create a balanced structure. In this type of network, there is no clear presence of a single dominant core node. Examples of this type of network can be seen among some medium-sized and small enterprises that are closely connected in their cooperation.
In a complex network, the cooperation links between enterprises are highly intricate, and the network has the largest number of nodes among all alliance types. Some leading enterprises may play a significant leading role in this type of network. An example of a company that might play such a role in the complex alliance network is Beijing Dabeinong Technology Group Co., Ltd.
The machine-learning-based division of alliance network embedding types provides a more nuanced and sophisticated approach compared to traditional simple classifications based on size or ownership. By using K-Means method, enterprises with similar cooperative tendencies and cooperative resources are grouped together in the same alliance network embedding environment, while those in different clusters exhibit greater discrepancies, effectively ensuring the relevance and objectivity of the enterprise performance improvement strategy. Table 2 presents the relevant network characteristics information of the heterogeneous alliance network embedding types. Among these types, the complex alliance network embedding is the most common, with up to 1,017 enterprises (approximately 47.11% of the total sample) embedded in this type.
Table 2. Basic network indicators of heterogeneous alliance network embedding types. |
| Type | Communities | Nodes | Average cluster coefficient | Average path length | Density | Average degree | Maximum diameter |
|---|---|---|---|---|---|---|---|
| Dyadic network | 140 | 280 | 0.000 | 1.000 | 0.004 | 0.500 | 1.000 |
| Star network | 120 | 553 | 0.238 | 1.784 | 0.003 | 0.855 | 5.000 |
| Ringlike network | 60 | 309 | 0.875 | 1.560 | 0.011 | 1.618 | 3.000 |
| Complex network | 16 | 1,017 | 0.636 | 6.116 | 0.004 | 1.986 | 15.000 |
The use of machine learning methods to identify and categorize alliance network embedding types allows researchers and practitioners to gain a deeper understanding of the diverse patterns of network relationships among firms. By considering the unique characteristics and interactions within each type, enterprises can develop more targeted and effective strategies to enhance their innovation performance and achieve sustainable competitive advantages.
4.3 Decision rules analysis
The CART method was employed in this study to construct four decision models for heterogeneous alliance networks and extract crucial decision rules. The five dimensions of network features CC, BC, CL, CI, and CB are used as conditional factors in the decision tree model. The firm innovation performance PE as the decision factor is divided into two states based on whether it is higher or lower than the mean value. By employing this data-driven approach, this study aims to explore the reasons for the differences in firm innovation performance under various conditions or combinations of conditions.
To avoid infinite growth and overfitting of the decision tree, this study introduces two important rule judgments, support and confidence, to filter more representative condition combination rules. Support reflects the percentage of samples supporting a particular conditional combination, while Confidence indicates the credibility of that conditional combination rule for the classification of innovation performance status. After decision tree modeling for data from four different alliance network embedding contexts, key decision rules were extracted, which are shown in Table 3. The extracted decision rules play a crucial role in helping us understand the significant impact of different network features on enterprise innovation performance in various alliance network embedding contexts.
Table 3. Crucial decision rules for various alliance network types. |
| Network type | Conditional factor | Criteria | Decision factor | |||||
|---|---|---|---|---|---|---|---|---|
| CB | CI | CC | CL | BC | Support | Confidence | PE | |
| Dyadic network | - | <=25.5 | - | - | - | 62.86% | 0.66 | High |
| - | >25.5 | - | - | - | 4.29% | 1.00 | Low | |
| Star network | - | - | <=0.002 | <=0.367 | 45.39% | 0.70 | High | |
| - | - | - | >0.367 | - | 7.23% | 0.80 | Low | |
| Ringlike network | - | <=2.583 | - | <=0.367 | - | 4.21% | 0.65 | Low |
| - | (2.583,14] | - | <=0.367 | - | 8.74% | 0.77 | High | |
| - | >14 | - | <=0.367 | - | 3.88% | 1.00 | Low | |
| - | - | - | >0.367 | - | 69.57% | 0.89 | Low | |
| Complex network | - | - | - | <=0.339 | - | 38.54% | 0.69 | High |
| - | >2.45 | - | >0.339 | - | 8.85% | 0.67 | Low | |
| >2.50 | <=2.45 | - | >0.339 | - | 20.16% | 0.97 | Low | |
When firms are embedded in a dyadic alliance network, only cooperation intensity plays a role in identifying the difference between high and low states of firm performance, suggesting that in simple dyadic cooperation, the main determinant of a firm’s innovation performance stems from relational embedding. When the cooperation intensity is lower than 25.5, the enterprise is likely to show high performance. Whereas the cooperation intensity is too high (greater than 25.5) and leads to low performance status with 100% Confidence level, indicating that lower cooperation intensity favors innovation performance in simple partnerships. This may be due to the fact that these firms with too few partners prefer to engage in R&D and innovation activities independently, and this ability to innovate on their own and freedom from partner decision-making helps firms to break away from cooperation dependence and make innovation decisions quickly, thus promoting innovation performance.
When firms are embedded in a star alliance network, the clustering coefficient is the main factor affecting their innovation performance. The combination of conditions that drive firms to achieve high performance are “CC<=0.002” and “CL<=0.367”. This suggests that in a star-shaped alliance network with core leadership nodes, a greater distance from the central firm may be more conducive to the generation of high-quality innovations, preventing them from being homogenized by leadership firms and falling into simple imitative innovations. This is consistent with the results of existing theories that, according to center-edge theory, organizations at the edge are more creative. At the same time, too congenial a cooperative atmosphere (CL>0.367) may cause firms to fall into an innovation dilemma and external dependence, imitating too much the innovation behaviors and decisions of other partners within the alliance network, leading to low-quality innovation output.
When firms are embedded in a ringlike alliance network, the clustering coefficient is still the main factor that distinguishes high and low performance levels, and there is only one combination of conditions that leads to high innovative performance, which is “CL<=0.367, 2.583<CI<=14”, and the confidence level for low performance is as high as 100% when the CI is higher than 14. This suggests that there is an “inverted U shape” relationship between cooperation intensity and firm innovation performance in a group of firms with low aggregation coefficients, which may be due to the fact that resource mobility is relatively high in a ringlike alliance network, and the node firms are more likely to acquire heterogeneous knowledge from different partners. However, too high a cooperation intensity may lead to excessive resource sharing and interdependence, limiting the independent innovation ability of node firms. A high aggregation coefficient may limit the ability to access external non-redundant resources, which is also not conducive to the realization of high-quality product innovation by manufacturing firms.
In the complex alliance networks, cooperation intensity, cooperation breadth and clustering coefficient are identified as key factors that play an important role in firms’ innovation performance. When the CL meets a specific threshold condition (CL<=0.339), firms’ innovative performance is categorized as “High”. This implies that innovation performance is likely to be higher when firms are less tightly connected, which echoes the weak relationship theory. Actually, weak relationships have the advantage of information control over strong relationships, which avoids the transfer of redundant resources in the network. In addition, smaller CL implies more partners, and this diversified structure can bring richer knowledge to the focal firms, which can contribute to the generation of high-quality innovations. When the clustering coefficient is high (CL>0.339), both high cooperation intensity and cooperation breadth are detrimental to innovation performance, and the Confidence level that firms’ low PE reaches 97% in the joint conditions of low cooperation intensity (CI<=2.45) and (CB>2.5). This indicates that, despite the fact that nodal firms have a larger number of partners, the poor quality of the cooperative relationship may also make it difficult to promote the sharing and integration of knowledge resources in the alliance network, limiting the improvement of innovation performance.
Therefore, H1, which posits that firms are embedded in multiple heterogeneous types of alliance networks, is confirmed. The analysis identified four distinct network types: dyadic networks, star networks, ringlike networks, and complex networks. Each of these network structures exhibits unique characteristics and influences on firm innovation, supporting the claim of network heterogeneity.
For the hypothesis H2, which suggests a combined effect of structural and relational embeddedness on firm innovation performance, the results show varying degrees of support depending on the network type. In the dyadic network, only cooperation intensity affects firm innovation negatively, with no significant interaction between network structure and relational characteristics. The lack of combined effects in this network type indicates that Hypothesis 2 is not supported for dyadic networks. This can be explained by the weak tie theory (Granovetter, 1985), which argues that in simple and sparse connections, relational embedding dominates, and structural embedding has limited impact. In contrast, for star networks, ringlike networks, and complex networks, Hypothesis 2 is supported. These networks reveal a combination of both structural and relational factors that influence firm innovation.
4.4 Robustness test
Furthermore, this study re-examines and explores the combination effects between the variables using two other decision tree models, ID3 and C4.5. The key decision rules extracted from the tree models regarding the four-alliance network embedding types are found to be consistent with previous research findings. Additionally, we replace the random seed to construct the decision model, and the obtained network type divisions and decision rule extractions show no significant differences, indicating the robustness of the combination effects uncovered in this study. The robustness test results are shown in Tables A1 to A3 in Appendix 1.
5 Conclusions and discussion
5.1 Conclusions
In this study, we constructed an alliance cooperation network among different technological innovation entities based on joint patent applications. The social network analysis method was used to extract relevant network topological structures. Through K-Means clustering and decision tree method, we conducted in-depth analysis of the alliance network embedding mechanisms, heterogeneous network types, and key rules influencing firm innovation performance. Compared with traditional empirical research on the linear relationship between alliance networks and firm innovation, our findings are more comprehensive and specific, providing important strategic references for relevant innovation entities in terms of technology alliance network embedding and partner selection. This study also contributes to a deeper understanding of the relationship between alliance network embedding and innovation outcomes and provides practical implications for firms seeking to leverage their network advantages to enhance innovation capabilities and achieve competitive advantages in the market. The following conclusions were drawn.
First, the contextual embedding of enterprises within the alliance network exhibits a plethora of variations, and the mechanisms for elevating innovation performance manifest notable disparities across different network embedding environments. Notably, there exists heterogeneity among enterprises in diverse alliance networks, which has already been substantiated to potentially affect firm innovation (Zhao et al., 2020). Hence, when scrutinizing the alliance network structure and its impact on innovation outputs, requisite attention and differentiation are necessary (de Leeuw et al., 2014). This study, based on machine learning methods, has probed the heterogeneity of enterprise embedding contexts within the alliance network, delineating them into four categories: dyadic alliance, star alliance, ringlike alliance, and complex alliance. Furthermore, this study has provided crucial insights for recognizing network diversity in the era of open innovation, thus enriching and extending network embedding theory.
Second, the structural and relational characteristics of the alliance network play distinct roles across different network contexts. Within the dyadic alliance network, only network relationships exhibit a negative correlation with enterprise innovation performance. This phenomenon might arise from the fact that autonomous innovation and research and development endeavors are more conducive to high-quality innovation outputs, while strong cooperation may foster opportunistic behaviors in the manufacturing industry. In the star alliance network, being distant from the central enterprise and overly intimate cooperative relationships also hinder the improvement of innovation performance. In a ringlike alliance network, under the low clustering coefficient structure, the relationship between cooperation intensity and innovation performance follows a “inverted-U” shape, where excessive relationship investments may deplete enterprises with greater innovation costs (Park et al., 2014). On the other hand, in complex alliance networks with abundant heterogeneous social capital, focusing solely on enhancing cooperation breadth or intensity is detrimental to enterprise innovation. Weak relationships serve as the key to high-quality innovation in enterprises.
Third, combination effects exist between structural features, relational features, and firm innovation within the alliance network. The relationship between network drivers and corporate innovation is not monolithic and linear (Zhou & Li, 2024). Especially in ringlike and complex alliance networks, the interplay between the network structure and network relationships jointly determines the state of enterprise innovation performance. This suggests that the structure and relationships within the alliance network are not simply superimposed, but rather interact and combine with each other. Enterprises need to select the optimal combination of structure and relationships based on network type to leverage the positive impact of network embedding on innovation. This might enrich and refine network embedding theory, providing valuable insights for enterprises to formulate innovation strategies tailored to different alliance networks.
The theoretical contributions of this study are as follows. First, by employing data-driven analysis methods, this research successfully distinguishes the contextual differences in alliance network embedding, providing valuable insights into the analysis of network embedding heterogeneity. Through this approach, this study opens new avenues for exploring the diverse aspects of network embedding and its implications on firm innovation. Second, the study introduces a comprehensive framework for analyzing the multifaceted mechanisms influencing corporate innovation. This novel framework facilitates the exploration of nonlinear relationships and combination effects between different levels of network embedding and innovation performance. By adopting this approach, this study uncovers the intricate interplay of factors that impact innovation outcomes, enabling a deeper understanding of the dynamic relationships between firms’ embeddedness in alliance networks and their ability to achieve innovative excellence.
5.2 Managerial implications
Based on the findings of this study, several managerial implications are proposed to assist enterprises in achieving effective innovation decision making and alliance partner selection.
First, it emphasizes the heterogeneity of the alliance network context. Different alliance network types, with distinct network structures and relationships, have varying impacts on firm innovation. When deciding to participate in alliance cooperation, enterprises should carefully assess their resource endowments, and cooperation needs to select the most suitable alliance environment. In a dyadic alliance network, focal enterprises rely primarily on their autonomous innovation capabilities to achieve high-quality innovation. In a star alliance network, caution should be exercised to avoid simple imitative innovation and excessive reliance. In a ringlike alliance network, moderate cooperation intensity can ensure that enterprises have enough autonomy and energy to explore diverse knowledge. Meanwhile, in a complex alliance network, enterprises should place greater emphasis on enhancing cooperation quality to ensure effective resource integration, thereby facilitating high-quality technological innovation.
Second, proactively balance relationships with alliance partners. In both star and ringlike alliance networks, moderate cooperation intensity can facilitate knowledge flow and resource sharing, while excessively high or low cooperation intensity may have negative effects on innovation performance. Similarly, maintaining a moderate clustering coefficient is crucial for ensuring sustained autonomous innovation for focal enterprises. Overly harmonious cooperative environments may limit the independent thinking ability and resource integration efficiency of the company. In a complex alliance network, enterprises should prioritize the improvement and balance of cooperation quality, as excessive cooperation intensity or breadth can also lead to a decline in innovation performance. Enterprises should be flexible in responding to the needs and changes of their partners and maintain openness and inclusivity towards different opinions to foster a healthy atmosphere among partners, ultimately achieving long-term competitive advantage.
Third, it is actively embedded into the alliance cooperative network environment. Enterprises should proactively choose alliance types that align with their needs and strategic goals. By participating in alliance networks, enterprises can access more resources, knowledge, and collaboration opportunities, leading to improved innovation performance. Relevant government departments can formulate policies and regulations that encourage and support business alliance cooperation, such as providing fiscal and tax incentives to reduce cooperation risks, promoting resource sharing as well as knowledge transfer. Additionally, reducing market barriers and offering alliance platforms can foster collaboration and the establishment of alliance relationships.
5.3 Future research
While this study makes significant contributions to understanding the relationship between alliance network embedding and firm innovation, it is essential to acknowledge certain limitations that pave the way for future research. One key area for exploration is the generalizability of our findings beyond the manufacturing sector. The reliance on patent data, although effective for measuring innovation performance, may not fully capture the complexities of innovation across different industries. Future studies could benefit from incorporating diverse data sources, such as service-oriented innovations or digital transformations, which could provide a broader context and validate the applicability of our conclusions across various sectors.
Furthermore, this study introduces a novel metric for measuring enterprise innovation performance, focusing on both the quantity and quality of patent applications. However, this metric can be further enriched by integrating additional dimensions of innovation performance such as the success rate of new product launches or customer feedback on innovation. Future research could explore these aspects to develop a holistic understanding of innovation outcomes.
Funding information
This work was supported by the National Social Science Fund of China (No. 22FGLB035), and Fujian Provincial Federation of Social Sciences (No. FJ2023B109).
Author contributions
Zhiwei Zhang (zw-zhang@cueb.edu.cn; ORCID: 0009-0002-3100-2407): Writing - Review & Editing; Validation.
Wenhao Zhou (wenhaoz2021@stu.hqu.edu.cn; ORCID: 0000-0001-9421-8526): Conceptualization; Formal analysis; Writing - Original Draft.
Hailin Li (hailinl@hotmail.com): Methodology; Funding acquisition.
Declaration of interests
The authors report no potential conflicts of interest.
Data availability
Data will be available on request from the authors.
Appendix 1
Table A1. Crucial decision rules by using ID3 model. |
| Network type | Conditional factor | Criteria | Decision factor | |||||
|---|---|---|---|---|---|---|---|---|
| CB | CI | CC | CL | BC | Support | Confidence | PE | |
| Dyadic network | - | <=25.5 | - | - | - | 62.86% | 0.66 | High |
| - | >25.5 | - | - | - | 4.29% | 1.00 | Low | |
| Star network | - | - | <=0.001 | <=0.371 | 48.05% | 0.72 | High | |
| - | - | - | >0.371 | - | 7.03% | 0.85 | Low | |
| Ringlike network | - | <=2.59 | - | <=0.371 | - | 4.02% | 0.66 | Low |
| - | (2.59,13.65] | - | <=0.371 | - | 9.12% | 0.72 | High | |
| - | >13.65 | - | <=0.371 | - | 3.59% | 1.00 | Low | |
| - | - | - | >0.371 | - | 60.35% | 0.90 | Low | |
| Complex network | - | - | - | <=0.339 | - | 44.37% | 0.68 | High |
| - | >2.45 | - | >0.339 | - | 7.34% | 0.72 | Low | |
| >2.50 | <=2.45 | - | >0.339 | - | 17.22% | 0.95 | Low | |
Table A2. Crucial decision rules by using C4.5 model. |
| Network type | Conditional factor | Criteria | Decision facor | |||||
|---|---|---|---|---|---|---|---|---|
| CB | CI | CC | CL | BC | Support | Confidence | PE | |
| Dyadic network | - | <=23.5 | - | - | - | 60.16% | 0.70 | High |
| - | >23.5 | - | - | - | 5.29% | 0.98 | Low | |
| Star network | - | - | <=0.002 | <=0.371 | 40.05% | 0.77 | High | |
| - | - | - | >0.371 | - | 8.33% | 0.81 | Low | |
| Ringlike network | - | <=2.580 | - | <=0.371 | - | 4.55% | 0.69 | Low |
| - | (2.580,13.65] | - | <=0.371 | - | 6.04% | 0.75 | High | |
| - | >13.65 | - | <=0.371 | - | 3.88% | 0.98 | Low | |
| - | - | - | >0.371 | - | 68.85% | 0.85 | Low | |
| Complex network | - | - | - | <=0.343 | - | 35.25% | 0.68 | High |
| - | >2.45 | - | >0.343 | - | 7.55% | 0.71 | Low | |
| >2.50 | <=2.45 | - | >0.343 | - | 18.29% | 0.94 | Low | |
Table A3. Crucial decision rules by replacing random seed (random_state=32). |
| Network type | Conditional factor | Criteria | Decision factor | |||||
|---|---|---|---|---|---|---|---|---|
| CB | CI | CC | CL | BC | Support | Confidence | PE | |
| Dyadic network | - | <=25.5 | - | - | - | 62.86% | 0.66 | High |
| - | >25.5 | - | - | - | 4.29% | 1.00 | Low | |
| Star network | - | - | <=0.002 | <=0.367 | 45.39% | 0.70 | High | |
| - | - | - | >0.367 | - | 7.23% | 0.80 | Low | |
| Ringlike network | - | <=2.583 | - | <=0.367 | - | 4.21% | 0.65 | Low |
| - | (2.583,14] | - | <=0.367 | - | 8.74% | 0.77 | High | |
| - | >14 | - | <=0.367 | - | 3.88% | 1.00 | Low | |
| - | - | - | >0.367 | - | 69.57% | 0.89 | Low | |
| Complex network | - | - | - | <=0.339 | - | 38.54% | 0.69 | High |
| - | >2.44 | - | >0.339 | - | 8.52% | 0.68 | Low | |
| >2.50 | <=2.44 | - | >0.339 | - | 20.53% | 0.97 | Low | |