

1 Introduction
With the rise of the fourth research paradigm based on data-intensive computing, technological innovations have emerged, and productivity has rapidly developed. Science and technology have become important sources driving economic growth and industrial revolution. Consequently, there have been significant qualitative changes in the breadth and depth of researchers’ knowledge innovation methods. The development process driven by knowledge-based innovation increasingly relies on the exploration and expansion of existing academic achievements, making data-driven knowledge discovery more crucial (Funkner et al., 2022). Early identification and assessment of emerging trends (Tamakloe & Park, 2023) will help researchers quickly focus on research objectives, develop research plans, and technological roadmaps, thus significantly saving their efforts. Simultaneously, it also forms a crucial aspect of strategic planning and academic guidance by research management departments (Ebadi et al., 2022; Yang et al., 2022).
The unique scientific and technological innovation system of the United States drives the development of the American economy and society. This technological innovation system begins with the federal government’s investment in research and development. The National Science Foundation (NSF) is one of the important components (Bozeman & Youtie, 2017; Hauptmann, 2022). On June 22, 2023, NSF’s newly established Directorate for Technology, Innovation, and Partnerships (TIP) launched the Assessing and Predicting Technology Outcomes (APTO) program, which will fund research projects to identify key R&D directions that will enable the nation to win the future. The program aims to provide policymakers with models and information, predicting future outcomes for specific technologies, and determining investments that will reliably change or accelerate those outcomes. The ultimate goal is to optimize NSF-supported efforts and improve U.S. competitiveness in the long term.
Assessing and predicting scientific and technical results plays an important role in optimizing funding effects (Aranda-Michel et al., 2022; Baerwald et al., 2016; Gibson et al., 2019). However, there are certain differences between scientific and technological evaluation and prediction, necessitating further in-depth research in this area. The research content of funds, especially national funds, with the characteristics of being forward-looking, innovative, and leading, represents the highest level in certain domestic disciplines and is reviewed and recognized by top experts in the field. Therefore, to a certain extent, each national fund may play a leading role in the development of the subject field, encompassing potential and future emerging trends and directions.
Currently, all countries worldwide place significant emphasis on scientific and technological innovation. Utilizing data such as funds, papers, and patents to predict emerging trends is a fundamental undertaking in advancing scientific and technological innovation. Numerous researchers have proposed effective methods for predicting emerging trends, but much of the existing research relies on individual paper or patent data. Despite the continuous updates to methods and indicators, there are certain errors and lags in emerging trend prediction results due to the limitations of relying on a single data source. To address this issue, some scholars have commenced using fund data or comprehensively integrating information from funds, papers, and patents to predict emerging trends (Mejia & Kajikawa, 2020; Ye et al., 2023). Nonetheless, these studies often analyze all data collectively or merely compare different data outcomes. The lack of research concerning the evolution of topic associations, knowledge transfer, and the mechanisms of interaction between diverse data sources restricts the accuracy and scientific rigor of emerging trend prediction results, particularly in understanding the interplay among funds, papers, and patents. Therefore, delving deeper into their mutual influence is essential and merits thorough exploration.
Hence, the objective of this study is to tackle the challenge of predicting emerging trends and unveil the hysteresis effect of the correlation evolution between research topics in funding and their funding papers. The findings from this research will serve as a vital reference for evaluating the effectiveness of fund assistance and related work.
In the subsequent sections, we will delve into the study. Section 2 provides a comprehensive review of relevant literature and related studies. In Section 3, we present the data and methods utilized in our research. Following this, Section 4 presents the research results. Finally, in Sections 5 and 6, we engage in a detailed discussion and draw conclusions based on our findings.
2 Related research
This section primarily conducts a comprehensive literature review on emerging trend prediction and the associated evolution of funds and thesis topics. The main objective is to synthesize the existing research progress and identify prevailing deficiencies in emerging trend prediction. Subsequently, we examine the correlated evolution of funds and thesis topics from both theoretical and practical standpoints. By exploring relevant research, this study aims to offer a reference and theoretical foundation for its own investigation. Furthermore, this exploration will lead to the identification of new research questions, perspectives, and directions that necessitate further in-depth exploration.
2.1 Emerging trend prediction
Scientific and technological literature data, including funds, papers, and patents, encompass a vast array of research topics that provide insights into the trajectory of science and technology development, thereby offering the possibility of predicting emerging trends (Porter & Detampel, 1995; Zhang et al., 2013). Currently, numerous scholars have explored the prediction of emerging trends in science and technology, classifying these efforts into two main types: qualitative and quantitative approaches. With advancements in computer technology, quantitative methods such as bibliometrics (Huang et al., 2021; Prabhaa et al., 2020; Shibata et al., 2011; Xu, Winnink et al., 2021), topic models (Xu, Hao et al., 2021), and neural networks (Liang et al., 2021) have gained significant traction in emerging trend prediction-related research. Within this realm, there are two critical directions, namely emerging topic identification and topic trend prediction. For instance, Nichols (2014) employed topic models to identify emerging research topics within grant text data from the National Science Foundation (NSF) and analyzed interdisciplinary issues. Small et al. (2014) proposed an emerging topic identification method that combines direct citation and co-citation analysis to screen emerging topics, and evaluated the results through awards. Zhang et al. (2016) introduced a topic trend prediction model to forecast the future development trends of topics based on funding, academic cooperation, and industrial investment characteristics. Lu et al. (2022) utilized the new MeSH terminology to identify emerging topics, classifying them into four different modes: emergence and persistence, emergence and discontinuity, emergence and fluctuation, and not yet emerged. Additionally, using Structural Topic Modeling (STM), they explored primary research topics concealed within existing AV-related research literature, examined their evolution over time, and identified topics highly relevant to developing and developed economies. Furthermore, Gozuacik et al. (2023) leveraged the Word2Vec model to learn vocabulary representation in literature data as word vectors. Then, they calculated semantic distances between words based on the LSTM model to predict how specific words would evolve over time, successfully achieving the goal of emerging topic prediction.
In general, emerging trend prediction methods are closely tied to computer algorithm models, exhibiting evident algorithmic model-driven characteristics. These models effectively enhance the efficiency and accuracy of emerging trend predictions. However, the majority of existing research relies on a singular data source, be they funds, papers, or patents. Despite continuous updates and iterations of method models and indicators, the predictions are still subject to certain errors and lags due to the limitations of using only one type of data. Therefore, the direction of predicting emerging trends by comprehensively utilizing funds, papers, or patents holds promise and is worth exploring. With diverse integrated data sources, researchers can potentially overcome the limitations of researches with individual datasets, leading to more robust and accurate emerging trend predictions.
2.2 The evolution of the relationship between funding and topics of papers
Popper (1972) highlighted the striking similarity between the development of knowledge and the evolution of organisms. Objective knowledge progresses and evolves through unnatural, non-spontaneous, or artificial selection, exhibiting characteristics like inheritance, variation, and recombination. In terms of topic evolution, scientific development involves a continuous emergence of new research topics and the gradual disappearance of old ones, as well as the intersection and integration of various research topics. Scientific and technological documents, such as funds, papers, and patents, serve as the primary carriers of scientific knowledge. The textual content, including keywords and topics, contained within these documents dynamically correlates and evolves with the advancement of the scientific field. In the short term, the structure of scientific knowledge tends to be stable, with research overall experiencing relatively stable and gradual development, accompanied by the appearance, correlation, and disappearance of a small number of new words and topics. In the long term, the basic model of scientific development involves the emergence, development, and maturity of knowledge, along with dynamic processes of extinction. This can be likened to the dynamic evolution process of research topics (Hu et al., 2019; Savin, 2023; Wang et al., 2022).
In the development of a specific subject field, the research topics found in scientific and technological documents, such as funds and papers, represent scientific knowledge recently produced in that subject field and garner the attention of researchers. These topics do not emerge from thin air but rather result from the intersection, integration, and extension of previous research content. As a result, many researchers are currently exploring emerging trend prediction from the perspective of topic evolution, drawing on data from funds, papers, and patents. To overcome the limitations of single data sources, researchers are increasingly attempting emerging trend prediction based on multi-source data. For example, some researchers are using paper data to address the hysteresis problem in identifying emerging trends, thus enhancing the forward-looking value of emerging trend prediction results. Others are utilizing fund project data to identify research frontier topics and employing evolution visualization methods to analyze the development trends of these frontier topics (Ye et al., 2023).
It is evident that predicting emerging trends from the perspective of the correlation evolution between funds and paper topics conforms to the fundamental pattern of scientific development. Although there have been studies on predicting emerging trends by integrating multiple sources of data, such as funds, papers, and patents, these studies have not taken into account the interconnections between different datasets and the mechanisms of transmission, evolution, diffusion, and interaction among different topics. In the current era of big data and large models, conducting comprehensive analyses of data such as funds, papers, and patents has emerged as a crucial direction for predicting emerging trends. However, effectively performing such comprehensive analysis remains a challenge to be addressed. It is imperative to explore the interrelationship and interaction laws between different data sources, which is vital for predicting emerging trends with comprehensive datasets that encompass funds, papers, and patents (Liu et al., 2018). Understanding these interconnections can significantly enhance the accuracy and forward-looking value of emerging trend predictions.
3 Research questions and methodological framework
3.1 Research questions
Research Question 1 (RQ1): Does an evolutionary relationship exist between the funding topic and the topic of papers supported by that research grant?
From the perspective of system theory (Bailey, 2006), funds and the research papers they sponsor constitute integral components of the scientific system, forming relatively independent scientific innovation systems in specific disciplines, such as humanities and social sciences. Among these, funding plays a crucial role in guiding and promoting paper publications. Funders typically take into account emerging trends in scientific research and cutting-edge hot issues to direct researchers towards specific topics for investigation. By securing funding, researchers can obtain greater financial support to delve deeply into specific topics, leading to the generation of numerous research papers within related fields and thereby fostering the development of those disciplines. Simultaneously, the topics of supported papers can also influence the development and adjustment of funding priorities. For instance, as research progresses and new discoveries or unresolved problems emerge from papers, they may attract the attention of funding agencies, potentially influencing the selection and implementation of subsequent funding topics. Based on system theory and recognizing the direct impact of funds on their supported papers, we propose the following assumptions.
Research Hypothesis 1 (H1): There exists an evolutionary relationship between funds and the topics of the papers they sponsor.
The relationship between the topic of the fund and the topic of the supported paper can be viewed as a scientific innovation system characterized by mutual feedback and mutual influence. This system undergoes continuous evolution over time, impacting the funding topic. Through this reciprocal feedback relationship, the funding topic and the topic of the supported paper can influence and interact with each other within the system, evolving in a correlated manner over time to address ever-changing scientific problems (Giannopoulos & Munro, 2019). As the feedback within the system requires time to manifest, this study raises another critical research question.
Research Question 2 (RQ2): Does a hysteresis effect exist in the evolution of the relationship between the funding topic and the topic of the papers supported by that research grant?
In a system where various elements influence and interact with each other, there is often a time delay between changes and responses. Understanding and correctly predicting the dynamics of the constituent topics within the system requires careful consideration of the hysteresis effect. Hence, we propose the following hypothesis.
Research Hypothesis 2 (H2): The funding topic and the topic of papers supported by that research grant exhibit a hysteresis effect in their associated evolution process.
Several factors contribute to the hysteresis effect observed in the evolution of the relationship between the funding topic and the topic of papers supported by that research grant. Institutional reasons play a significant role, as the process of fund application, approval, and subsequent publication of relevant papers adheres to specific institutional procedures, leading to inherent delays in their impact on each other. Additionally, knowledge flow factors influence the transformation of research topics within a particular field. As research topics evolve based on existing knowledge, it becomes a gradual process. The flow and transfer of knowledge between the fund and its supported papers also necessitate a certain amount of time, resulting in a hysteresis effect in the changes of research topics between the two. Together, these factors contribute to the hysteresis effect in their associated evolution.
3.2 Method framework
The methodological framework developed in this study aims to comprehensively understand the evolution of the relationship between the topic of funding and the topic of its supported papers. It seeks to uncover the development trends, changes in content, and hysteresis effects between these topics. Based on topic identification and association construction, this research will analyze the hysteresis effect of the association evolution between the funding topic and the topics of its supported papers from two dimensions: topic popularity and topic content. Initially, the research will identify the research topics present in the fund and its supported papers, along with their implicit associations. Subsequently, it will calculate the correlation and time-lag characteristics of the association evolution between the funding topic and its supported paper topics, considering both topic popularity and topic content dimensions. This will allow us to reveal the hysteresis effect in the association evolution between the funding topic and its supported paper topics.
The research method comprises four distinct sub-steps, as illustrated in Figure 1 below:
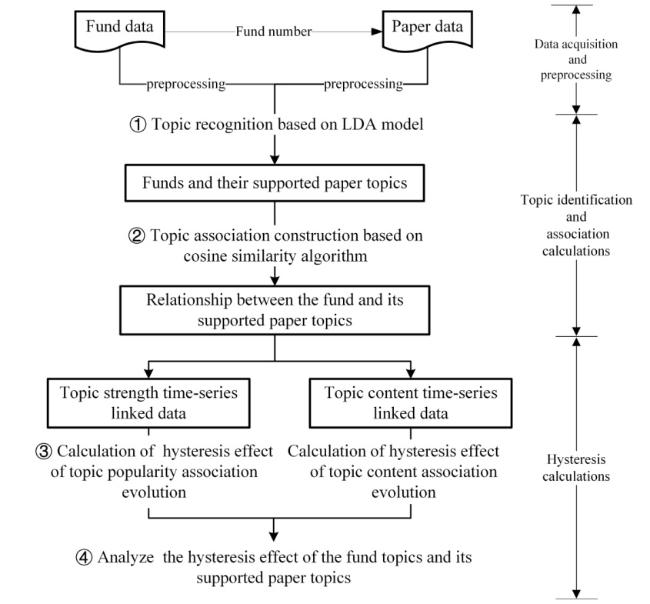
Figure 1. Method and procedure. |
Step 1: Topic recognition based on LDA model. In this step, research topics present in the fund and its supported papers are identified by using the Latent Dirichlet Allocation (LDA) model.
Step 2: Topic association construction based on cosine similarity algorithm. This step involves employing the cosine similarity algorithm to measure the relationship between the topics of the fund and its supported papers.
Step 3: Calculation of the hysteresis effect of topic content and topic popularity association evolution. Next, in this step, the correlation and time-lag characteristics of the time series data for the fund’s topic and the topics of its supported papers are computed by using the Pearson correlation coefficient.
Step 4: Analyze the hysteresis effect of the fund topics and its supported paper topics. In this step, the correlative relationship and time-lag characteristics of the topic evolution for both the fund and its supported papers are determined by using an evolution visualization method.
By integrating the findings from these four steps, the study aims to comprehensively summarize and analyze the hysteresis effect of the research topic between the fund and the topics of its supported papers.
3.2.1 Data source
This study utilizes research data consisting of funds awarded by the Division of Social and Economic Sciences of the National Science Foundation and papers associated with the corresponding fund numbers in the Web of Science database. The data spans from January 1, 2013, to December 31, 2022. To obtain the fund data, official records from the National Science Foundation website of the United States are downloaded and processed. Relevant data, especially the fund data supported by the Department of Social and Economic Sciences, is analyzed, merged, and converted. For the paper data, the Web of Science database is accessed. An advanced search method is employed to construct a search formula based on the fund number supported by the Department of Social and Economic Sciences. Subsequently, the search is executed to collect the data of papers supported by the corresponding grant. After downloading and eliminating duplicates, a total of 4,013 grants from the Department of Social and Economic Sciences of the National Science Foundation of the United States were identified, along with 8,400 papers supported by these grants. During the data collection process, we first retrieved historical grant data (in XML format) from the official website of the National Science Foundation (https://www.nsf.gov/awardsearch/download.jsp). These data were parsed, merged, and reformatted to filter out projects funded by the Division of Social and Economic Sciences (SES) between January 1, 2013, and December 31, 2022, yielding 4,013 funded projects. Subsequently, repetitive search queries were constructed using SES grant numbers (e.g., FG=1401525 OR FG=1407691 OR FG=1411204 OR FG=1414342...). These queries were executed via the Web of Science database’s advanced search interface, and bibliographic records of grant-supported papers (in XLS format) were exported, resulting in 8,400 papers linked to the corresponding funding awards.
3.2.2 Topic recognition based on LDA model
The LDA model (Blei et al., 2003) not only enables the prediction of topic distribution for documents in the training set but also effectively predicts the topic distribution for documents and words in the non-training set. This makes it one of the most powerful models for analyzing large-scale unstructured document sets. In this study, the LDA model is employed to identify the topics of the fund and its supported papers. The optimal number of topics is determined using consistency scores, perplexity indicators, and manual interpretation (Azzopardi et al., 2003; Hagen, 2018; Newman et al., 2010). To describe the topic distribution of the document and the word distribution of the topic, hidden variables are introduced into the LDA model. This results in the modeling of the document corpus as a probability model, where the joint distribution probability represents the probability distribution relationship in the LDA model. The specific formula for the joint distribution probability is as follows (as shown in Formula 1).
$p(\varphi, \theta, z, w \mid \alpha, \beta)=\prod_{k=1}^{K} p\left(\varphi_{k} \mid \beta\right) \cdot \prod_{d=1}^{D}\left[p\left(\theta_{d} \mid \alpha\right) \cdot \prod_{n=1}^{N_{d}} p\left(z_{d, n} \mid \theta_{d}\right) \cdot p\left(w_{d, n} \mid \varphi_{z_{d, n}}\right)\right]$
The latent variables ϕ (phi) and θ (theta) represent the word distributions for all topics and the topic distributions for all documents, respectively generated via Dirichlet distributions. The variable z denotes the topic assignments for each word in the documents, while the observed variable w corresponds to the actual words in the text. The hyperparameters α and β control the sparsity of the document-topic distributions and topic-word distributions, respectively. Additional symbols include K (topics), D (documents), and Nd (number of words in document d).
3.2.3 Topic association construction using cosine similarity algorithm
The most direct relationship between the fund and its supported paper topics lies in the similarity of their topic content. Since the fund and its supported paper topics are represented by several topic words obtained from the LDA model, it is possible to measure the degree of overlap between the topic terms of the fund and its supported papers. This facilitates the construction of a correlation path in the time dimension.
In this study, the topic recognition results are treated as short texts. Given that the cosine similarity algorithm (Moehrle, 2019) is known for its precise calculation results and is suitable for handling short texts, we utilize the cosine similarity algorithm to calculate the similarity between the topics of the fund and its supported papers. This enables us to construct association relationships. The cosine similarity calculation method for any fund and its supported paper topics, represented as k and k′, is shown in formula (2).
$\operatorname{Sim}\left(k, k^{\prime}\right)=\frac{\sum_{\mathrm{v}=1}^{\mathrm{V}} \varphi_{k, v} \cdot \varphi_{k^{\prime}, v}}{\sqrt{\sum_{\mathrm{v}=1}^{\mathrm{V}} \varphi_{k, v}^{2} \cdot \sum_{\mathrm{v}=1}^{\mathrm{V}} \varphi_{k^{\prime}, v}^{2}}}$
Among them, k represents the topic, ϕ (phi) denotes the word distribution of the topic, and v represents the number of words, the numerator represents the dot product of two topic vocabulary vectors, which measures the degree of alignment or similarity between the vectors. The denominator represents the product of the magnitudes of the two topic vocabulary vectors.
3.2.4 Calculation of the hysteresis effect of topic popularity correlation evolution
This study utilizes the Pearson correlation coefficient (Bermudez-Edo et al., 2018; Salleh et al., 2015) to assess the hysteresis effect of the topic popularity time series between the fund and its supported papers. Specifically, the popularity of the fund and its supported papers’ topics is calculated under different lag time windows to determine the magnitude of correlation in their time series. This helps in identifying the lag period when the fund topic significantly influences the paper topic: if the time series of the fund topic’s popularity and the paper topic’s popularity with a lag of N years have the highest correlation, it indicates that the fund topic has the greatest impact on the paper topic with a significant effect lag period of N years.
In this study, Topic Popularity is calculated by combining the number of topic-related documents and the average probability distribution of topics. Specifically, for each topic k, the number of related documents is calculated, and the average probability of the topic across documents is computed. The raw popularity is obtained by multiplying the number of documents for each topic by its average probability. Finally, the raw popularity is normalized using Min-Max normalization. Here, the number of topic-related documents measures the prevalence of a topic across the entire document collection. If many documents are associated with a particular topic, it indicates that the topic has broad coverage and may be a mainstream or trending subject. The average probability distribution of topics measures the focus of a topic within the document collection. A high average probability suggests that, in the documents where the topic appears, it occupies a significant proportion, indicating that the documents are more focused on that topic. The specific calculation method for Topic Popularity is detailed in formulas (3) and (4).
$\operatorname{RawPopularity}(k)=\operatorname{DocCount}(k) \cdot \operatorname{AvgProb}(k)=\sum_{d=1}^{D} I\left(\arg \max \left(\theta_{d}\right)=k\right) \cdot \frac{1}{D} \sum_{d=1}^{D} \theta_{d, k}$
$\operatorname{Popularity}(k)=\frac{\operatorname{RawPopularity}(k)-\min (\text { RawPopularity })}{\max (\text { RawPopularity })-\min (\text { RawPopularity })}$
Among them, k represents the topic, θ(theta) denotes the topic distribution of documents, and d represents a document.
The specific method for calculating the time series correlation of the topic popularity between the fund and its supported papers is as follows: Let’s assume that there are two time series, X and Y, which respectively represent the time series of fund topic popularity and the time series of supported paper topic popularity. The number of data points in each time series is n.
First, calculate the mean of each of the two time series:
$\text { mean_X }=(\mathrm{X} 1+\mathrm{X} 2+\ldots+\mathrm{Xn}) / \mathrm{n}$
$\text { mean_Y }=(\mathrm{Y} 1+\mathrm{Y} 2+\ldots+\mathrm{Yn}) / \mathrm{n}$
Then, calculate the standard deviation of each of the two time series:
$\text { std_X }=\operatorname{sqrt}\left(\left((\text { X1-mean_X })^{2}+(\text { X2-mean_X })^{2}+\ldots+(\text { Xn-mean_X })^{2}\right) / n\right)$
$\text { std_Y }=\operatorname{sqrt}\left(\left((\text { Y1-mean_Y })^{2}+(\text { Y2-mean_Y })^{2}+\ldots+(\text { Yn-mean_Y })^{2}\right) / \mathrm{n}\right)$
Then, calculate the covariance between the two time series:
$\begin{array}{l} \operatorname{cov}_{-} X Y=((X 1-\text { mean_X }) \times(Y 1-\text { mean_Y })+(X 2-\text { mean_X }) \times(Y 2-\text { mean_Y }) \\ +\ldots+(X n-\text { mean_X }) \times(Y n-\text { mean_Y })) / n \end{array}$
Finally, calculate the Pearson correlation coefficient between the two time series:
$\text { person_cor }=\mathrm{cov}_{-} \mathrm{XY} /(\text { std_X } \times \text { std_Y })$
Among them, the finally calculated Pearson correlation coefficient, pearson_cor, is a value between -1 and 1, representing the degree of linear correlation between the two time series, X and Y. A value close to 1 indicates a strong positive correlation, while a value close to -1 indicates a strong negative correlation between the two time series.
3.2.5 Calculation of hysteresis effect of topic content association evolution
In the preceding step, the hysteresis effect of the correlation evolution between the topic of the fund and its supported papers was measured by using the Pearson correlation coefficient. Building upon this, this section will determine the direction and proportion of the correlation evolution between the two entities under various lag time windows. Additionally, it will analyze the hysteresis effect of the topic association evolution between the fund and its supported papers from a specific content dimension. Using an evolution visualization method, this study will create topic content association evolution path maps for different time lag windows, as depicted in Figure 2.

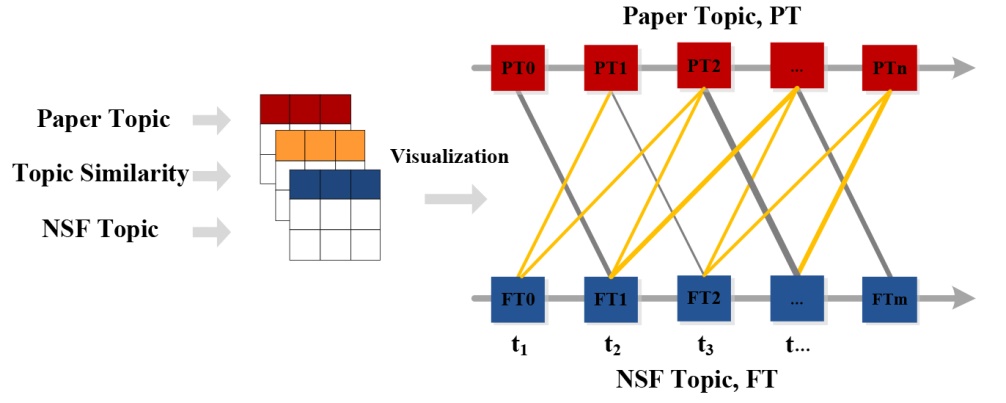
Figure 2. Visualization illustration of subject content association evolution. |
Symbol definition: Let t={t1, t2, t3...tn} represent the annual time window of the topic distribution of the fund and its supported papers, where n is a positive integer belonging to the set n∈{1, 2, 3... }. The collection of paper topics is denoted as PT= {PT0, PT1, PT2…PTn}, and the collection of fund topics is denoted as FT={FT0, FT1, FT2…FTm}, where m is a positive integer belonging to the set m∈{0, 1, 2...}.
In Figure 2, the horizontal axis represents the time window t. The red rectangle represents the topic of the paper, while the blue rectangle represents the topic of the fund. The lines connecting the fund and its supported research paper topics represent evolutionary paths. Specifically, the evolutionary path from fund topics to paper topics is indicated by yellow lines, while the evolutionary path from paper topics to fund topics is shown by gray lines. The thickness of the lines is proportional to the calculated topics similarity results. The evolution visualization method proposed in this study enables the visualization of the related evolution paths of the fund and its supported paper topics under different time lag windows. It assists in revealing the direction and proportion of their related evolution under various lag time windows. By combining these results with the hysteresis effect of the correlation evolution of the topic popularity of supported papers from the previous step, the hysteresis effect of the correlation evolution between the fund and its supported paper topics can be analyzed from the perspectives of topic popularity and topic content.
4 Result analysis
4.1 Topic identification results
After data preprocessing, including case conversion and stop word filtering, the LDA model was applied for topic identification. The optimal number of topics for the fund and its supported paper topics was determined through a comprehensive evaluation using coherence scores, perplexity scores, and manual interpretation, as shown in Figure 3. The specific process is as follows: Firstly, we plotted the relationship curves between the number of topics and metrics such as coherence score and perplexity by calculating these metrics for different numbers of topics (ranging from 2 to 20, with a step size of 2). The coherence score is used to measure the semantic consistency of topics, while the perplexity metric is employed to evaluate the model’s fit to the data. We selected a range of candidate topic numbers that exhibited high coherence scores and low perplexity. On this basis, we conducted a semantic interpretability assessment of the topics generated within this range of candidate topic numbers through manual review. Ultimately, we determined the optimal number of topics for the fund and research paper. A total of 22 topics were identified, consisting of 7 fund topics and 15 paper topics.
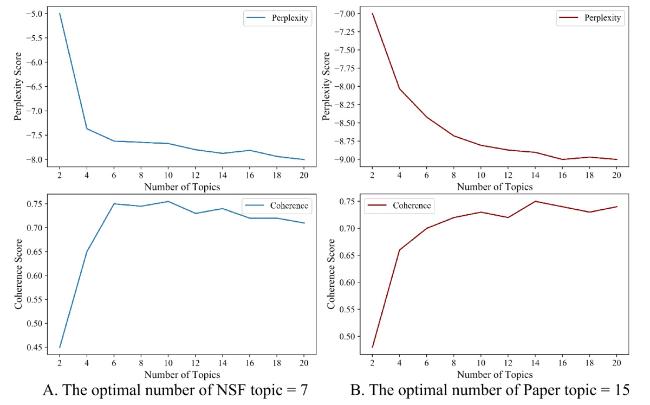
Figure 3. Determination of the number of topics. |
The results of topic identification were visualized by using the complex network analysis tool Gephi to create the topic word network of the fund and its supported papers, as shown in Figure 4.
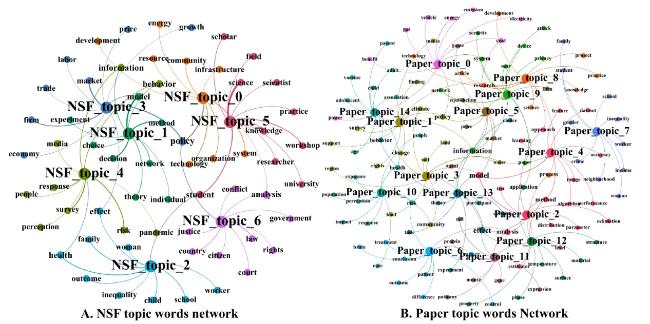
Figure 4. Topic recognition. |
In Figure 4, subgraph A represents the network of fund topic words, while subgraph B shows the network of topic words of papers. The size of the nodes in the figure is proportional to the centrality of the nodes, and the color of the nodes is based on the results of topic identification. The layout of the nodes follows the Fruchterman Reingold layout algorithm (Fruchterman & Reingold, 1991).
4.2 Topic association construction results
The research method involved converting the fund and its supported paper topics into short texts (topic vectors) and then utilizing the cosine similarity algorithm to calculate the similarity between the two. This allowed for the construction of the topic correlation between the fund and its supported papers, as depicted in Figure 5. Figure 5A represents the heatmap of the topic similarity between the fund and its supported papers, while Figure 5B shows the network diagram of the topic words. Community detection was performed on this association network by using the Louvain algorithm, effectively grouping topics with high degrees of association into unified communities.
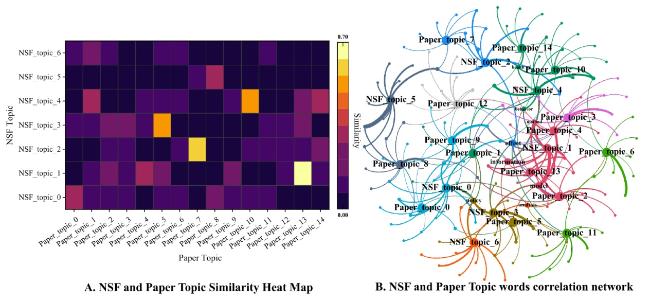
Figure 5. Topic association construction. |
Upon analyzing Figure 5, it becomes evident that there is a high degree of correlation between certain fund and paper topics. For instance, NSF_topic_1 and Paper_topic_13, NSF_topic_2 and Paper_topic_7, and NSF_topic_4 and Paper_topic_10 show strong correlations. Additionally, a comparison between the results of sub-graphs A and B reveals that topics with higher correlation degrees occupy more central positions in the association network. For instance, NSF_topic_1 and Paper_topic_13, classified as the same community in Figure 5B, hold a central position in the network. This finding further validates the accuracy of the topic association construction results of the fund and its supported papers. The community structure of Figure 5B, delineated by the Louvain algorithm, exhibits a high degree of consistency with the topic similarity distribution in the heatmap of Figure 5A (as exemplified by NSF_topic_1 and Paper_topic_3 belonging to the same core community). Its accuracy is manifested on two levels: at the data level, the heatmap directly quantifies and displays the high similarity in vocabulary content among core topics; at the structural level, network centrality metrics demonstrate that core topics possess hub characteristics that span across communities. This indicates that community clustering and core node analysis can authentically map the knowledge association pathways between research funding and outcomes, thereby validating the effectiveness of the topic network construction.
4.3 The hysteresis effect of the topic popularity dimension
Using the Pearson Correlation Coefficient (PPC), this study computes the correlation between the time series of funds and their supported paper topics across various lag time windows. By identifying the lag period with the highest correlation, we obtain the maximum correlation coefficient and the corresponding lag period that signifies the significant effect of the funding topic on the supported paper topic. This analysis allows us to pinpoint the time delay during which the impact of the fund’s topic on the paper’s topic is most pronounced.
The specific calculation method is demonstrated by using NSF_topic_0 and Paper_topic_0 as examples, as illustrated in Figure 6. Through the computation, we find that when the lag period is 2, the correlation value between NSF_topic_0 and Paper_topic_0 is 0.28. Therefore, we shift the NSF_topic_0 time series to the right by 2 time windows to obtain the Linear Shift 2 time series. At this point, the trend of the Linear Shift 2 time series becomes more synergistic with the Paper_topic_0 time series, as indicated by the largest correlation coefficient value. Based on this observation, we can deduce that the significant impact of NSF_topic_0 on Paper_topic_0 occurs with a lag period of 2 years.
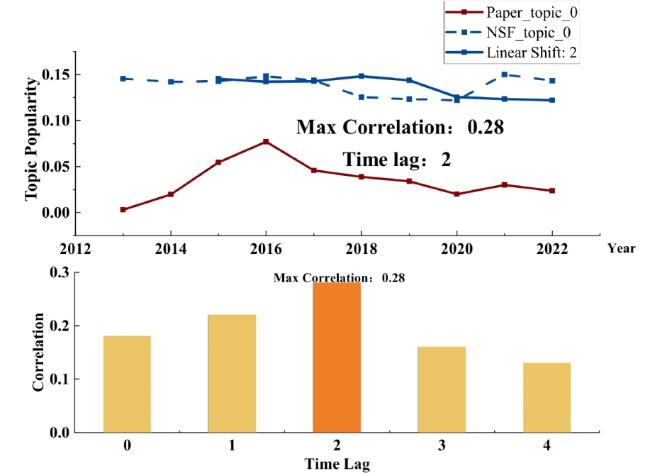
Figure 6. Calculation example of topic popularity time series correlation coefficient. |
Following the procedure depicted in Figure 6, we calculate the correlation coefficients of all funding topics and their corresponding topic popularity time series at various time lag windows.
In the specific processing procedure, to ensure the accuracy of the results, this study conducted time series stationarity tests and detrending processes. All time series variables were subjected to the Augmented Dickey-Fuller (ADF) unit root test. For non-stationary series, a linear regression method was employed to remove trends. After detrending, the ADF test was reapplied to ensure that the processed series met the stationarity requirements. All subsequent analyses were based on the detrended data to avoid spurious correlation interference. When calculating correlation coefficients, p-values were simultaneously computed, and Fisher’s z-test was used to verify the significance of the maximum lag. Statistically significant results were marked with (*) in the visualizations. Some of the results are shown in Figure 7 below.
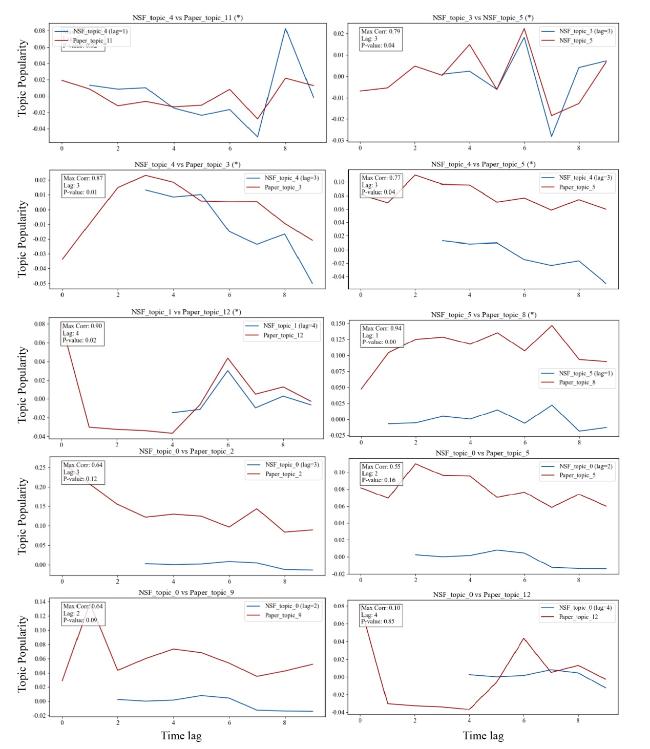
Figure 7. Topic popularity time series maximum correlation coefficient and its lag period. |
Figure 7 presents the time series of topic popularity for the fund and its supported papers, along with the maximum correlation coefficient and its corresponding lag period, with statistically significant results marked with (*). It can be observed that the time series of topic popularity exhibit a distinct correlation when the correlation coefficient reaches its peak value. Specifically, as the topic popularity of the fund increases, there is a corresponding rise in the topic popularity of the supported papers; and the higher the correlation coefficient, the more pronounced this trend becomes.
In order to summarize the general hysteresis characteristics and patterns of the correlation evolution between the fund topic and its supported paper topics in the dimension of topic popularity, this study analyzed the distribution relationship between the maximum correlation coefficients and their corresponding average lag times for the time series of topic popularity of funds and their supported papers. The results are shown in Figure 8. We considered two specific cases: when -1 < maximum correlation coefficient < 0 (negative correlation), and when 0 < maximum correlation coefficient < 1 (positive correlation).
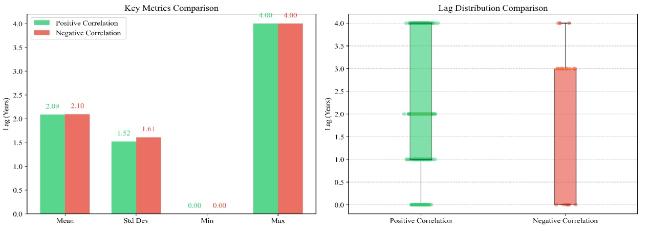
Figure 8. Positive/Negative correlation lag statistics comparison (significance test completed). |
By analyzing Figure 8, it can be observed that the maximum correlation coefficients of the topic popularity time series of the fund and its supported papers, along with their corresponding lag time distributions, exhibit certain patterns. When -1 < maximum correlation coefficient < 0 (negative correlation), the average lag time of the topic popularity time series is 2.10 years. Similarly, when 0 < maximum correlation coefficient < 1 (positive correlation), the average lag time of the topic popularity time series of the fund and its supported papers is 2.09 years. Based on these findings, it can be concluded that, from the perspective of topic popularity, there is a clear co-evolution relationship between the fund and its supported papers, with a significant lag effect. The influence of the fund’s topic on the topic of the supported papers gradually diminishes after a lag time of more than 2 years.
4.4 The hysteresis effect of the topic content dimension
The correlation evolution path map of the US Department of Social and Economic Sciences’ fund and its supported paper topics is depicted in Figure 9. This map is divided into four lag windows (1-year to 4-year lag window). The reason for these specific lag windows is that the research is centered on the task scenario of emerging trend prediction. In practical applications, predicting emerging trends for the next 3 years is often meaningful and relatively accurate. Hence, our analysis concentrates on examining the hysteresis feature of the impact of the fund’s topic content on the topic content of papers within the following 4 years.
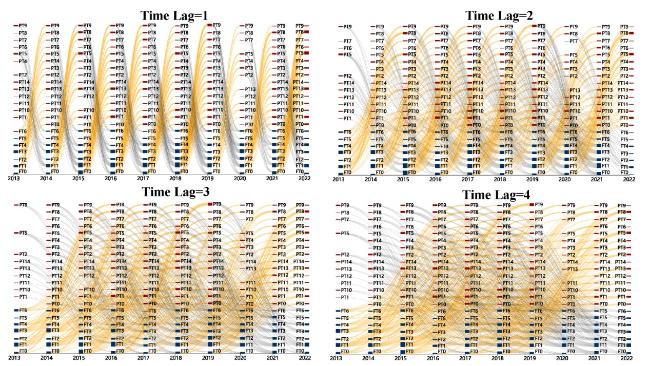
Figure 9. The evolution path of topic content association (lag 1 year-lag 4 years).(https://www.informationscience.top/nsf777.html) |
In Figure 9, a yellow mark is added to represent the associated evolution path flowing from the content of the fund topic (FTn) to the content of the paper topic (PTn). Due to the large number of topic-related relationships, it is difficult to see the difference in the size of the topic-related relationships in the thickness of the connection in Figure 8, but you can see the specific numerical difference in similarity through the webpage gallery file (put the mouse on the connection line). Since this study focuses on the hysteresis effect in the evolution of topic associations between funds and their supported papers, and does not conduct specific analysis on emerging trend prediction, we will not provide a detailed interpretation or analysis of these pathways. Analyzing each subgraph in Figure 9, it can be observed that when the lag period is 1 and 2, there are more yellow paths (with a higher proportion and thicker path) from the fund topic to the paper topic. This indicates that when the lag period is 1 and 2, the fund topic has a higher influence and similarity to the paper topic. However, as the lag time increases, the influence and similarity of the fund topic to the paper topic gradually decrease.
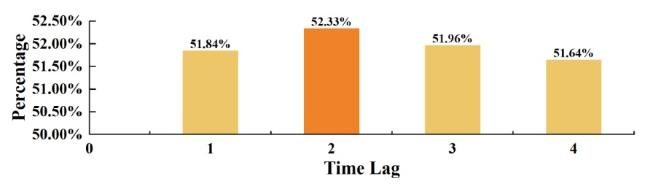
Combining the topic recognition results of the fund and its supported papers with the topic association evolution paths of the four lag time windows, we calculated the proportion of the association evolution from the fund topic to the topic content of the paper under each of the four time lag windows, as shown in Figure 10 below.
Figure 10. The ratio of fund topics to paper topics related evolution. |
Analyzing Figure 10, we observe that under different time lag windows, the proportion of the related evolution from fund topics to paper topics (FTn to PTn) shows an interesting pattern of rising first and then falling. Specifically, there is an upward trend with a lag of 1 year to a lag of 2 years, and the proportion reaches its maximum value of 52.33% at a lag of 2 years. Subsequently, the proportion starts to decrease, reaching its minimum value of 51.64% at a lag of 4 years. Therefore, from the perspective of topic content, the fund and its supported papers exhibit co-evolution and a hysteresis effect, with the significant impact of the fund’s topic content on the supported paper’s topic occurring after a lag of 2. This finding can also be validated through cross-validation with the hysteresis effect in the topic popularity dimension, which confirms that there is a clear co-evolution relationship between the fund and its supported papers from the perspective of topic popularity, and a significant hysteresis effect is observed with a lag period of 2 years. Based on all these findings, our research reveals the following insights:
1) There is a co-evolution relationship between the funds of the US Department of Social and Economic Sciences and the topics of their supported papers, and this co-evolution exhibits an evident hysteresis effect.
2) Specifically, the lag period for the association evolution of the funding topic to the topic of the supported paper is approximately 2 years. This means that the current funding topic has the most significant impact on the supported paper’s topic after a lag of 2 years, as indicated by the highest correlation coefficient, and then the influence gradually diminishes.
By integrating the two dimensions of topic popularity and topic content, we can validate the research hypothesis proposed in this study. The results confirm the presence of an associated evolution relationship between the fund topic and its supported paper topic, wherein the two topics exhibit a distinct hysteresis effect during the evolution process. Specifically, the findings demonstrate that the fund and its supported papers have a clear co-evolution relationship with a lag period of 2 years. To gain a deeper understanding, we further delve into the reasons behind this hysteresis effect:
1) Institutional factors of funding system. The fund’s application, approval, and paper publication adhere to specific institutional procedures, leading to a certain lag in their impact on each other.
2) Research cycle factor. The completion of research after receiving funding involves conducting experiments, data collection, processing, and analysis, which typically take a fixed period of time. Additionally, deviations from the fund’s designated research route can affect the hysteresis effect.
3) Paper publication cycle factor. After completing their research, researchers need to write and submit papers to academic journals for review. The publication process in academic journals may take several months or even longer, contributing to the hysteresis effect.
4) Knowledge flow factor. Research topics in a particular field depend on existing knowledge and undergo a gradual process of change. The transfer and flow of knowledge between the fund and its supported papers take time, resulting in a hysteresis effect.
5 Discussions
In the context of emerging trend prediction, this study explores the hysteresis effect of the evolution associated between the fund and its supported paper topics. Based on our case studies, we have made several important findings:
1) Synergistic Evolution with Lag. The associated evolution process between the fund theme and its supported paper topics exhibits significant synergistic features with a certain time lag. This implies that in multi-source data fusion for emerging trend predicting, it is crucial to consider the time lag between different data sources, especially for funds and their supported papers. Simply merging and processing data based on time alone may not be adequate.
2) Co-evolution with Lag. Considering both topic popularity and topic content, the fund topic and its supported paper topics demonstrate a clear co-evolution relationship with a lag. This lag period is typically around 2 years, indicating that the influence of the fund topic on the supported paper topics becomes apparent after a lag of 2 years. Beyond this lag period, the impact gradually diminishes.
3) Influence of Topic Similarity. The lag periods with the highest correlation between the fund topic and its supported paper topics are mainly concentrated at 1-year and 2-year lags. Interestingly, the hysteresis effect of the topic association evolution is inversely proportional to the topic similarity. In other words, as topic similarity increases, the lag period for topic association evolution decreases. This suggests that in specific emerging trend prediction scenarios, the prediction time for emerging trends can be dynamically adjusted based on the similarity between the topics of funds and their supported papers. For funds and their supported papers with high similarity, a smaller lag should be considered for more accurate predictions.
These findings and conclusions hold great potential for enhancing the foresight, accuracy, and scientific validity of emerging trend prediction. By understanding and considering the hysteresis effect and associated evolution of the fund and its supported paper topics, we can make more informed and reliable predictions about emerging trends.
This study has made several significant theoretical and practical contributions. By investigating the hysteresis effect of the fund and its supported paper topics, we have unveiled the mutual influence and interaction between topics in scientific research, offering valuable insights into the process of knowledge generation, dissemination, and transformation. Therefore, this finding holds considerable theoretical significance. Moreover, the patterns and laws identified in this research can be utilized by technology managers to predict future research hotspots and trends. These predictions can empower decision-making and provide practical guidance for technology management. By staying ahead of emerging trends, technology managers can make informed choices to advance research and development efforts effectively. Overall, this study not only contributes to the understanding of topic co-evolution but also offers practical tools for enhancing technology management and decision-making processes.
From a theoretical standpoint, this study holds several key contributions. Firstly, it stands as one of the pioneering works to delve into the hysteresis effect of the fund and its supported paper topics. Leveraging machine learning, mathematical statistics, and visualization techniques, the research analyzes the correlation evolution process between the fund and its supported paper topics. This deeper understanding of knowledge evolution allows us to grasp the patterns and transformation trends of knowledge, enriching and advancing the theory of knowledge evolution. Secondly, adopting a systems theory approach, we explore the hysteresis phenomenon arising from mutual feedback and mutual influence among elements within the scientific innovation system. The conclusion that a significant lag period of 2 years characterizes the evolution of funding topics and supported paper topics provides a foundational basis for investigating the funding system and factors like paper publication cycles. Moreover, this perspective offers valuable insights into the real-world impact of scientific innovation systems. Furthermore, the hysteresis effect observed between the fund and its supported paper topics might involve the convergence and integration of multiple disciplines. This has the potential to provide robust theoretical support for fostering interdisciplinary collaboration, academic exchanges, and cooperative research efforts. By understanding the hysteresis effect, we can facilitate the promotion of interdisciplinary approaches and advance collaborative scientific exploration.
From a practical standpoint, this research holds promising applications in intelligence analysis methods that leverage multi-source data. For instance, it can enhance the scientific validity and predictive power of emerging trend predicting methods, enabling governments and scientific research institutions to develop more accurate research plans and funding policies. By better understanding the trends and demands in discipline development, it becomes possible to avoid resource wastage and dispersion. Furthermore, the hysteresis effect can be utilized for fund project evaluation and effectiveness assessment. Analyzing the hysteresis effect in the evolution of the relationship between the fund and supported paper topics allows us to gauge the effectiveness and impact of research projects supported by the organization within a certain timeframe. This, in turn, provides a foundation for fund evaluation and aids in informed decision-making. Moreover, the research findings on hysteresis effects can contribute to evaluating the practical applications and societal impact of research outcomes, offering valuable insights for the transformation and promotion of research results, particularly in the context of science-technology-industry relationships. By harnessing the knowledge of hysteresis effects, organizations can effectively evaluate the real-world applications and social significance of their research endeavors, facilitating successful technology transfer and broader impact in society.
In this study, we employed the LDA model to measure the hysteresis effect of topic-related evolution, acknowledging the potential limitations of this model in handling long-tail words and domain-specific vocabulary. Although these words carry critical semantic information in certain fields, the primary objective of this study was to measure the hysteresis effect rather than to provide an in-depth interpretation of word content; thus, this limitation had a limited impact on the overall conclusions. To improve in future work, we plan to adopt more advanced topic models (such as BERTopic or Top2Vec), optimize data preprocessing methods (by introducing TF-IDF weighting or word embedding techniques during the preprocessing stage), and design more refined experimental protocols to more accurately capture the semantic information of long-tail words and domain-specific vocabulary, and to validate the effectiveness of the models.
Furthermore, in this study, the timing of the emergence of the focal topic in funds or papers has not yet been determined, which has a certain impact on the research conclusions. To address this limitation, we plan to focus on precisely determining the emergence time of the focal topic in both funds and papers in our subsequent research. Through comparative analysis, we will delve into the hysteresis effect of topic evolution. In our follow-up research, we will collect research data covering a longer time span, employ more refined analytical methods to detect when the focal topic emerges in funds or papers, and then compare their emergence times. We aim to more comprehensively reveal the dynamic correlation and evolution patterns between fund topics and paper topics.
6 Conclusion
This study focuses on the scenario of emerging trend prediction, specifically investigating the hysteresis effect in the associated evolution of funding topics and the topics of their supported papers, by using the Department of Social and Economic Sciences of the National Science Foundation of the United States as an illustrative example. Employing the principles of system theory, we treat the topics of the fund and its supported papers as components of a scientific innovation system, characterized by mutual feedback and mutual influence. Within this framework, we devise a method to analyze the hysteresis effect between the two topics, offering a two-dimensional quantitative and visual analysis of their collaborative dynamics and hysteresis characteristics throughout the evolution process. The results of our case analysis reveal significant synergistic properties between the fund topic and its supported paper topics, accompanied by a discernible hysteresis effect. Specifically, a notable lag period of 2 years is observed, during which the topic correlation gradually diminishes with the lengthening of the lag period. These findings provide valuable insights into the co-evolution and hysteresis dynamics between the topics, offering a deeper understanding of the knowledge generation, dissemination, and transformation processes in the scientific research domain.
This study does have some limitations. Firstly, constructing topic correlations by using cosine similarity may result in the loss of certain aspects of the topic relationships. There might be more nuanced or complex associations between topics that the cosine similarity approach might not fully capture. Secondly, this study specifically focuses on analyzing the hysteresis effect between funds and their supported papers. However, the hysteresis effect among various other data sources, such as funds, papers, and patents, remains unexplored.
In future research, we aim to enhance the scope of case studies building upon the findings of this study. Our goal is to construct a comprehensive multi-disciplinary and multi-field subject correlation evolution time-lag distribution table, which can further advance related research and practical applications like emerging trend prediction and research frontier identification. Through the analysis of the hysteresis effect in the correlation evolution between the fund and supported paper topics, we will uncover the process of knowledge fusion and interdisciplinary research. Additionally, we plan to delve into scientific and technological achievement evaluation and develop trend predicting methods based on topic-related evolution lag. This will allow us to gain a deeper understanding of the impact and effectiveness of research projects and provide valuable insights for decision-making in science and technology management.
Funding information
This work was supported by National Natural Science Foundation of China (No. 72104110 No.72274113), Basic Science (Natural Science) Research Projects in Higher Education Institutions in Jiangsu Province (No. 22KJB630011), General Project of Philosophy and Social Sciences Research in Jiangsu Universities (No. 2022SJYB0253), Taishan Scholar Foundation of Shandong province of China (tsqn202103069), and Shandong Provincial Natural Science Foundation (No.ZR202111130115).
Author contributions
Ziqiang Liu (lzq@njnu.edu.cn): Writing - original draft (Equal);
Haiyun Xu (xuhaiyunnemo@gmail.com): Writing - review & editing (Equal);
Lixin Yue (yuelixin@njnu.edu.cn): Formal analysis (Equal);
Zenghui Yue (yzh66123@126.com): Visualization (Equal).