

1 Introduction
It is well-accepted that innovation is critical for firms to gain success in an increasingly competitive market. However, firms often face a series of problems, such as high innovation risks, difficulties, and substantial uncertainty, when conducting independent research and development activities (Hou et al., 2019). The research is grounded in the unique socio-cultural landscape of China, where “Guanxi” significantly influences social networks (Lin et al., 2021; Luo, 1997; Tsang, 2002). “Guanxi” includes both interpersonal and business interactions. A notable example is the alumni networks, which play an important role in social life due to shared educational backgrounds and experiences. The concept of “alma mater consciousness” fosters a close bond between executives and their alma mater. This connection promotes innovation cooperation and facilitates communication between universities and enterprises. Alumni connections among executives foster innovation by creating strong emotional bonds based on shared education, trust, and professional values. These ties extend beyond traditional networks, enabling seamless information exchange. Additionally, they promote knowledge diffusion across firms, reducing opportunism and transaction costs, which are crucial for innovation.
The researchers are replete with studies affirming the beneficial impact of executives’ alumni networks on firm innovation. However, Xu et al. (2019) challenge this view, arguing that relational capital might negatively influence firm efficacy. Such divergence prompts a pivotal inquiry: Does the alumni networks of executives, as a salient form of relational capital, foster the ongoing augmentation of a firm’s innovative output? Notably, existing research lacks a comprehensive explanation of this issue, leaving a clear gap in academic discourse.
To identify potential channels through which executive alumni networks foster innovation, we further investigate the impact of geographic knowledge spillovers on firm innovation across different network positions. Liao’s research underscores the substantial geographic spillover effect of university R&D, influencing firm patents and new product innovation (Liao, 2011). This finding intimates a nuanced relationship between the proximity of geography and innovative achievements. University-generated knowledge is foundational to the evolution of groundbreaking technological progress. As Pavitt (2001) highlighted, the expertise and outputs from academic institutions are crucial sources of new knowledge that drive innovation within firms. Transferring knowledge from universities to industry is crucial, enabling the integration of new scientific insights into commercial applications within companies (Bercovitz & Feldman, 2006). Moreover, when academic research outcomes are shared, they enrich the knowledge base essential for identifying business opportunities (Daniel & Alves, 2020). They also enhance the evolving capabilities of firms within their local environments (Lyu et al., 2019).
Existing research on the relationship between alumni networks and firm innovation has the following shortcomings: Researchers commonly assume a simple linear relationship between executive alumni networks and firm innovation. However, this perspective overlooks the various intervening factors that can impede or alter this ostensibly linear correlation. Despite the recognition of these influencing factors (Qi et al., 2020; Song et al., 2023), the existing literature lacks a clear explanation of the extent of these effects. It is also unclear whether these factors can reverse the linear relationship between alumni networks and firm innovation.
Additionally, conventional studies often use a simple binary measure of alumni ties, overlooking indirect connections through shared academic links. This study employs a social network approach to map alumni relationships among executives. It examines how executives’ network positions influence innovation performance and explores how geographic knowledge spillovers interact with alumni networks to drive innovation.
2 Literature review and hypothesis development
2.1 Executive alumni networks centrality and firm innovation
Theoretically, entities in central network positions often have stronger relational ties. This leads to disparities in resource allocation and firm governance outcomes. The centrality of such networks is measured by a centrality index, with greater centrality indicating that the core nodes of the network have greater control and influence. According to the high-level theory, executives’ backgrounds and social relations influence firm performance and long-term development, as they are leaders who set and implement firm management goals. The alumni networks naturally connect enterprises and universities, forming a trust model based on shared alma mater ties. It shortens the distance between universities and enterprises, fostering a sense of closeness and identity, which lays the foundation for cooperation. Executives at the network’s center have rich resources and information, which broadens their innovation perspective, increases innovation investment, and improves innovation performance.
However, team conflict theory cautions against the potential downsides of diverse cognitive perspectives within a team (O’Neill & McLarnon, 2018). Low centrality in executive alumni networks, signifying limited alumni resources, may increase cognitive disparities among executives. This can reduce trust, hinder communication, and lead to poor decision-making, ultimately impairing innovation performance. Furthermore, while individual executives’ focus on expanding their personal alumni network benefits their social capital, it may not necessarily benefit the enterprise. This could lead to challenges in resource integration and dilute the drive for innovation (Song et al., 2023). For enterprises, encouraging executives to expand their alumni networks when resources are limited does not always lead to effective integration of the network within the company. Instead, it may cause difficulties in resource integration and harm the enterprise’s innovation drive.
Existing studies primarily examine a linear link between executive alumni networks and firm innovation, but a potential nonlinear relationship remains unverified. This study proposes a “U-shaped” relationship, where greater network centrality enhances innovation beyond a threshold. Accordingly, this study proposes the following hypothesis:
H1: The centrality of firms in the executive alumni networks shows a “U-shaped” relationship with firm innovation performance. Limited alumni resources initially hinder innovation but drive positive outcomes when resources become sufficient.
2.2 The moderating effect of executives’ academic experience
Shen et al. (2020) point out that academic experience influences firm innovation by improving internal controls and reducing the degree of information asymmetry. Therefore, we use executives’ academic backgrounds as a moderating variable to delve into the relationship between executive alumni networks and firm innovation.
Executives’ academic background encapsulates their experience and serves as a key knowledge source. They are well-positioned to leverage university knowledge spillovers, aligning academic inquiry with innovation. Their social capital aids in accessing resources, while their familiarity with research commercialization enhances resource integration and allocation within enterprises (Hambrick & Mason, 1984). However, the core of academic exploration lies in uncovering complex phenomena and persistently pursuing new knowledge. Executives with academic experience foster innovation through exploration but may slow its pace due to the time demands of advanced research. Additionally, excessive focus on their fields can narrow their vision, potentially limiting broader strategic perspectives.
Therefore, this paper posits that while executives’ academic experience can bolster and guide enterprise innovation through alumni resources, it may also slow the pace of innovation performance due to a focus on high-end innovation.
H2: Executives’ academic experience weakens the “U-shaped” relationship between their network centrality and firm innovation, flattening the curve.
2.3 Knowledge spillovers from geographic proximity
2.3.1 Executive alumni networks location, provincial university publications, and firm innovation
Empirical evidence highlights the crucial role of universities in the innovation ecosystem, mainly through conducting basic research that drives the upstream of the knowledge and innovation chain (Zhang & Bai, 2022). As key drivers of basic research, universities produce public goods such as knowledge and talent, which can spill over into the economy and stimulate enterprise innovation. However, the long development cycle of basic research often discourages profit-driven enterprises from direct involvement, making them reliant on external sources for foundational knowledge. Consequently, nations increasingly pursue a university-led basic research paradigm to spur technological advancement (Mansfield, 1980).
University research outputs, such as papers and patents, represent cutting-edge knowledge but are often implicit and require specialized researchers for transformation. Enterprises with weaker alumni network ties struggle to connect with these experts. For executives, high time costs make evaluating academic work challenging. Executives with central alumni network positions gain better access to researchers as human resources, aiding innovation.
Compared to academic papers, scientific and technological works present knowledge more fundamentally, primarily aimed at revealing objective facts and natural laws. Their main purpose is to disseminate explicit knowledge, making them a more popular research output. Arora et al. (2019) found that in recent years, large U.S. corporations have gradually withdrawn from the field of basic research, focusing on opening the discovery of the existing knowledge and its commercialization. The cost of acquiring new knowledge is notably high for firms possessing low centrality in executive alumni networks. These companies rely on existing knowledge and explicit scientific and technological information to gain innovative insights. Consequently, the regional spillover of knowledge, particularly in the form of scientific and technological publications, can provide significant innovation inspiration to firms with low centrality.
Given these dynamics, the study proposes the following hypotheses:
H3a: The higher the centrality of the firm in the executive alumni networks, the stronger the positive impact of provincial university papers on firm innovation performance.
H3b: The lower the centrality of the firm in the executive alumni networks, the more significant the positive impact of provincial university scientific and technical writings on firm innovation performance.
2.3.2 Executive alumni networks location, provincial university patents, and firm innovation
It has been argued that university patents can trigger knowledge spillover by influencing neighboring regions. Moreover, knowledge transfer costs increase with geographic distance (Liao, 2011). Patents differ from public theses in that they are protected by intellectual property rights, creating a barrier that restricts the dissemination and use of innovative elements. Enterprises located in areas with high centrality in the executive alumni networks have a preferred channel to access university patents.
Most studies confirm that having an alumni network and moderately utilizing external university innovation resources can significantly enhance firms’ innovation performance. However, some studies suggest that excessive centrality in the alumni networks may have negative effects in certain contexts. For example, high network centrality can reduce audit quality, weaken M&A decision-making, and impair shareholder reporting. Alumni relationships may also lead to a “clique” effect, causing firms to overly rely on alumni circles and hindering open innovation, especially for executives with overseas backgrounds (Qi et al., 2020). Over-embeddedness in the alumni networks may create exclusionary barriers to innovation and limit executives from leveraging other resources that enhance innovation performance. Therefore, firms need to optimize resource allocation to achieve the best innovation outcomes.
Additionally, Plečnik et al. (2022) note that while the openness and transfer of patented knowledge can reduce R&D duplication and foster beneficial knowledge spillovers, it might also diminish competitive advantages. For firms with extensive alumni resources, this may limit access to private information, thereby weakening their competitive position and innovation performance. This effect may be more pronounced in enterprises with more alumni resources.
Consequently, the study proposes the following hypotheses:
H3c: When firms have higher centrality in the executive alumni networks, the inhibitory effect of provincial university patent transfers on firm innovation performance becomes stronger.
H3d: Invention patent applications from provincial universities are more effective in promoting innovation performance in firms. This is especially true when firms have moderate or low centrality in the executive alumni networks.
3 Research design
3.1 Sample selection and data sources
Listed company data. This study selects Chinese A-share listed companies on the Shanghai and Shenzhen Stock Exchanges from 2011 to 2022 as the research sample, corresponding to the available financial and patent data periods. The data on listed companies are obtained from the CSMAR and CNRDS databases, including information on executives’ educational/academic experience, financial statements, and basic firm information. The sample is further screened based on the following criteria: (1) Companies newly listed in 2021 and 2022 are excluded, as the study requires the previous year’s financial and market transaction data; (2) Companies delisted during the sample period are excluded; (3) Companies under special treatment (ST or *ST) during the observation period are excluded; (4) Considering the particularity of the financial industry, companies classified under the financial and insurance industries are excluded.
Executive alumni networks position data. This study employs Gephi software to calculate the centrality. It selects Degree Centrality and Closeness Centrality as the firm-level measures of alumni network centrality, with the following steps: (1) Collect executives’ educational background information from the CNRDS database, using executive ID to avoid errors caused by duplicate names; (2) Construct a two-mode matrix of “executive-company”; (3) Convert it into a one-mode matrix of “executive-executive” using Python; (4) Calculate the network centrality indicators; (5) Use the average centrality as the firm-level alumni networks centrality indicator.
University research output and patent data. The data on provincial university research output are sourced from the Compilation of Science and Technology Statistics of Higher Education Institutions ① . This study selects data on academic papers, scientific publications, patent transfers, and patent applications from provincial universities where the company is registered. These data are then matched with firm-level data to explore the impact of university knowledge spillovers on firm innovation.
3.2 Description of variables
3.2.1 Dependent variable
Firm innovation performance. Invention patents are regarded as a sign of a firm’s core competitiveness in innovation and an important indicator of its R&D strength. Due to the availability and authority of data, this study adopts the number of enterprise invention patent applications to measure the innovation behavior of enterprises. The number of invention patent applications more accurately reflects a firm’s innovation level, while patent authorizations involve complex examination processes, introducing more significant uncertainty and instability. Therefore, from the robustness perspective, we use the number of invention patent applications as a proxy for the innovation performance of enterprises, and +1 takes the logarithmic treatment.
3.2.1 Independent variables
(1) Executive alumni networks centrality. In this paper, we study the relationship between alumni networks of executives of listed companies and firm innovation, referring to Freeman’s study (Freeman, 1978). Based on their educational background data, we select executives as network nodes and construct the executive alumni network indexes. Specifically, Degree centrality is used to measure the breadth of the executive alumni networks, and Closeness centrality is used to measure the depth of the executive alumni networks.
Degree centrality. Degree centrality measures the number of executives directly connecting with the executive; the larger the indicator, the richer and more extensive the executive’s relationship resources. The measurement method is as follows:
$\ { Degree }_{i}=\frac{\sum_{j} X_{i, j}}{g-1}$
i and j represent different executives, respectively, and X is 1 if i and j share a common educational background at least once and 0 otherwise; g is the total number of network nodes (executives of publicly traded companies in the current year), and g-1 is used to eliminate size differences.
Closeness Centrality. Closeness Centrality measures the distance between an executive and other executives in the relationship network, where d (i, j) is the distance from executive i to executive j (i.e., the shortcut length between the two nodes). The indicator equals the inverse sum of the distances between the executive and all other executives. A higher Closeness Centrality value signifies a closer and deeper alumni relationship among the executives. The measurement method is as follows:
${ close }=\left(\sum_{j=1}^{k} d(i, j)\right)^{-1}$
(2) Basic research results of colleges and universities. As a form of expression of basic research and scientific research achievements of universities, the papers represent the innovation level of universities to a certain extent, while scientific and technological writings are more in line with the innovation needs of enterprises. Therefore, we collect academic papers and scientific and technological writings published by colleges and universities in the province where the enterprise is registered, and +1 then takes their logarithm, respectively.
(3) Patent applications and transfers. Patents are regarded as the symbol of the core competitiveness of universities, and the number of invention patent applications is also an important indicator of the strength of scientific research and the R&D level of universities. The transfer of patents represents the sharing of one’s own knowledge with others; the more patents are transferred, the less private the knowledge becomes. Due to the data accessibility, this paper collects the invention patent applications and transfers of universities in the province where the enterprise is registered, +1 to each of them, and takes logarithms, respectively.
3.2.3 Moderator variables
Executive academic background. Academic experience refers to the experience gained by executive teams who previously worked in universities or scientific research institutions/associations (Valero & Van Reenen, 2016). This paper uses the logarithm of the ratio of executives with academic experience to the total number of executives, +1, to measure the strength of the enterprise’s executive academic background. A higher ratio indicates a more substantial academic background among executives.
3.2.4 Controlled variables
This paper selects the company executives’ average age (Age), overseas educational background (Board), education level (Edu), operating cash flow (Cashflow), TobinQ, net profit growth rate (ProfitRate), liquidity ratio (LiquidityRatio), profitability (ROA), and gross margin of operating cost (TTM) as the control variables that may affect firm innovation. All of the above metrics are logarithmically processed to control heteroskedasticity’s effect.
3.3 Model setup
To test the hypotheses, this paper first establishes a two-way fixed-effects model to examine whether firms’ location in the executive alumni networks influences firms’ innovation output. This paper controls for industry, year, and region-fixed effects to mitigate the impact of time-varying factors, regional differences, and industry-specific constraints on firm innovation. The regression model is constructed as follows:
$\begin{aligned} { Innovation }_{i, t}= & \alpha+\beta_{0} { Deg }_{i, t-1}+\beta_{1} { Deg }_{i, t-1}^{2}+\sum \gamma_{k} { control }_{i, t-1}+ \\ & \delta { Industry }_{i}+\theta { Year }_{t}+\mu { Province }_{i}+\varepsilon_{i, t} \end{aligned}$
In the above model, the explanatory variable innovation is the innovation level of enterprise I in year t; The explanatory variable Deg is the centrality index of alumni networks, measured by degree centrality and closeness centrality; Deg2 is the square of the centrality index of alumni networks. Control is the control variable of the model. Industry, Province, and Year represent the fixed effects of industry, province, and year, respectively. Considering that there is a specific time lag between enterprise patent R&D and filing, we treat the explanatory variables with first-order lags. All continuous variables in the paper are winsorized at the 1% level to mitigate the impact of outliers, resulting in a final sample of 10,129 observations.
3.4 Descriptive analysis
Table 1 presents descriptive statistics of key variables. In recent years, policy support has driven significant growth in enterprise patent applications, university publications, and patent transfers. However, high standard deviations in patent applications and transfer ratios indicate uneven innovation capacity among firms and universities. The alumni network’s centrality measures vary, with maximum values of 0.074 and 0.613 and minimum values of 0, reflecting degree and closeness centrality differences. Other control variables align with existing literature and fall within reasonable ranges, indicating no significant sample selection bias.
Table 1. Descriptive statistics of the main variables. |
| Variable | Average | Standard | Min | Max |
|---|---|---|---|---|
| Innovation | 2.469 | 1.591 | 0 | 6.727 |
| Deg | 0.024 | 0.016 | 0 | 0.074 |
| Close | 0.412 | 0.048 | 0.318 | 0.613 |
| Scientific & technical writings | 5.374 | 0.771 | 2.773 | 6.733 |
| papers | 10.676 | .695 | 7.925 | 11.611 |
| patent_applications | 9.175 | 1.011 | 5.088 | 10.775 |
| patent_transformation | 4.377 | 0.936 | 0.693 | 5.308 |
| alumni_patentApplictaions | 6.681 | 1.085 | 1.386 | 8.153 |
| academic_background | 0.170 | 0.097 | 0 | 0.601 |
| Age | 3.952 | 0.101 | 3.664 | 4.174 |
| Edu | 1.366 | 0.196 | 0.693 | 1.609 |
| Board | 1.37 | 0.067 | 1.099 | 1.386 |
| Cashflow | 0.047 | 0.063 | -0.138 | 0.216 |
| TobinQ | 1.076 | 0.345 | 0.607 | 2.252 |
| ProfitRate | 0.134 | 0.73 | -6.499 | 2.49 |
| LiauidityRatio | 1.164 | 0.534 | 0.306 | 2.971 |
| ROA | 0.042 | 0.059 | -0.271 | 0.183 |
| TTM | 0.269 | 0.138 | 0.022 | 0.636 |
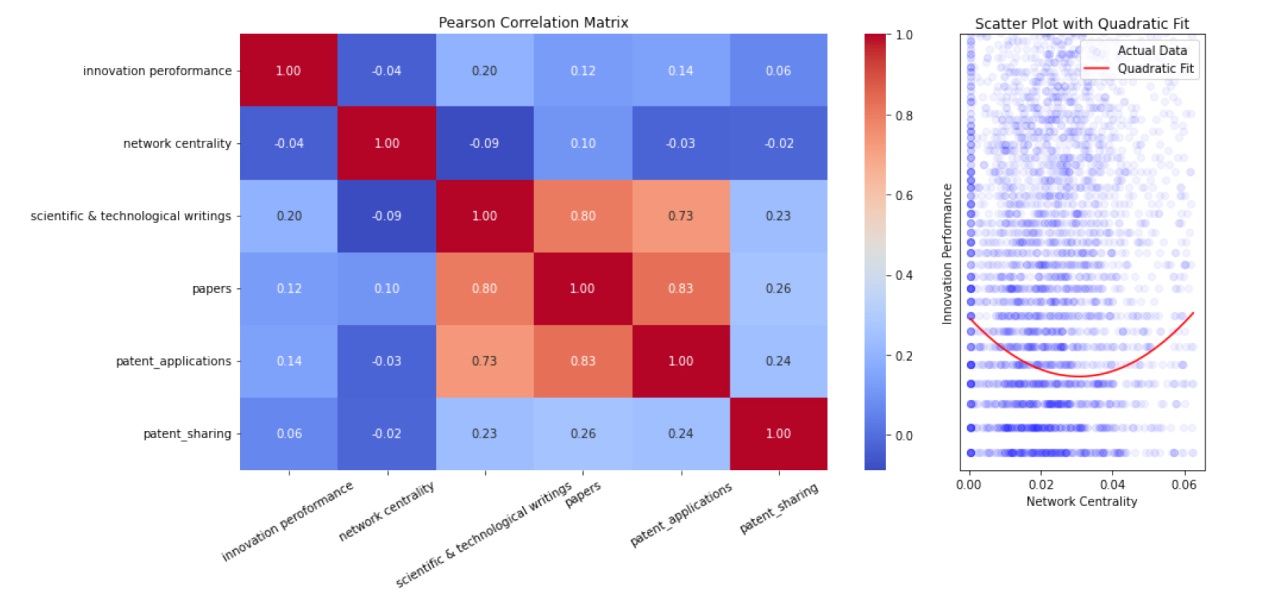
To preliminarily investigate the association between executive alumni networks and firm innovation performance, this paper draws a Pearson correlation heat map between the explanatory variables and the main explanatory variables. As illustrated on the left of Figure 1, the findings indicate a noteworthy negative correlation between the centrality of the executive alumni networks and firms’ innovative performance, contrary to established literature (Song et al., 2023). To further investigate this, a scatterplot was created, and a quadratic fitting was applied to the data. The curve on the right of Figure 1 suggests a “U-shaped” relationship between network centrality and innovation performance. A more detailed analysis is needed to validate Hypothesis 1.
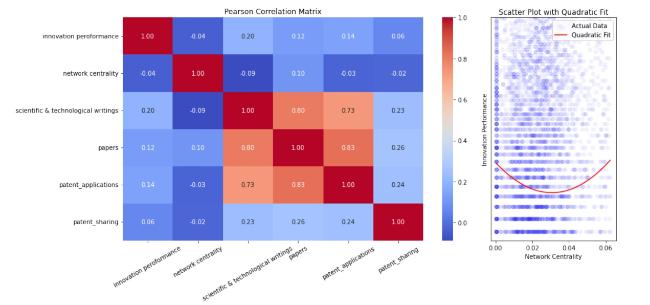
Figure 1. Pearson correlation & scatter plot with quadratic fit. |
4 Empirical analysis
4.1 Baseline regression
In order to effectively identify the impact of executive alumni networks on firm innovation, we estimated a fixed-effects model using stata16.0 software. In order to mitigate the endogeneity problem, this study controls as many variables as possible that characterize the innovative behavior of firms and controls for industry-level, city-level, and year-fixed effects, which, to a certain extent, can mitigate the endogeneity defects caused by omitted variables. The regression results are shown in Table 2.
Table 2. Baseline Regression. |
| Variable | Innovation | |||
|---|---|---|---|---|
| (1) | (2) | (3) | (4) | |
| Deg | -13.123*** | -24.978*** | -22.535*** | -11.426*** |
| ( -15.29) | (-11.69) | (-10.52) | (-3.80) | |
| Deg2 | 217.841*** | 204.783*** | 137.178*** | |
| (6.05) | (5.64) | (3.20) | ||
| Cashflow | 0.885*** | 0.216 | ||
| (3.98) | (1.06) | |||
| TobinQ | -0.146*** | -0.124** | ||
| (-3.14) | (-2.53) | |||
| ProfitRate | -0.017 | -0.057*** | ||
| (-1.17) | (-4.37) | |||
| LiquidityRatio | -0.397*** | -.107*** | ||
| (-9.10) | (-2.66) | |||
| ROA | -1.694*** | -0.56 | ||
| (-4.05) | (-1.46) | |||
| TTM | 0.262 | 0.094 | ||
| (0.99) | (0.39) | |||
| Age | 2.107*** | 0.5*** | ||
| (11.48) | (2.93) | |||
| Edu | 0.736** | 0.184** | ||
| (7.93) | (2.17) | |||
| Board | 0.774** | 0.291 | ||
| (2.56) | (1.07) | |||
| Constant | 2.808*** | 2.912*** | -6.938*** | -0.631 |
| (125.82) | (103.49) | (-8.06) | (-0.79) | |
| Industry / Region / Year | No | No | No | Yes |
| N | 10129 | 10129 | 10129 | 10129 |
| Adj.R2 | 0.033 | 0.039 | 0.095 | 0.271 |
Column (1) is a linear regression equation with a significant negative relationship between Deg and Innovation at the 1% level. Overall, as the centrality of executive alumni networks increases, firm innovation is inhibited. Column (2) explores the nonlinear relationship between the core explanatory variables and the explained variables. The empirical results indicate that the regression coefficient of the Deg is -24.978. The quadratic function characteristics suggest that there is an initial “U-shaped” relationship between the degree of centrality in the executive alumni networks and enterprise innovation. Columns (3) and (4) show the regression coefficients after introducing control variables, as well as fixed industry, province, and year effects. The coefficients of Deg and Deg2 are still positive and negative respectively, both significant at the 1% level, which again indicates that the centrality of executive alumni networks has a negative and then positive effect on firm innovation. The turning point of the executive alumni networks is calculated as 0.042. That is when the centrality of executive alumni networks exceeds 0.042, it will gradually promote firm innovation, confirming hypothesis H1.
Descriptive statistical analysis of the dataset reveals that the average centrality degree of executive alumni networks in the sampled enterprises is 0.024 (As shown in Table 1). This indicates that most listed enterprises in China are positioned to the left of the inflection point. It can be inferred that the impact of the executive alumni network’s centrality on innovation performance in most of these enterprises is still in a stage where the adverse effects predominate.
In this paper, we further count the industries whose alumni network centrality exceeds the turning point. Among 10,129 observations, a total of 1,290 data have a Deg value exceeding the turning point of “U-shape” (0.042), which means a total of 1,290 observations have entered the positive effect stage of the “U-shape” relationship. We list the top 20 industry codes, as shown in Figure 2. The industry with the most positive effects is C39 (computer, communications, and other electronic equipment manufacturing), with a total of 168 occurrences; the second most is C27 (pharmaceutical manufacturing), with a total of 121 occurrences; and the third is I65 (software and information technology services), with a total of 103 occurrences. Among them, C39 and C27 are both high-tech industries as defined by the National Bureau of Statistics of China ② . I65’s operating business is also mainly related to technology-based products.
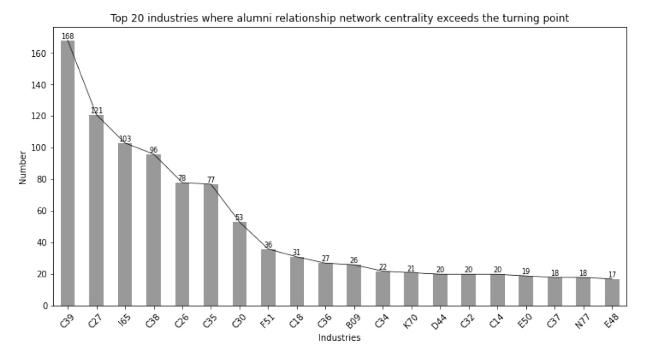
Figure 2. Top 20 industries where alumni networks centrality exceeds the turning point. |
Chinese high-tech industry faces significant innovation challenges. This result suggests that the industry seeks to mobilize all available resources and create a favorable innovation environment in the short term. Therefore, in personnel decision-making, considering that executives’ alumni networks can provide more R&D knowledge and innovation resources, hiring executives with more substantial alumni connections can help enterprises leverage these resources in the competitive market and lay a solid foundation for innovation.
4.2 Robustness test
4.2.1 The “U-shaped” relationship test
Haans et al. (2016) pointed out that the significance of the quadratic coefficient alone does not fully confirm the existence of the (inverted) “U-shaped” relationship, so it is necessary to test the (inverted) “U-shaped” relationship. This paper tests the “U-shaped” relationship between the centrality of executive alumni networks and firm innovation, as shown in Table 3. The results show that the centrality of executive alumni networks is (0.000, 0.074), and the turning point is 0.037. The slope of the left interval is -11.314 (significant at the 1% level), and the slope of the correct interval is 8.858 (also significant at the 1% level), confirming the “U-shaped” relationship at the 1% significance level. This result indicates that there is a “U-shaped” relationship between executive alumni networks and firm innovation, which further supports hypothesis H1.
Table 3. “U-shape” Relationship Test. |
| Lower bound | upper bound | |
|---|---|---|
| Interval | 0.000 | 0.074 |
| Slope | -11.314 | 8.858 |
| t-value | -3.804 | 2.427 |
| P > | t | | 0.000 | 0.008 |
| Overall test of presence of a U shape | ||
| t-value = 2.43 | ||
| P > | t | = 0.008 | ||
4.2.2 Alternative variables regression test
This paper adopts closeness centrality as a substitute for degree centrality and explores the relationship between the depth of executive alumni networks and firm innovation. The regression results in Table 4 show that after replacing the core explanatory variables, the regression results still indicate that there exists a “U-shaped” relationship between the centrality of executive alumni networks and firm innovation. In other words, enterprises need to engage more deeply in alumni relations to enhance their innovation capabilities and outcomes. If the depth of alumni relations is insufficient, over-reliance on them may hinder the enterprise’s innovation. The regression results are consistent with the previous result, indicating the robustness of the conclusions of this paper.
Table 4. Surrogate regression. |
| Variable | Innovation | |||
|---|---|---|---|---|
| (1) | (2) | (3) | (4) | |
| Close | -0.544** | -11.984*** | -13.707*** | -9.017*** |
| (-1.98) | (-4.43) | (-4.99) | (-3.60) | |
| Close2 | 12.767*** | 15.01*** | 9.881*** | |
| (4.25) | (4.92) | (3.56) | ||
| Constant | 2.721*** | 5.238*** | -5.324*** | 1.09 |
| (23.91) | (8.69) | (-5.04) | (1.14) | |
| Control | Yes | Yes | Yes | Yes |
| Industry / Region / Year | No | No | No | Yes |
| N | 10129 | 10129 | 10129 | 10129 |
| Adj.R2 | 0.001 | 0.003 | 0.069 | 0.270 |
4.2.3 Other robustness tests
(1) Replacing the research sample. Firstly, Building upon the findings of prior literature (Lu et al., 2024), this analysis focuses on a sample of Chinese manufacturing enterprises, recognizing the critical need for structural optimization and dynamic transformation in this sector. This specificity aids in elucidating the nonlinear relationship between the executive alumni networks and firm innovation, with results presented in Table 5, Column (1). Secondly, to mitigate the potential confounding effects of enterprise nature on the regression outcomes, the sample is bifurcated into state-owned and non-state-owned enterprises. This distinction allows for a more nuanced exploration of the interplay between the centrality of executive alumni networks and enterprise innovation, with results detailed in Table 5, Columns (2) and (3). Across both manufacturing and varying enterprise types (state-owned and non-state-owned), the coefficients for primary and secondary terms of network centrality are significant and align with the direction of the benchmark regression. This suggests that enterprises, irrespective of their nature, benefit from maximizing alumni resources to influence firm innovation positively. These findings lend further credence to the robustness of the conclusions drawn in this paper.
Table 5. Other robustness test results. |
| Variable | (1) | (2) | (3) | (4) |
|---|---|---|---|---|
| Manufacturing industry | State enterprise | non-state enterprise | Explanatory variables lagged | |
| Deg | -15.548*** | -10.038** | -10.396** | -7.499** |
| (-4.47) | (4.803) | (3.951) | (-2.53) | |
| Deg2 | 189.524*** | 125.289* | 124.245** | 109.073*** |
| (3.83) | (68.518) | (56.525) | (2.61) | |
| Constant | 0.337 | 1.179 | -1.731* | -0.767 |
| (0.36) | (1.426) | (0.988) | (-0.96) | |
| Control | Yes | Yes | Yes | Yes |
| Industry / Region / Year | Yes | Yes | Yes | Yes |
| N | 10129 | 10129 | 10129 | 10129 |
| Adj.R2 | 0.101 | 0.040 | 0.085 | 0.269 |
(2) Lagged explanatory variables. Referring to previous studies (Zhou et al., 2021), we lag the explanatory variables by one period and re-test the primary regression model. The regression results, as shown in Column (4) in Table 5, show that the centrality of the degree of executive alumni networks still significantly promotes firm innovation, again proving that the empirical results of this paper are robust.
4.3 Further analysis
4.3.1 Moderating effect testing
This paper constructs the following econometric model to verify and investigate the moderating effect of executives’ academic experience on the “U-shaped” relationship between centrality and innovation.
$\begin{aligned} { Innovation }_{i, t}= & \alpha+\beta_{0} { Deg }_{i, t-1}+\beta_{1} { Deg }_{i, t-1}^{2}+\beta_{3} { Deg }_{i, t-1} \times { adc }_{i, t-1}+\beta_{4} { Deg }_{i, t-1}^{2} \times { adc }_{i, t-1}+ \\ & \sum \gamma_{k} { control }_{i, t-1}+\delta { Industry }_{i}+ { \theta Year }_{t}+\mu { Province }_{i}+\varepsilon_{i, t} \end{aligned}$
The moderator variables abc denote the logarithmic form of the executive’s academic experience. Compared with Equation (1), Equation (2) introduces the interaction terms of the moderating variables with the independent variables and their squared terms.
Table 6 shows the moderating effect of executives’ academic backgrounds on the “U-shaped” relationship. The coefficient of the interaction term between the quadratic term of the centrality and the moderating variable is negatively significant (-977.138) at the 1% level, which indicates that the “U-shape” is flatter, and hypothesis H2 is confirmed.
Table 6. Regression result of regulating effect. |
| Variables | Innovation |
|---|---|
| Deg | -20.032*** |
| (-4.58) | |
| Deg2 | 293.382*** |
| (4.38) | |
| academic_background | -0.492* |
| (-1.75) | |
| Deg*academic_background | 53.69*** |
| (2.80) | |
| Deg2*academic_background | -977.138*** |
| (-3.11) | |
| Constant | -0.859 |
| (-1.09) | |
| Control | Yes |
| Industry / Year / Region | Yes |
| N | 10129 |
| Adj.R2 | 0.271 |
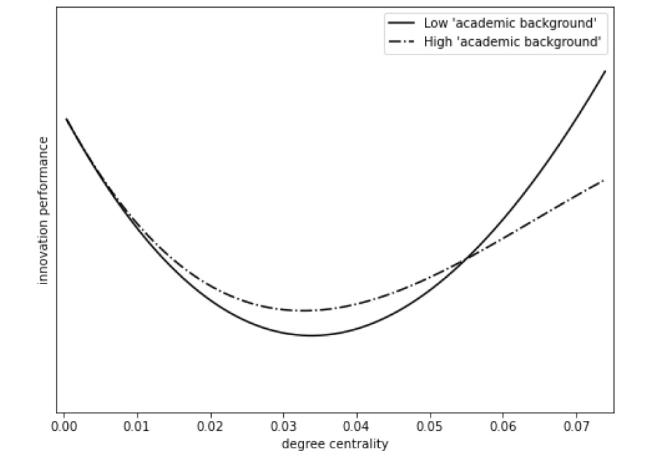
In order to further characterize the moderating effects of executive academic background, this paper plots the moderating effects of the synergistic variables, as shown in Figure 3. Based on Zhang and Wang’s work (2017), we calculate the mean and standard deviation of executives’ academic experience, using the mean minus the standard deviation to represent low academic background, and the mean plus the standard deviation to represent high academic background. The “U-shaped” relationship between high levels of academic background is more moderate than that between low levels of executive alumni networks and firm innovation, and the turning point is moving to the left.
Figure 3. Moderating effect plot. |
4.3.2 The impact of academic papers and scientific publications of provincial universities on firm innovation
To further explore the mechanism through which university knowledge spillovers affect corporate innovation, this paper follows Zhang’s (2017) approach by classifying firms based on the centrality of their executive alumni networks for comparative analysis. The rationale behind this classification is that the impact of academic achievements may vary across firms with different levels of alumni network centrality. By categorizing centrality into different levels, it becomes possible to assess whether the significance of knowledge transfer mechanisms differs depending on the strength of the alumni networks.
The regression results of the number of academic papers and the number of scientific and technical publications of the universities in the provincial region, categorized by low, medium, and high executive alumni networks centrality, on firm innovation are shown in Table 7. The regression coefficient under the high alumni networks position is 0.618 and significant at a 1% level (Column 3), while the regression coefficients of the number of academic papers from universities in the province at low and medium positions (Columns 1 and 2) are insignificant; the coefficient is -0.011 at the low alumni networks position. This suggests that academic papers promote innovation in provincial enterprises, and the higher the centrality of the alumni networks, the stronger the positive effect of academic papers on enterprise innovation. Thus, hypothesis H3a is confirmed.
Table 7. Regression result of papers and Scientific & technical writings. |
| Variables | Innovation | |||||
|---|---|---|---|---|---|---|
| (1) Low | (2) Medium | (3) High | (4) Low | (5) Medium | (6) High | |
| papers | -0.007 | 0.315 | 0.616*** | |||
| (-0.09) | (1.40) | (2.58) | ||||
| Scientific & technical writings | 0.139** | 0.189* | -0.042 | |||
| (2.27) | (1.77) | (-0.37) | ||||
| Constant | -1.373 | -2.952 | -10.213*** | -1.997 | -.625 | -3.611** |
| (-0.84) | (-1.06) | (-3.39) | (-1.39) | (-0.36) | (2.03) | |
| Control | Yes | Yes | Yes | Yes | Yes | Yes |
| Industry / Year | Yes | Yes | Yes | Yes | Yes | Yes |
| N | 3886 | 3124 | 3119 | 3886 | 3124 | 3119 |
| Adj.R2 | 0.203 | 0.262 | 0.269 | 0.205 | 0.263 | 0.265 |
However, contrary to the academic papers of provincial universities, the regression coefficient of the number of scientific and technological works of universities on enterprise innovation is significantly positive in the low and medium alumni networks position group, with coefficients of 0.137 and 0.186, respectively. The significance degree of the low position group is higher than the significance degree of the medium position group (significant at the 5% level and significant at the 10% level). This indicates that the lower the location of the center of the alumni networks where the enterprise is located, the better the promotion of scientific and technological publications of colleges and universities on the innovation performance of the enterprise, and hypothesis H3b is confirmed.
4.3.3 The impact of patent knowledge spillovers from provincial universities on firm innovation
Unlike academic papers and scientific works, university patents contain innovation elements that are closer to the market. However, the protection of intellectual property rights may increase the cost for enterprises to absorb these elements. Columns (1)-(3) of Table 8 show the regression results of the provincial university invention patent applications and enterprise innovation that are in the low, medium, and high positions of the alumni networks, and the regression coefficients of the three positions are 0.118, 0.279 and 0.110, respectively. The regression coefficients of the low and middle positions are significant at the 5% level and 1% level, respectively, and the positive correlation of the high position is not obvious, so hypothesis H3d is confirmed.
Table 8. Regression result of patent applications and transformations. |
| Variables | Innovation | |||||
|---|---|---|---|---|---|---|
| (1) Low | (2) Medium | (3) High | (4) Low | (5) Medium | (6) High | |
| patent_applications | 0.123** | 0.288*** | 0.115 | |||
| (2.02) | (3.12) | (1.21) | ||||
| patent_transfers | -0.007 | -0.018 | -0.046* | |||
| (-0.36) | (-0.78) | (-1.93) | ||||
| Constant | -2.323 | -2.058 | -4.735** | -1.377 | 0.298 | -3.568** |
| (-1.56) | (-1.13) | (-2.54) | (-0.96) | (0.18) | (-2.10) | |
| Control | Yes | Yes | Yes | Yes | Yes | Yes |
| Industry / Year | Yes | Yes | Yes | Yes | Yes | Yes |
| N | 3886 | 3124 | 3119 | 3886 | 3124 | 3119 |
| Adj.R2 | 0.205 | 0.266 | 0.266 | 0.203 | 0.262 | 0.268 |
Columns (4)-(6) of Table 8 present the regression results for patent transfers from provincial universities at low, medium, and high positions within the executive alumni networks and their impact on enterprise innovation performance. The regression coefficients for the three positions are -0.007, -0.017, and -0.046, respectively. The negative effect of provincial university patents on enterprise innovation is significant at the 10% level for the high-position group. However, the negative effect of provincial university patents at low and medium positions has an inhibitory impact on enterprise innovation, although it is not statistically significant. This indicates that the higher the degree of patent transfers of provincial universities, the more obvious the inhibitory effect on the innovation performance under the high alumni networks position, and hypothesis H3c is confirmed.
5 Conclusion and future work
Networks have been recognized as an important conduit for innovation. In this paper, unlike most studies that examine the linear effects of the executive alumni networks on firm innovation, we explore the “U-shaped” influence of network centrality within executive alumni circles on firms’ innovation output. At the same time, the study probes the impact of regional knowledge spillover on the innovation performance of firms positioned in varied centrality of executive alumni networks. It also considers the moderating role of executives’ academic experiences in this “U-shaped” dynamic. The study arrives at distinct scholarly conclusions through this multifaceted analysis:
(1) The study identifies a “U-shaped” relationship between the centrality of executive alumni networks and firm innovation. Initially, an increase in centrality has a negative impact on innovation performance. However, over time, this impact shifts to a positive one. Notably, in certain high-technology sectors, the centrality of executive alumni networks has advanced to the positive inflection point of the “U-shaped” curve.
This “U-shaped” phenomenon can be attributed to executives balancing isolation and collaboration and managing the tension between informational barriers and the flow of resources at varying levels of network centrality. For firms to capitalize on the utmost capabilities of alumni networks in bolstering innovation performance, they must develop effective strategies.
(2) The academic experience of executives holds the potential to moderate the “U-shaped” correlation between the network’s centrality and the firm’s inventive output. This insight enriches the understanding of the interplay between the pivotal roles in executive alumni networks and the innovation performance of enterprises.
(3) The investigation further shows that the higher the firm’s position within the core of the alumni networks, the stronger the positive impact of academic publications from provincial universities on firm innovation. On the other hand, when firms are in more peripheral positions in the network, the influence of scientific and technological publications from these universities on firm innovation performance is greater.
This variation can be attributed to the mechanisms of information access and spreading. Firms at the central nodes of the executive alumni networks are likely to engage in deeper cooperation with universities, making academic papers more effective in improving their innovation quality. On the other hand, scientific & technical writings, being more basic, may not directly align with the strategic needs of these centrally positioned firms, but they can still provide valuable insights for firms with lower centrality in the alumni networks.
(4) The study finds that the inhibitory effect of patent transfers from provincial universities on firm innovation performance is more pronounced for enterprises with a higher centrality in the alumni networks. Conversely, for firms in middle or lower positions within the alumni networks, the invention patent applications from provincial universities tend to have a stronger promotional effect on innovation performance.
This disparity arises because firms positioned lower within the network have fewer alumni resources and rely more on the diffusion of innovative insights from regional academic institutions. However, firms with a more central role in the network, hence by substantial alumni ties, command enhanced access to proprietary patent intelligence, thus mitigating the significance of academic knowledge dissemination on their innovative capacity. Moreover, the sharing in patent systems may render a firm’s proprietary insights vulnerable to appropriation by rivals, impinging on their innovative competency.
Future research could further explore the endogeneity issue arising from bidirectional causality, as firm innovation may influence the formation and strength of executive alumni networks. While this study mitigates endogeneity concerns by controlling for various factors and employing fixed effects, future studies could consider using instrumental variable methods to establish causality better. Additionally, while this study verifies a positive “U-shaped” relationship between executive alumni networks centrality and firm innovation performance, future research could investigate more complex patterns, such as “N-shaped” or “inverted N-shaped” relationships, by incorporating higher-order terms to capture potential additional turning points in the effect of network centrality on innovation.
Funding information
This work was supported in part by the National Natural Science Foundation of China under Grant No. 72264036, in part by the West Light Foundation of The Chinese Academy of Sciences under Grant No. 2020-XBQNXZ-020, and Xinjiang University of Finance and Economics Postgraduate Innovation Project XJUFE2024K036.
Author contributions
Jinzhong Guo (guojz@xjufe.edu.cn): Conceptualization (Equal), Funding acquisition (Equal), Project administration(Equal), Supervision (Equal), Writing - review & editing (Equal);
Jianan Liu (liujn9909@163.com): Data curation (Equal), Formal analysis (Equal), Methodology (Equal), Software (Equal), Writing - original draft (Equal);
Moxin Li (18236471198@163.com): Formal analysis (Equal), Investigation (Equal), Validation (Equal), Writing - review & editing (Equal);
Xiaoling Liu (teach_liu@163.com): Funding acquisition (Equal), Methodology (Equal), Resources (Equal), Validation (Equal), Writing - review & editing (Equal);
Chengyong Liu (2094695159@qq.com): Funding acquisition (Equal), Methodology (Equal), Resources (Equal).