

1 Introduction
Over the past decade, human-centric computer vision tasks, such as pedestrian detection, have gained popularity (Benenson et al., 2015; Dollar et al., 2011). Applications such as automated driving systems (Cao et al., 2021) in autonomous vehicles rely on accurately perceiving pedestrians. However, specifying precise criteria for recognizing pedestrians remains challenging (Salay & Czarnecki, 2019). Human drivers intuitively recognize different types of pedestrians (e.g., those with different clothing or objects) by associating each instance with their prior knowledge of the concept. While detecting pedestrians is often easy for humans, defining them in natural language is more challenging. For example, describing a pedestrian as “a person walking on foot on the sidewalk” excludes variations such as a person on a bicycle, a person jogging, or a person jaywalking. We refer to these broadly varying concepts, which are difficult to specify precisely, as hard-to-specify concepts.
To address the challenge of programming hard-to-specify concepts, Deep Learning (DL) algorithms have been widely used for pedestrian detection tasks (Brunetti et al., 2018; Park & Goel, 2021; Soares et al., 2019) due to their capability to learn from a collected set of example data. However, this reliance makes AI systems particularly sensitive to dataset quality (Hasan et al., 2021), as their perception is based entirely on the limited samples in the training dataset.
In addition to initial specification challenges, domain concepts are prone to concept drift, where key attributes change over time (Tsymbal, 2004). For example, during COVID-19, facial recognition algorithms had to adapt to recognize masked faces, adding “facial masks” as a new attribute. If concept drift is not managed, the predictive power of DL models deteriorates, leading to misclassification. For example, AI-based pedestrian detectors might struggle to recognize children in Halloween costumes. Google (ABCNews, 2015) addressed this by having employees’ children in costumes walk past self-driving cars, enabling the AI to recognize children even in unusual outfits, thus improving classification accuracy and safety.
AIS performance in visual perception heavily depends on the accuracy of training data in representing diverse concept instances. However, collecting and labeling datasets is expensive and time-consuming, resulting in datasets that are infrequently updated (Tsymbal, 2004). As domain concepts evolve, DL models trained on older datasets require frequent adaptation, a process known as adaptive learning (Gama et al., 2014).
This study proposes a framework to automatically detect drift in domain concepts, addressing the issue of outdated information in AIS. The framework continuously extracts up-to-date domain knowledge from daily-updated sources, compares it against the training data, and detects significant drifts in AIS primary domain concepts early on, before they affect classification ability. We present an iterative process for the automotive domain, focusing on pedestrian detection essential for the success of automated driving systems. This approach compensates for concept drift by partially specifying hard-to-specify concepts and continuously monitoring changes in the most relevant features.
2 Related work
Concept drift detection and adaptation techniques are domain-specific and vary in each application domain. Here, we summarize the research work that we found relevant.
2.1 Concept drift on Twitter data
Social media platforms, such as Twitter, provide a rich source of evolving discussions, which can be leveraged for concept drift detection. Shahzad and Alhoori (2022) demonstrated how Twitter can reveal shifts in public perception towards scientific research, reinforcing the potential of social media as an indicator of evolving concepts in AI-driven systems. Lifna and Vijayalakshmi (2015) collected 30,000 tweets for over a month using Twitter’s API and made topics on tweets by grouping them into four classes: Politics, Entertainment, Foreign Affairs, and General. They as-signed a weight-age parameter for each class and used varying window sizes of 10, 20, 30, and 100 minutes for the tweets and built the models.
Bechini et al. (2021) performed an experiment with tweets on vaccination topics in Italy using common methods, such as static and retrain learning. In static learning, the model is trained once new tweets are classified and added to the dataset. This approach minimizes the cost but does not detect any change. In the retrain learning approach, the model is retrained with the incoming data and is better at detecting concept drift. As the models are frequently retrained, the computation cost is extensive. The authors proposed a semantic learning technique containing a set of labeled tweets called a train pool. Each new tweet is evaluated for its similarity with the train pool to be given a weight. The model is retrained based on the weighted samples. The authors specified that semantic learning performed better in detecting concept drift.
Costa et al. (2014) predicted the hashtag of each tweet based on its text by using techniques such as the time window approach (select tweets based on time window), incremental approach (learning and retraining), ensemble approach (combining the different predictions) trained on a set of time windows. Li et al. (2016) built ML models that classify reshare and popularity scores based on concept drift. These models predict the popular (continuous/periodically resharing) content on Twitter and Plurk. They found that the two important features of models were information diffusion and explicit multimedia meta-information. Deshpande and Narasingarao (2019) built an ML model to detect the concept drift on about 40,000 tweets after the Indian government announced three new policies. They used weight-based features (documents are given weight as per the words in the document, which is known as term frequency) and n-gram methodology in feature extraction of the data.
2.2 Detecting concept drift
Nishida and Yamauchi (2007) proposed a drift detection method called the “Statistical Test of Equal Proportions” (STEPD). This methodology is based on comparing two accuracies: recent accuracy (for some recent X samples) and overall accuracy (accuracy from the beginning of learning). A significant decrease in these accuracies indicates that there has been a drift.
Drift Detection Method (DDM) uses the error rate in detecting the concept drift, while Early Drift Detection Method (EDDM) (Baena-Garcıa et al., 2006) is based on the comparison of the distribution of distances between the classification errors. EDDM is better able to detect drift than DDM on datasets that have gradual(slow) drift. Cabral and Barros (2018) used three variations of Fisher’s test to detect concept drift. The evaluation results showed that all three variations of the Fisher’s test detected the drift with higher accuracy.
Harel et al. (2014) proposed a method for concept drift detection using the prediction loss distribution and reusing the data multiple times through resampling. In comparison with DDM, EDDM, and STEPD methods, this method achieves higher recall and precision values and is shown to be more robust to noisy data. To detect gradual concept drift, Dries and Ru¨ckert (2009) proposed statistical tests, adapting to data and updating faster when the detection window moves. Linear Four Rates (LFR) (Wang & Abraham, 2015) is another technique used to detect concept drift and identify data points that belong to the new concept. The LFR framework keeps track of the changes in True Positive (TP), True Negative (TN), False Positive (FP), and False Negative (FN) rates given by the classifiers.
Hinder et al. (2024) provided a comprehensive survey on unsupervised drift detection methods with a particular focus on applications in security and infrastructure monitoring. They offer a detailed taxonomy of detection techniques, such as two-sample tests and block-based methods, highlighting the importance of identifying concept drift without relying on labeled data. Their work emphasized the growing need for systems capable of monitoring evolving environments while maintaining operational accuracy.
In the context of deep learning frameworks, Xiang et al. (2023) categorized concept drift adaptation methods into four primary categories: discriminative learning (e.g., multilayer perceptrons, convolutional neural networks), generative learning (e.g., generative adversarial networks, autoencoders), hybrid learning, and other approaches like deep reinforcement learning and deep transfer learning. Their literature review demonstrates that different types of learning models offer varying levels of adaptability to drift, but challenges remain, particularly in real-time drift adaptation for deep learning models in high-dimensional data environments.
Xu et al. (2023) addressed concept drift in IoT systems by introducing the ADTCD framework, which combines a teacher-student model with one-class SVM for anomaly detection and drift filtering. The framework’s dynamic parameter adjustment mechanism allows real-time adaptability, making it robust against changes in data distribution, a key requirement in IoT environments where data streams are volatile and subject to frequent drifts.
In process mining, Adams et al. (2023) proposed a framework to detect and explain concept drift through the construction of a time series of process metrics. Their framework identifies drift points and correlates them with potential root causes using both linear and non-linear relationships, especially in object-centric event data. The explainability feature of their framework allows businesses to not only detect when and where drifts occur but also uncover the reasons behind these changes, which is crucial for decision-making in dynamic business processes.
Halstead et al. (2023) introduced the FiCSUM framework, which leverages a diverse range of meta-features to detect recurring concept drift in data streams. By integrating both supervised and unsupervised meta-features, FiCSUM constructs a comprehensive concept fingerprint that improves the detection and re-identification of recurring drift. Their approach, which dynamically selects the most relevant meta-features, has shown significant accuracy improvements and can be generalized across various datasets, offering a robust solution for recurring drifts in real-time data streams.
Collectively, these studies highlight the diverse approaches to handling concept drift across multiple domains, from deep learning and IoT to process mining. While significant progress has been made in detecting and adapting to concept drift, challenges remain in ensuring real-time adaptability, explainability, and efficiency, particularly in high-dimensional and evolving data environments. The discussed detection techniques are only based on a proportion of the occurrences of the terms in a system, and therefore, only their partial changes are assessed. As such, the main question of “the drift relevancy to the concept” is left unanswered because the drift needs to be evaluated once it is relevant to the domain concepts. Instead, our proposed framework initially highlights the semantically relevant topics to the concept to exhibit the drift.
3 Concept drift: Background, challenges, and our approach
3.1 Concept drift
Deep Learning models assume constant input and output data distribution post-training. However, in real-world applications like image recognition, this assumption is often violated due to dynamic concept semantics, leading to changes in data distribution. Concept drift, where the relationship between input data and class labels changes over time, poses a significant challenge to supervised learning in non-stationary environments. This requires regular model updates to reflect domain changes (Tsymbal, 2004).
Concept drift refers to changes in the conditional distribution of the output given an input, even if the input distribution remains unchanged (Gama et al., 2014). It includes qualitative and quantitative measures such as types of drift (e.g., class drift, covariant drift) and properties like magnitude, duration, path length, and drift rate (Webb et al., 2016).
Current techniques for handling concept drift include: 1) instance selection, which uses a sliding window to select the latest data and build a model; 2) instance weighting, in which data instances are weighted based on their age and relation to the current concept; and 3) ensemble approaches, which uses DL ensemble models to learn and detect concept drifts. The problem with these methods is that they detect drift only after it occurs. Our approach, built on semantics, can anticipate concept drift early based on semantic changes, allowing us to address the drift before AIS performance is compromised.
To clarify the problem of concept drift, we formalize it as follows. Let x ∈ RD be a data sample in a D-dimensional space, where D is the number of features describing x (f1, ..., fD). An optimal classifier assigns x (f1, ..., fD) → Ci, where C1, C2, ..., Cm are the existing class labels. Probabilistic classifiers select a label with the highest probability by predicting a distribution for P(X|Ci) over all classes i = 1, ..., m. For example, the naive Bayes classifiers use Bayes’ theorem to compute probabilities as:
$P\left(C_{i} \mid X\right)=\frac{P\left(X \mid C_{i}\right) P\left(C_{i}\right)}{P(X)} $
Assume tj and tj+1 are two points in time. In this context, we define concept drift as:
$\exists X \in R^{D} \mid P\left(X, C_{i}\right)_{t_{j}} \neq P\left(X, C_{i}\right)_{t_{i+1}}, i=1, \ldots, m $
where P(X, Ci) represents the joint probability distribution for X and Ci. Thus, the concept drift may happen due to changes in P(Ci), P(Ci|X), P(X|Ci), or P(X). These changes are inter-related. For example, P(Ci) cannot change without either P(Ci|X) or P(X) changing. It is also worth noting that a change over time in any of the aforementioned aspects of distribution requires a change in P(X, Ci).
While some studies suggest that, in the context of classification, a change in P(Ci|X) (i.e., class drift) is the primary reason for concept drift, others argue that changes in P(X) (i.e., covariate drift) are as important in drifting a concept (Kelly et al., 1999; Tsymbal, 2004). Here, we summarize both of these.
3.1.1 Class drift (Changes in P(Ci|X))
Although there are various definitions, interpretations, and constraints for class drift, we adopt Gama’s definition (Gama et al., 2014). We refer to class drift (i.e., real concept drift) when the posterior probability of X belonging to Ci changes over time, and these changes are not due to alterations in the attributes of input data X. To formally specify:
$\exists X \in R^{D} \mid P\left(X, C_{i}\right)_{t_{j}} \neq P\left(X, C_{i}\right)_{t_{j+1}}$
For example, a school’s acceptance criteria may change over time, leading to changes in the set of student attributes associated with the class accepted.
3.1.2 Covariant drift (Changes in P(X))
In contrast to class drift, covariant drift considers changes only in P(X):
$\exists X \in R^{D} \mid P(X)_{t_{j}} \neq P(X)_{t_{j+1}}$
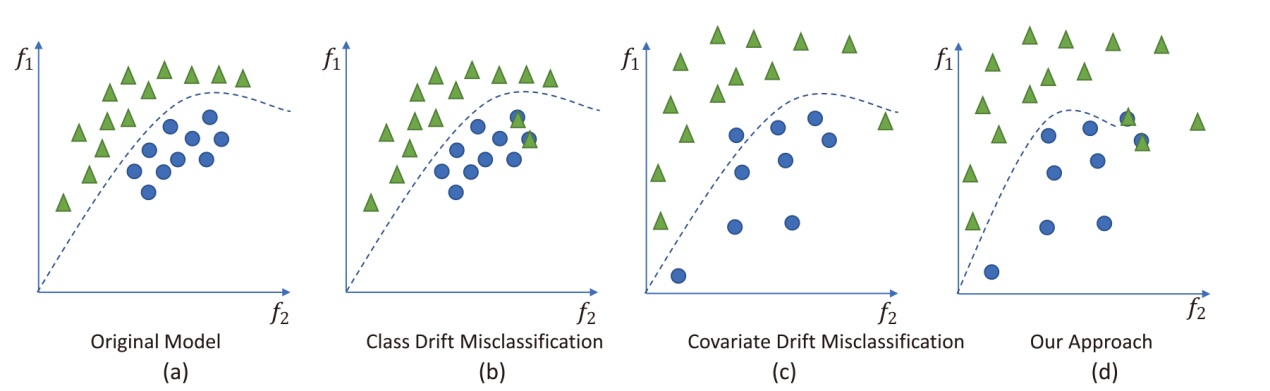
For example, assume that a school uses socio-economic factors to accept students. Over time, the demographics of the student base may change, leading to a change in the probability of each demographic factor. Figure 1 shows the classifications under class drift, covariate drift, and our proposed approach. The triangles and circles represent instances of two different classes. Figure 1(a) shows the original model with no drift, correctly classifying instances. Figure 1(b) shows misclassification due to class drift, where class distributions change over time. Figure 1(c) shows misclassification caused by covariate drift, where input feature distributions change. Figure 1(d) shows our approach, which anticipates drift and maintains accurate classification.
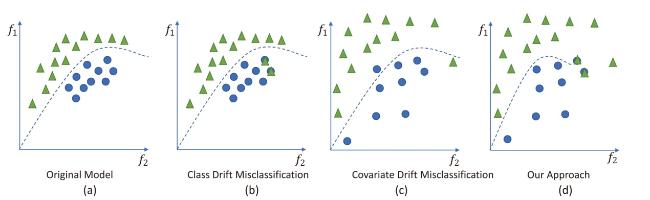
Figure 1. Class and co-variant drifts and how our approach tends to eventually address the domain concept drifts in AIS. |
Problem restatement: In our approach, Ci refers to the concept pedestrian CP, and X represents instances of pedestrians with various appearances. A reliable autonomous vehicle object detector must classify diverse-looking instances of Xs as CP accurately over time. As pedestrian appearances X vary, P(X) changes, leading to changes in P(Ci|X). The model’s unawareness of these changes results in less accurate detection. For example, pedestrian recognition in autonomous vehicles becomes more challenging during Halloween due to the wide range of costumes worn by pedestrians.
Solution restatement: Figure 2 demonstrates the proposed approach. Initially, we anticipate X (concept-related features) whose drift signals a concept drift. We calculate the current state and significant changes of X within a social context as a probability density function, P(X), and monitor it for anomalies. This approach aims to maintain P(CP|X) (∀x ∈ X) stability over time by adjusting the DL model as needed. We use social sources like news feeds and social media to predict changes in X, enabling us to anticipate covariate drift before it leads to class drift. This proactive approach allows us to adapt the DL model to preserve detection accuracy before significant drift interferes with AIS visual perception tasks.
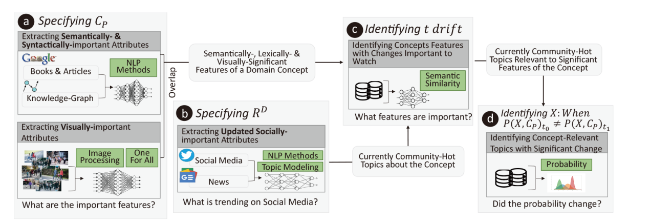
Figure 2. High-level overview of our iterative process. |
As illustrated in Figure 3, this study primarily focuses on predicting concept drifts in domain-specific concepts using an integrated approach that combines natural language processing (NLP) and image analysis. By identifying and quantifying the probability shifts in relevant domain features over time, we anticipate potential virtual concept drift before it impacts AI-driven decision-making.
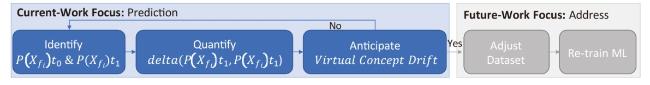
Figure 3. Current research focuses on the prediction of concept drift, while future work aims at addressing the drift. |
Our future work will extend this research to mitigate concept drift through proactive interventions. Specifically, we aim to adapt the training dataset dynamically by employing strategies such as training set selection, training set manipulation, and feature set modification (Barzamini et al., 2022; Perez & Wang, 2017; Zhang et al., 2021). These adjustments will allow for targeted retraining of deep learning models to maintain robustness against evolving domain shifts. This two-step framework, anticipation followed by adaptation, ensures that AI systems can respond to changing real-world conditions with minimal manual intervention.
3.2 A motivating example
We selected March 18, 2018, as a potential concept drift date due to a fatal incident involving a self-driving Uber vehicle in Arizona (New York Times, 2018). The goal is to verify the hypothesis that specific events cause significant changes in the probability distribution of relevant terms over their semantic and lexical features. Term frequency was selected as the primary lexical feature for this analysis.
We used a topic modeling algorithm, Latent Dirichlet Allocation (LDA) (Blei et al., 2003), on Twitter content from one month before to one month after the accident. LDA discovers latent semantic structures in text by grouping semantically similar terms under abstract topics. The following sections describe our systematic process for dynamically identifying concept drift.
We selected the top 10 clusters (Kanungo et al., 2002; Wagstaff et al., 2001) with the highest cosine similarity (Rahutomo et al., 2012) to the search query “pedestrian safety.” By visualizing the term frequencies within each cluster, we observed a sudden spike in term frequency on the date of the selected event. Figure 4 illustrates this finding.
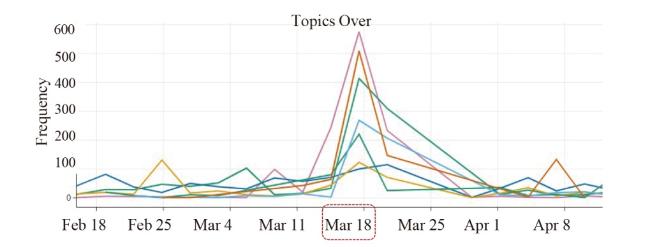
Figure 4. Sudden drift in P(X): The frequency of pedestrian safety-related topics, on March 18, 2018, the day a self-driving Uber ran over a pedestrian in Arizona. |
This approach is not aimed at predicting sudden, unpredictable events like car accidents. Instead, it focuses on events for which we can gather social information beforehand. The car accident example was chosen to highlight how such incidents can shift social discussions towards pedestrian safety, demonstrating the concept drift phenomenon.
4 Concept drift specification and analysis
4.1 Defining pedestrian concept features (CP)
In Figure 2a, to demonstrate our research idea, we selected CP to represent the concept “pedestrian” from the automotive domain. CP is essential for vision-based perception in autonomous vehicles. The challenge is in the limited human ability to intuitively define concepts like “pedestrian” for computers. A typical solution is data-driven training. However, the model’s quality depends on the diversity of the training set representing various pedestrians the AI might encounter.
We implemented two automated processes to iteratively retrieve linguistic and visual information from available sources. Linguistic data were processed using natural language processing (NLP) techniques to identify terms important to humans for describing concept variants. Simultaneously, image processing techniques were applied to a large set of images and videos to extract visually significant features of these concept variants. Although this paper uses the automotive domain and pedestrians as examples, the framework employs generic and domain-agnostic processes.
4.1.1 Linguistically-important features
To describe hard-to-specify concepts that lack domain-specific documents, we used human perception as a reference model. We mined knowledge-sharing platforms, such as news feeds, online books, and encyclopedias, to identify linguistically relevant terms. To identify terms closely related to the concept, we used the following three sets:
(A) Co-occurrence frequency of the concept (lexical analysis): We utilized the Google Books database, a vast digital library containing over 40 million books and magazines, to retrieve relevant sources of up-to-date information. To avoid obsolete data, we selected books printed between 1,800 and 2,000 in American English. Using Ngram Viewer (Google Books, 2024), a word frequency visualization tool, we searched the corpus to identify common attributes associated with the term “pedestrian.” Our search queries included combinations such as “pedestrian + [noun],” “[noun] + pedestrian,” “pedestrian + [verb],” and “[verb] + pedestrian.” Table 1 lists the nouns and verbs that appear immediately before or after “pedestrian” from the Google Books corpus. To capture relevant terms that do not appear immediately adjacent to “pedestrian,” we also searched for terms occurring up to four words apart.
Table 1. Top five words returned by different search queries on Google Books N-gram. |
| “pedestrian” + [verb] | “pedestrian” + [noun] |
|---|---|
| pedestrian crossing | pedestrian traffic |
| pedestrian walks | pedestrian mall |
| pedestrian killed | pedestrian bridge |
| pedestrian pass | pedestrian street |
| pedestrian moving | pedestrian zone |
| [verb] + “pedestrian” | [noun] + “pedestrian” |
| protect pedestrian | child pedestrian |
| warn pedestrian | adult pedestrian |
| hurrying pedestrian | level pedestrian |
| involving pedestrian | street pedestrian |
| encourage pedestrian | block pedestrian |
(B) Semantic similarity: We extract the latest domain specifications and attributes from news websites, using semantic similarity to identify attributes related to “pedestrian.” We used Genism’s pre-trained Word2vec models to compute semantic similarity scores. These models generate word embeddings by converting a large text corpus into a vector space, with each unique word assigned a corresponding vector. Words with similar contexts are positioned closely in this space, enabling us to identify terms that are semantically similar to “pedestrian.”
(C) Knowledge-Graph based terms (association): To compensate for missing terms, we combined word embeddings from distributional semantics (e.g., Word2vec) with knowledge from dynamic sources like ConceptNet. This knowledge graph integrates information from WordNet, Wiktionary, OpenCyc, and DBPedia. It is an open-access multilingual graph of general knowledge, drawing from crowdsourcing and expert-created dictionaries, encyclopedias, and glossaries.
We collected 3,273 terms from the aforementioned sources. After text preprocessing, which included removing duplicates, extra spaces, special characters, and numbers, we obtained 1,207 terms. Table 2 shows some examples. We calculated the semantic similarity of each term with “pedestrian” and ranked them by similarity scores. Only the terms in the top quartile, which were the most semantically similar and relevant to the concept, were retained for the study. After reducing the terms to their base forms through stemming, we had 230 unique words.
Table 2. Top ten similar words to pedestrian from Wikipedia and Google News corpora. |
| Wiki terms | Similarity | Google terms | Similarity |
|---|---|---|---|
| walkway | 0.6928 | bicyclist | 0.6166 |
| lanes | 0.6808 | crosswalk | 0.5942 |
| sidewalks | 0.6572 | motorist | 0.5460 |
| roadway | 0.6411 | bike lanes | 0.5416 |
| vehicular | 0.6380 | pedestrian walkways | 0.5328 |
| thoroughfare | 0.6337 | bicycle lanes | 0.5256 |
| subway | 0.6296 | bikeway | 0.5248 |
| underpass | 0.6193 | traffic calming | 0.5239 |
| overpass | 0.6157 | roadway | 0.5181 |
| parking | 0.6129 | traffic | 0.5173 |
4.1.2 Visually-important features
While the retrieved features are semantically important to the meaning of “pedestrian,” only those that affect AIS visual perception are relevant. Changes in features that are not visually focused on by the model do not necessarily impact AIS vision and are, therefore, not of interest. Thus, we identify and monitor linguistically important features that also visually impact AIS perception for significant drifts.
We utilized visual sources to identify concept-relevant features recognizable by AIS. Specifically, we selected the Wikipedia-based Image Text Dataset (Srinivasan et al., 2021), which contains 37.6 million image-text samples. For our experiment, we used 5,411,978 entries with English captions. We computed the similarity score of each image caption with the concept of pedestrian. We then selected approximately 25% of the images based on caption similarity, resulting in 1,355,838 text-image entities.
To identify features that are both semantically and visually significant, textual and visual data must be in a consistent format. Therefore, AIS visual perception of images was initially converted into natural language words and phrases.
Despite the success of Region-Based Convolutional Neural Networks (R-CNN) in object detection, they are typically computationally expensive (Ren et al., 2016). Faster R-CNN addresses this by replacing the selective search algorithm with a region proposal network, reducing the number of proposed regions while ensuring precise detection. We adopted the Faster R-CNN model (Ren et al., 2016) as our object detector, equipped with a ResNeXt-101-FPN backbone (Barzamini et al., 2022; Lin et al., 2017; Xie et al., 2017), with a batch size of 8, and an initial learning rate of 8×10³. Faster R-CNN is originally trained on the COCO dataset for object detection.
To generate image captions, we adopted the multimodal model “One for All” (Wang et al., 2022). This model integrates various cross-modal and unimodal tasks (e.g., image generation, visual grounding, image captioning) using 20 million publicly available image-text pairs for pretraining. We fine-tuned the model on a subset of pedestrian images from the Wikipedia-based Image Text dataset. Figure 5 shows examples of Faster R-CNN object detection and “One for All” caption generation tasks on two pedestrian images. The outcome of this step was 3,671 image captions. Each caption contains multiple terms(words). These terms were used to calculate similarity scores with the concept of “pedestrian.” The most significant terms related to “pedestrian” were then selected.
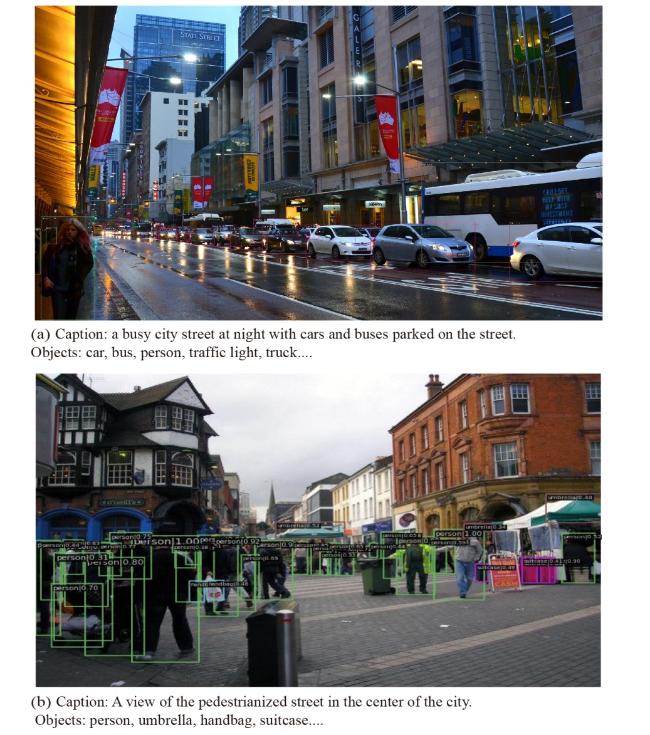
Figure 5. Model-generated captions and detected objects. |
4.1.3 The overlap
The results from both the natural language and image processing phases were passed through a common preprocessing phase. This phase removed digits, stop words, and duplicates, resulting in 1,679 visually significant terms and 230 semantically significant terms related to the concept of “pedestrian.”
We used Sentence-BERT, a Python framework with pre-trained models, to calculate the semantic similarity score for each visually and linguistically relevant term. This resulted in 386,170 (cross product of 1,679 × 230) similarity scores, with a mean of 0.2339 and a standard deviation of 0.0821. We then selected the top quartile of these scores, with a minimum score of 0.2793. After removing duplicate terms in the top quartile, we found 1,675 terms that were both visually and linguistically significant to the concept of a pedestrian.
4.2 Community-based context specification (RD)
Figure 2b We used Twitter (rebranded to X) to extract recent contextual information relevant to the concept of “pedestrian” as it reflects common daily conversation topics. Twitter was chosen over other social media platforms like Facebook and Instagram because it is primarily used for sharing ideas and thoughts. Additionally, recent account suspensions on Twitter indicate stricter policy controls compared to other platforms.
We selected autonomous driving failures as a potential trigger for concept drift in pedestrian detection. These unpredictable events cannot be prevented, but they provide a relevant scenario for safety analysis. By anticipating sudden changes in pedestrian appearance before they occur, we can prepare the AIS in advance to prevent failures.
4.2.1 Data collection
We collected a large dataset from Brandwatch, an application that collects data from social media platforms like Twitter, Facebook, Instagram, YouTube, Reddit, and Tumblr. This source allows data selection based on language, location, and time duration. We built two major datasets: autonomous vehicle accidents and Halloween events. These events could potentially trigger sudden changes in the “pedestrian” concept, a crucial factor for the safe operation of AIS.
We analyzed three accidents (Table 3) involving self-driving cars and pedestrians to identify any drift in the concept of “pedestrian” during these periods. For each accident, we collected three weeks of data, with the accident date as the median date. Although such events are unpredictable and unavoidable in real life, we selected this scenario to demonstrate its potential to cause a drift in pedestrian-related topics. For this study, we extracted two features: the textual content of each tweet and the time it was posted.
Table 3. Collected datasets for autonomous car accidents. |
| Date | Accident | # Tweets |
|---|---|---|
| 29 July 2016 | Tesla | 89,881 |
| 18 March 2018 | Uber | 119,121 |
| 26 April 2019 | Tesla | 154,916 |
4.2.2 Data cleaning
Social media data are highly susceptible to noise, bias, and redundancy. To ensure high-quality data, we implemented the following rigorous preprocessing steps:
Removing digits:
• All numerical values were removed from posts, as they generally do not contribute meaningful insights for topic modeling.
• Example:
- Before: “4 lessons Apple Car should learn from Tesla”
- After: “lessons Apple Car should learn from Tesla”
Stopword removal:
• We utilized the Natural Language Toolkit (NLTK) library to remove common stopwords that do not contribute to meaningful analysis (e.g., “the,” “is,” “at,” “which,” “on”).
• Example:
- Before: “The government is investigating the design and performance of Tesla’s system.”
- After: “government investigating design performance Tesla system”
Hashtag, mentions, and URL removal:
• Hashtags, user mentions (e.g., @username), and embedded links were eliminated using Python’s regular expression library.
• Example:
- Before: “ajplus: A #Tesla car was driving on autopilot in the first fatal accident of its kind. https://t.co/HCqOjdrvxR”
- After: “A Tesla car was driving on autopilot in the first fatal accident of its kind”
Tokenization and lemmatization:
• Text was tokenized into individual words, and lemmatization was applied to convert words to their root forms (e.g., “walking” → “walk,” “cars” → “car”).
Duplicate and retweet filtering:
• To prevent redundancy, duplicate tweets and retweets were removed to ensure each post contributes unique content to the analysis.
By following this comprehensive data filtering and preprocessing pipeline, we ensured that our dataset was free of extraneous noise, minimized biases, and accurately reflected real-world concept shifts. This systematic approach enhanced the reproducibility of our study and ensured the integrity of the results in the subsequent concept drift analysis. This data cleaning process was applied to both the accident and Halloween data. The accident data were used to develop the methodology, while the Halloween data were used for evaluation.
4.2.3 Structuring the community-based context
To investigate higher-level changes in topics during each event, we built a topic model using collected social data. This model reveals the community’s common conversations before, during, and after each incident by segregating linguistic terms into related topics. We employed BERTopic, a Large Language Model based topic modeling technique that has demonstrated impressive performance in various NLP tasks. Predicting the number of topics in a model is challenging and can vary by year, event, and duration. Therefore, we modeled the retrieved data with 20, 25, 30, and 50 topics for each of the six events, three covering various years of Halloween, and three covering self-driving vehicle accidents. For each event, we selected the optimum number of topics that provide a comprehensive understanding of the dataset. To calculate the drift on similar topics, we built the topic models and split them into three timeframes:
• During the event: A one-week timeframe, including three days before and after the accident date.
• Before the event: The week prior to the event week.
• After the event: The week following the event week.
4.3 Temporal analysis of concept drift (t)
Figure 2c To study concept drift, we tracked the changes of important terms within social conversation topics. The following process was implemented to consistently measure the relevancy of common topics to the pedestrian concept.
4.3.1 Mapping significant features to community topics
For the concept of “pedestrian,” we calculated the semantic similarity between pedestrian features and each topic, considering both linguistic and visual significance. We used Sentence-BERT to map terms to topics. Each dataset (before, during, and after the event) was modeled into an optimal number of topics. A similarity score was computed between each dataset topic and the significant terms related to the concept, which was then used to map each term to the most relevant topic. We calculated $S S(\bar{T})$ as the mean similarity score of concept-related terms to social topics for the before, during, and after periods. This aimed to identify patterns in similarity changes over time. $P(\bar{T})_{F t}$ was defined as the average probability of social topics T containing pedestrian-related features F in time frame t, computed as follows:
$P(\bar{T})_{F t}=\frac{\sum_{i=1}^{T_{t}} \sum_{j=1}^{F} S S\left(T_{i t}, f_{j}\right)}{F \times T_{t}}$
For instance, $P(\bar{T})_{F t}$ of a topic with the terms “collision”, “traffic”, “accident”, “road”, would increase during the timeframe of a car accident.
4.3.2 Identifying significant topic drifts
Figure 6 illustrates the pattern of autonomous Tesla and Uber accidents in 2018 and 2019. Terms defining the pedestrian concept were more prevalent in Twitter conversations during these accidents, but their significance diminished post-event. Interestingly, the Tesla accident on July 29, 2016, was overshadowed on Twitter by discussions about the Tesla and SolarCity merger on July 31, 2016. The unique trend observed during the 2016 Tesla accident was due to a major concurrent event that dominated the discussion topics. This issue can be addressed by filtering topics for relevance. Despite this, the identified trends validated our approach of using social discussion topics to predict sudden concept drifts, which could adversely affect the perception of AI-based software.
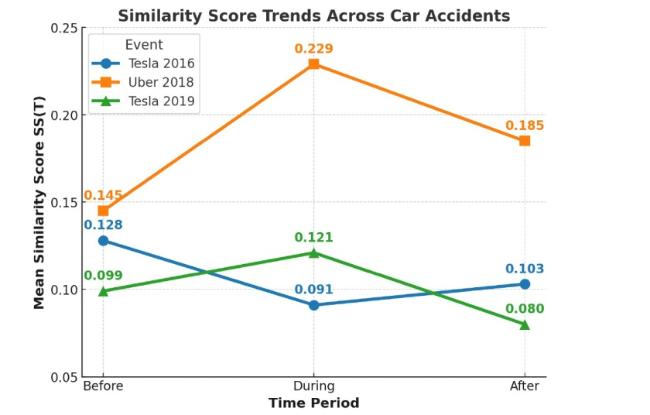
Figure 6. The change in mean similarity scores for “pedestrian” in social topics before, during, and after car accidents. |
4.4 Event-based drift specification (X)
Figure 2d: Finally, to identify ∀x ∈ X where P(x, CP)t ≠P(x, CP)t’, we calculated P(x ∈ X)t for each term in pedestrian-related social topics. This probability indicates whether the occurrence of x significantly changed within the top social conversation topics during each timeframe and was computed as follows:
$P(x \in X)_{t}=\frac{\sum_{i=1}^{T_{t}} O c c(x)_{i t}}{W}$
where Occ(x)t is the frequency of x occurring in each topic, formed in each time frame t, and W is the number of total terms in social topics, formed in time frame t. For example, the probability of a term like “crash” might increase in the event of a car accident.
To understand how the significance of each x changes over time, we computed the probabilities of each x. These probabilities were calculated at three different points: before, during, and after the targeted time frame. We then calculated the probability changes from before to during, during to after, and before to after the incident by finding the differences in probabilities obtained from Equation 6.
Considering the time window of an event’s occurrence as t1, then t0 represents the time window before the event. For simplicity of representation, we refer to the absolute value of P(Xt1) − P(Xt0) as PXt, referring to the probability variance of the terms in X before and during the event.
Assuming P(Xt0) and P(Xt1) for all terms follow a normal distribution, their probability density function resembles the curve in Figure 7. The probability of values within each interval corresponds to the interval’s area under the curve. For example, in a normal distribution, approximately 95.4% of the data typically appear within the µ ± 2σ range. This range represents normal data points. To identify X, we selected terms whose probability changes deviated significantly from most data points. We calculated the mean and standard deviation of these probability differences. The most significant terms, with notable appearance drift, were those whose probability changes fell outside the 95.4% range of the data. The range µ ± 2σ measures these threshold values, as illustrated in lighter blue in Figure 7.
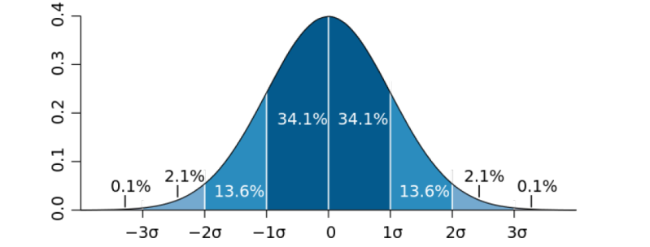
Figure 7. The Gaussian probability density function shows the interval probabilities as areas under the curve. |
To detect significant shifts that are likely to indicate potential sudden concept drifts, we focused on data points that behaved differently from the majority of instances. The terms whose probability variance falls within the same interval as the majority of terms are not of interest. Instead, we are interested in the terms that exhibit higher appearance variance from before to during the timeframes of the incident, as these are relevant to the problem of concept drift.
In a normal distribution, the left and right probability intervals are calculated as:
PXt ≤ µ − 2σ and PXt ≥ µ + 2σ
These terms showed a drastic change in probability during the event. Figure 8 illustrates these terms, with their probabilities before and during the incident shown in blue and orange bars, respectively. During the Tesla accident in 2016, terms such as {acquired, deal, merger, minibus, porsche, shop, solarcity} saw an increase in probability, mainly due to the Tesla and SolarCity merger. In the Uber accident in 2018, terms like {cars, crosswalk, driving, police} increased in probability, directly relating to the accident and pedestrian context. For the Tesla accident in 2019, terms such as {crash, musk, rebuilder, safer, street} showed an increase in probability, also relevant to the pedestrian concept. It is notable that the terms related to the Tesla 2019 and Uber 2018 accidents are closely tied to the concept of pedestrians, whereas the Tesla 2016 terms were more about the business merger than the accident itself.

Figure 8. The set of terms and their probability shifts in the car accident data. |
The remaining terms, with P(Xt0) or P(Xt1) within µ ± 2σ, are still significant and widely discussed on social platforms. However, their probability changes followed the same behavior as the majority (about 95.4%) and thus were not related to the concept changes discussed on social media.
In summary, although car accidents are unpredictable, this example shows the feasibility of identifying concept drift. We specified the concept semantically and visually using common terminology and continuously monitored concept-related features in contexts like news or social media. Sudden shifts in the probability of these features can indicate drift early before it impacts AIS performance.
5 Evaluation
To evaluate our approach, we considered Halloween as an unpredictable event to determine its impact on pedestrian concept drift. Halloween alters pedestrians’ appearances, posing challenges for autonomous pedestrian detection systems due to visual appearance drift.
5.1 Dataset
We collected data from three weeks around Halloween for the years 2017 to 2019, resulting in 40,860, 29,525, and 43,897 tweets, respectively. After preprocessing, we classified data into topics for each period: before, during, and after Halloween.
5.2 Topic drifts
Figure 9 shows the mean similarity scores between pedestrian-relevant topics and daily social topics before, during, and after Halloween in 2017, 2018, and 2019. The x-axis represents the time windows, and the y-axis represents the mean similarity score of pedestrian-related features to these topics. Notable drifts in similarity to the pedestrian concept were evident during Halloween in 2018 and 2019, indicating an increased discussion of the concept during the event. These drifts highlight the need for human analysts to investigate concept changes and determine whether they require addressing within the AI model. Significant visual drifts may necessitate incorporating pedestrian costumes into the training dataset and fine-tuning the AIS.
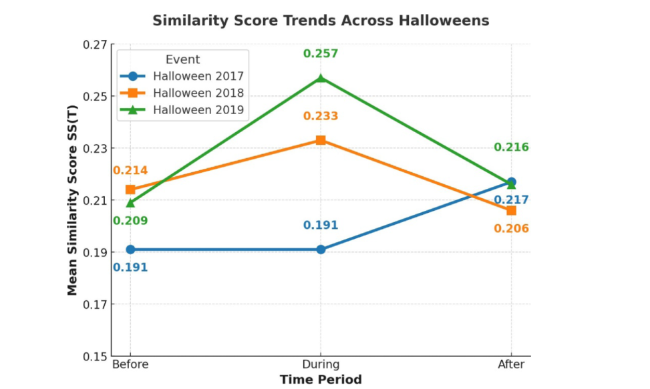
Figure 9. The change in mean similarity scores for “pedestrian” in social topics before, during, and after Halloween. |
The 2018 and 2019 Halloween trends show increased relevance of pedestrian-related terms during the event, which subsequently decreases afterward. In contrast, the 2017 Halloween data is dominated by attack-related tweets due to a terrorist attack in New York City, overshadowing pedestrian-related discussions. Despite this, the extracted data still provide insights into the dominant incident and suggest potential feature removal to retrieve pedestrian-related information.
5.3 Specifying X
In Figure 10, during Halloween 2017, 2018, and 2019, terms like {nyc, shouted, truck}, {halloween, kids, safe, streets}, and {detection, dusk, safe, trooper} are identified due to their sudden increase in social topics. These changes draw attention to concept drift early, allowing potential issues to be addressed before AIS failure occurs.
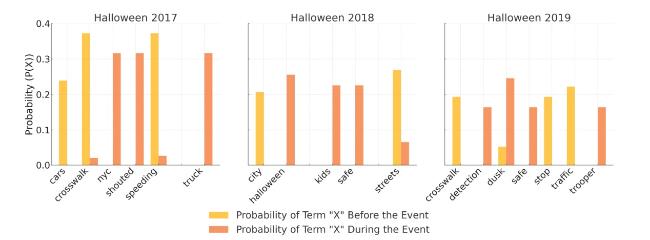
Figure 10. The set of terms and their probability shifts in the Halloween data. |
6 Generalizability of the framework
To evaluate the generalizability of our framework, we extended the experiment by applying the same methodology to a different domain and social media platform. While the original study focused on the “pedestrian” concept in autonomous vehicles using Twitter data, we now analyze the “airplane” concept in aviation incidents using GDELT (Global Database of Events, Language, and Tone). This extension allows us to assess whether the framework remains effective across different domains while maintaining the same processing steps.
6.1 Experimental setup
We selected three major airplane crash events: the California crash (2020), the Washington crash (2022), and another Washington crash (2025), as shown in Table 4. As in the original study, we analyzed the before, during, and after periods of each event, spanning one week each. GDELT provided a vast collection of news articles, with millions of entries per crash time duration, from which we identified articles containing the term “airplane.” The dataset for each event was structured similarly, allowing for a comparative analysis of term frequency variations over time.
Table 4. Summary of the GDELT dataset for airplane crash events. |
| Airplane Crash | Date of Crash | Total News Articles | Articles Containing “Airplane” |
|---|---|---|---|
| California 2020 | Jan 26, 2020 | 1,813,710 | 3,900 (before: 1,327, during: 1,313, after: 1,260) |
| Washington 2022 | Sep 4, 2022 | 1,126,899 | 1,979 (before: 576, during: 768, after: 635) |
| Washington 2025 | Jan 29, 2025 | 1,886,173 | 11,541 (before: 1,437, during: 6,984, after: 3,120) |
6.2 Data processing and analysis
To ensure consistency, we applied the same NLP and computer vision (CV) processing techniques as in our original study. The NLP component involved preprocessing the news articles by removing digits, stopwords, and duplicate entries, followed by tokenization and lemmatization to normalize extracted terms. This helped us retrieve 197 meaningful terms related to airplane crashes from sources such as Google Books, ConceptNet, and the Wikipedia-based Image Text (WIT) dataset.
For the CV component, we used Faster R-CNN with a ResNeXt-101-FPN backbone for object detection and applied the “One for All” multimodal model to generate textual descriptions from images. These image captions were then processed similarly to the textual data, resulting in 585 visual terms linked to airplane-related events. We then computed SBERT-based similarity scores between NLP and CV terms, selecting the top quartile of the most relevant term pairs for analysis.
6.3 Results and observations
The results show a clear increase in the probability of terms associated with airplane crashes during the event period across all three incidents. As illustrated in Figure 11, terms such as “crash” and “helicopter” emerged prominently in the 2020 California crash, while the 2022 Washington crash saw an increase in words like “pilot,” “police,” and “Patterson”, the last referring to an individual involved in a widely reported airplane-related threat. In the 2025 Washington crash, the recurrence of “crash” and “helicopter” corresponds to an in-air collision between a plane and a helicopter, highlighting how the framework successfully captures event-driven linguistic shifts.

Figure 11. Probability shifts of terms in the Airplane Crashes dataset. |
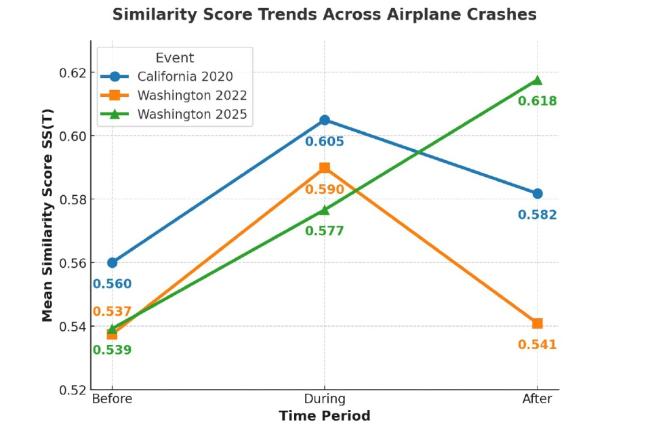
Further validating this trend, Figure 12 shows the change in mean similarity scores for the term “airplane” across the three events. The similarity scores consistently peak during the crash period, reflecting a heightened contextual association with airplane-related discussions. In some cases, such as the Washington 2022 crash, the similarity score declines post-event, suggesting that media coverage quickly shifted focus. Conversely, in the Washington 2025 crash, the similarity score continues to rise even after the event, indicating sustained media attention and prolonged discussion.
Figure 12. The change in mean similarity scores for the term “airplane” in social topics before, during, and after the Plane Crash. |
These observations reinforce the framework’s capability to detect evolving discourse patterns related to real-world incidents. The consistent patterns across different events and media sources suggest that this approach is adaptable beyond a single domain, making it effective in monitoring concept drift in various contexts.
6.4 Implications for generalizability
These findings reinforce the generalizability of our framework by demonstrating its effectiveness across different domains and data sources. The ability to detect concept drift in both pedestrian and airplane-related events confirms that our approach is not domain-specific but adaptable to various real-world contexts. This suggests potential applications in monitoring concept evolution in industries such as transportation, healthcare, and finance. Moreover, by transitioning from social media (Twitter) to news-based data (GDELT), we validate that our framework is not restricted to a particular type of information source, making it robust for analyzing evolving concepts across diverse domains.
7 Discussion
Concept drift detection has been explored through various techniques, including statistical approaches like DDM and EDDM, which identify drifts based on error rate fluctuations, and meta-feature-based methods such as FiCSUM, which focuses on detecting recurring drifts in data streams. While these methods perform well in specific domains, they are inherently limited by their reactive nature or reliance on predictable drift patterns. Semantic learning approaches improve computational efficiency by selectively updating models based on weighted data samples, yet they often overlook multimodal drifts that involve both semantic and visual variations. Our research introduces a proactive framework that integrates real-time semantic and visual features to detect concept drift before it impacts system performance, addressing the limitations of existing methods by leveraging dynamically evolving contextual information.
Different concept drift detection methods are based on distinct assumptions and data requirements. Some rely on meta-features, others analyze error rate fluctuations, and some utilize semantic or visual indicators. This variation makes it challenging to quantitatively compare them using a single dataset. A direct numerical evaluation would be impractical, as no single dataset contains all the necessary attributes for a fair assessment. Instead, we provide a qualitative comparison based on key metrics, such as proactivity, adaptability, computational efficiency, and detection accuracy. Table 5 presents a comparative analysis of these methods, highlighting that while existing techniques excel in their respective domains, our framework demonstrates superior early detection and adaptability by capturing both semantic and visual changes in real-world scenarios. This makes it particularly effective for real-time, safety-critical applications, such as autonomous vehicle perception.
Table 5. Qualitative comparison of concept drift detection methods. |
| Metric | Proposed Framework | FiCSUM | DDM/EDDM |
|---|---|---|---|
| Proactivity | High (Proactive) | Moderate (Recurring Drifts) | Low (Post Hoc) |
| Adaptability | High (Domain-Agnostic) | Moderate (Recurring Drifts) | Low (Frequent Retraining) |
| Feature | Semantic + Visual | Meta-Features | Error-Based Only |
| Efficiency | High | Moderate | Moderate |
| Detection Accuracy | High | High | Moderate |
Our evaluation on two distinct types of events, autonomous vehicle accidents and Halloween pedestrian variations, demonstrates the versatility of the framework. In both cases, we identified significant shifts in pedestrian-related terms and features, highlighting the impact of social context on concept evolution. The observed drifts, such as increased discussion of pedestrian safety after accidents or shifts in pedestrian appearance during Halloween, validate the necessity of proactive monitoring in real-world AI applications.
Despite these strengths, our approach has certain limitations. The reliance on social media data introduces potential noise and biases, necessitating careful preprocessing and filtering. Additionally, the effectiveness of our method depends on the availability of sufficient real-time data sources, which may not always be consistent across different domains. While we demonstrated the framework’s generalizability by applying it to airplane-related incidents, further validation in additional domains would strengthen its applicability.
Another key limitation is the sensitivity of topic modeling to the number of topics selected. In our evaluation, we manually set the number of topics in BERTopic modeling to 20, 25, 30, and 50, depending on the dataset and event characteristics. However, topic modeling does not have a universally optimal number of topics, and different datasets and event contexts may require different values for optimal performance. Automatically determining the best number of topics remains an open challenge. While automated topic selection could improve efficiency and accuracy, it would also require substantial computational resources.
Overall, this study presents a novel and effective strategy for addressing concept drift in AI-enabled software. By proactively identifying semantic and visual shifts, our framework enhances the reliability of AI systems in evolving environments, making them better suited for real-world deployment in safety-critical applications.
8 Conclusion
This study introduces a proactive framework for detecting concept drift in AI-enabled software by integrating semantic and visual analysis. Unlike traditional reactive methods that detect drift only after it affects system performance, our approach anticipates evolving concept definitions by continuously monitoring social discussions and visual features. By combining natural language processing (NLP) and image analysis, the framework effectively identifies domain-specific concept drifts before they lead to AI misclassifications.
The effectiveness and generalizability of our approach were demonstrated in real-world applications, specifically in autonomous vehicle pedestrian detection. Through analysis of autonomous vehicle accidents and Halloween pedestrian variations, we identified significant semantic and visual drifts, highlighting the impact of social and contextual factors on AI perception systems. Additionally, applying the framework to airplane-related incidents validated its adaptability across different domains, confirming its broader applicability beyond autonomous driving.
Despite these strengths, this framework has certain limitations. The reliance on social media data introduces potential noise and bias, necessitating careful preprocessing and filtering. Additionally, the manual selection of topic modeling parameters (such as the number of topics in BERTopic) affects efficiency and may require automated tuning to improve scalability across datasets.
Future work will focus on extending the framework to not only detect but also address concept drift. This involves adaptive learning mechanisms that allow AI models to dynamically update their training datasets in response to detected drifts. By integrating automated dataset updates and retraining strategies, we aim to ensure that AI models remain robust in evolving environments. Furthermore, automating the selection of optimal topic modeling parameters will enhance efficiency, reduce the need for manual tuning, and improve the scalability of the framework across different domains.
By proactively identifying and adapting to evolving domain concepts, this study lays the groundwork for future advancements in AI-driven perception systems. Ensuring continuous dataset adaptation and model updates is key to maintaining long-term reliability and adaptability in AI applications deployed in dynamic, safety-critical environments.
Author contributions
Murtuza Shahzad (Email: z1819332@students.niu.edu; ORCID: 0000-0001-7630-1617): Conceptualization (Equal), Data curation (Equal), Investigation (Equal), Methodology (Equal), Validation (Equal), Writing - original draft (Equal), Writing - review & editing (Equal).
Hamed Barzamini (Email: z1907279@students.niu.edu): Data curation (Equal), Methodology (Equal), Visualization (Equal).
Joseph Wilson (Email: z1935473@students.niu.edu): Formal analysis (Equal), Methodology (Equal), Validation (Equal), Writing - review & editing (Equal).
Hamed Alhoori (Email: alhoori@niu.edu): Conceptualization (Equal), Formal analysis (Equal), Investigation (Equal), Methodology (Equal), Writing - review & editing (Equal).
Mona Rahimi (Email: rahimi@cs.niu.edu): Funding acquisition (Lead), Methodology (Equal), Project administration (Equal).
Funding information
This work is supported by U.S. Office of Naval Research (ONR) Grant number G2A62826.