

1 Introduction
Interdisciplinary research has become an important systemic dimension to solve complex social, economic, technological, and environmental challenges. Traditional disciplinary boundaries are becoming increasingly blurred (Porter & Rafols, 2009; Van Noorden, 2015). Interdisciplinary research not only integrates theories and methods from different fields, providing new perspectives and innovative solutions, but also promotes the integration of scientific knowledge and drives innovation (Ledford, 2015; Rylance, 2015). Studies have shown that interdisciplinary research leads to more citations (Chen et al., 2022; Zhang et al., 2024), disruption (Chen et al., 2024) and long-term funding (Sun et al., 2021).
Indicators of interdisciplinarity can measure the extent of interdisciplinarity in a set of articles, patents, and journals (Zhang & Leydesdorff, 2021), making them ideal tools for assessing institute’s interdiscipinlary performance. A series of indicators of “interdisciplinarity” have been proposed in the literature, e.g. the Gini-coefficient, Simpson indicator (Simpson, 1949), Hirschman-Herfindahl (Herfindahl, 1950; Hirschman, 1945), Rao-Stirling diversity (Stirling, 2007), or the True RS diversity (Leinster & Cobbold, 2012; Zhang, et al., 2016). These indicators assess interdisciplinarity in a comprehensive manner. In order to measure the three characteristics of interdisciplinarity, diversity, balance, and differentiation as it suggested by Sterling (2007), the indicator DIV was designed (Leydesdorff et al., 2019). Based on improvements suggested by Rousseau (2019), Leydesdorff et al. (2019) introduced an updated version of the DIV indicator, called DIV*, which can be used for data without a specific maximum number of categories.
In previous studies, journal-level classification systems were usually used as the basis for the demarcation of disciplines and therefore of interdisciplinarity (Leydesdorff et al., 2019; Zhang et al., 2016). In such systems, papers are classified according to the subject area of the journal in which they are published. This can lead to misclassification, as journals often publish papers on multiple subjects, and not all papers share the same focus. Other studies have also highlighted accuracy and reasonableness issues with this system (Leydesdorff & Bornmann, 2016; Rafols & Leydesdorff, 2009; Shu et al., 2019; Wang & Waltman, 2016). Recently, paper-level classification systems became new tools for analyzing interdisciplinarity, offering a more direct method of labeling research areas and providing different levels of analysis (Shu et al., 2020; Tong et al., 2023). Citation Topics is one such system, comprising clusters based on citation networks between papers dating back to 1980, using a clustering algorithm (Traag et al., 2019) developed by the Centre for Science and Technology Studies (CWTS) in Leiden ① . The system labels papers at three levels of granularity-micro, meso, and macro-offering different angels for analyzing the interdisciplinarity of units. Zhang and Shen (2024) found inconsistencies in journal interdesciplinarity across different levels, yet there has been little research on the impact of this inconsistency on institutional evaluations.
In this study, we examined the impact of granularity on the assessment of interdisciplinarity in institutes and organizations, based on publications of 262 institutes from four main non-university Public Research Organizations (PROs) in Germany: the Helmholtz Society (HGF), the Max Planck Society (MPG), the Fraunhofer Society (FHG), and the Leibniz Society (WGL) from 2018 to 2022. We aim to address the following reseach questions:
$\bullet$Is interdisciplinarity consistent across research organizations and institutes at different levels?
$\bullet$How does the rankings of institutes change after the granularity changes?
$\bullet$Is this changing trend related to the research areas of the institute?
$\bullet$Is this changing trend related to the research focus of the institute (applied or basic)?
2 Data
We collected data from a local snapshot of raw Scopus data hosted by the Fraunhofer Institute for Systems and Innovation Research (ISI) ② , covering the years 2018 to 2022. The dataset comprises 284,313 documents, including articles, reviews, and conference proceedings, published by research institutes affiliated with the four major German non-university PROs: the Helmholtz Association (HGF), the Max Planck Society (MPG), the Fraunhofer Society (FHG), and the Leibniz Association (WGL).
These four PROs represent distinct missions and disciplinary profiles. The Fraunhofer Society (FHG) focuses on applied research in engineering and technology, emphasizing innovation and industrial transfer. The Helmholtz Association (HGF) conducts mission-oriented research in energy, health, environment, information, and space sciences. The Leibniz Association (WGL) spans natural sciences, engineering, economics, social sciences, and the humanities. The Max Planck Society (MPG) is dedicated to basic research in natural sciences, life sciences, and the humanities.
Affiliated research institutes were identified based on institutional information from official sources and verified through publication affiliations in the Scopus metadata. To ensure the accuracy of institute-level assignments, the fields of organization and institute names were cleaned using a combination of programmatic and manual methods.
In total, we identified 268 research institutes, of which 6 with fewer than 10 publications were excluded to reduce the influence of outliers, resulting in a final sample of 262 institutes: HGF (18 institutes), MPG (81 institutes), FHG (73 institutes), and WGL (90 institutes).
Data of the paper-level classification system, Citation Topics, were obtained from a database of the National Science Library, China Academy of Sciences. These data were manually download from InCites in 2023. The Citation Topics classification system is structured hierarchically in three levels, where each level forms a tree-like relationship with the next: broad disciplines (macro level) branch into more specific research fields (meso level), which further divide into fine-grained research topics (micro level), capturing the nested and interconnected nature of scientific knowledge. In our dataset, there are 2,391 micro-level labels, 326 meso-level labels and 10 macro-level labels.
3 Method
3.1 Interdisciplinarity of institutes
In this study, we used DIV* (Leydesdorff et al., 2019) to measure the interdisciplinarity of institutes. This indicator combines the performance of three components: variety (the number of distinct disciplines), evenness (the balance of publications across disciplines), and disparity (the cognitive distance between disciplines). The formula for DIV* is as follows:
$D I V_{c}^{*}=n_{c} *[1-G(c)] * \frac{\sum_{i, j=1, i \neq j}^{i, j=n_{c}} d_{i j}}{n_{c} *\left(n_{c}-1\right)} $
where nc is the number of disciplines in publications of institute c, which reflects the discipline variety. G(c) is the Gini coefficient of publications of c and [1-G(c)] represent the discipline evenness. dij represents the disparity between discipline i and j, and $\frac{\sum_{i, j=1, i \neq j}^{i, j=n_{c}} d_{i j}}{n_{c} *\left(n_{c}-1\right)} $ denotes the average discipline disparity in the publications of institute c.
To calculate dij, we constructed three disciplinary citation networks corresponding to the three levels of topics in the Citation Topics classification system. Then, the Node2Vec (Grover & Leskovec, 2016) module was used to generate the 64-dimensional disciplinary vector, (Vectori), for each research area.
Vectori=[v1, v2, …, v64]
Then, sij is the cosine similarity between Vectori and Vectorj.
Sij=cosine(Vectori, Vectorj)
Finally, the disparity dij between discipline i and j is calculated as:
dij=1-Sij
To explore how classification granularity affects interdisciplinarity assessment, we applied at three levels of classification granularity—macro, meso, and micro. These levels reflect different resolutions of disciplinary distinctions. By calculating DIV* at each level, we assess how the interdisciplinarity of research institutes changes with classification granularity.
3.2 Ranking changes of institutes
In order to analyze the impact of diversity changes on research institutes at different levels of classification, we analyzed the changes in the ranking of institutes. We first sorted all research institutes in descending order of macro, meso, and micro interdisciplinarity, thereby obtaining the ranking of each research institute at three granularities, and finally counted the changes in diversity ranking.
Ranking changes Macro to Meso of institute i=Ranking of institute i at macro level-Ranking at meso level
3.3 Labeling the Scopus documents with Citation Topics at three levels
This part of the study involves two initial datasets. The first one is the Scopus dataset, which includes institutes and fields such as Scopus ID, title, abstract, and well-cleaned insitute information. The second dataset is the Citation Topics dataset, which includes WoS ID, title, abstract, macro-level, meso-level, and micro-level category. Our goal was to assign topic labels from the Citation Topics dataset to the papers in the Scopus dataset. Due to differences in coverage between the two databases and variations in the expression of paper titles, directly matching paper labels by title only yields a match rate of approximately 80%.
To improve this, we employed an embedding and k-nearest neighbor (KNN) based method to match and predict the labels for the Scopus papers. First, we used the SPECTER model (Cohan et al., 2020) for paper-level representation to embed both the Scopus and Citation Topics datasets based on their titles and abstracts. Then the similarities of each paper between Scopus and Citation Topics dataset were calculated.
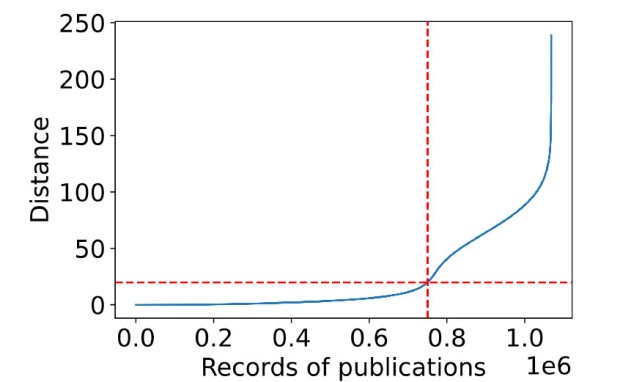
Figure 1 illustrates the distances between Scopus records and their nearest corresponding Citation Topics records, with the x-axis representing the index of records and y-axis representing the distance. A turning point occurs at a distance of 23. Ideally, an exact match would have a distance of zero. However, due to certain discrepancies, such as different formats for Roman symbols or the inclusion of copyright text in the Citation Topics abstracts, the distance might not be zero even for the same paper in both databases. Upon review, we found that records with a distance of around 20 still corresponded to the same paper. Therefore, matched pairs whose distance was less than 20 were regarded as exact matches, and these Scopus papers got the paper-level labels directly. This step successfully labeled 78.0% of the papers.
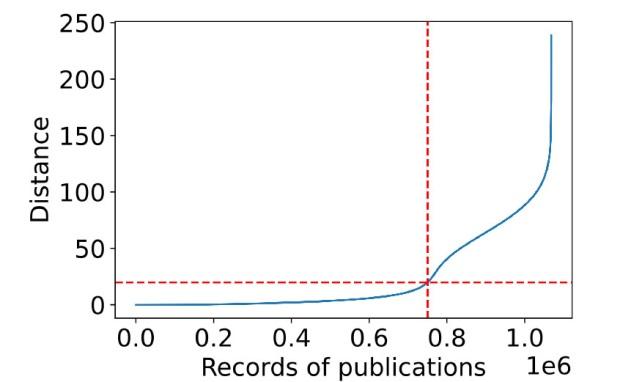
Figure 1. Distances of records. |
Next, the KNN algorithm was used to predict the label for the remaining unlabeled Scopus papers. To determine the optimal value of K, exact matched records were considered as gold standard. In the gold standard dataset, the label of a Scopus paper is the Citation Topics paper closest to it. Based on the gold standard dataset, we calculated the prediction results of the nearest K papers from the Citation Topics dataset to determine the best value of K. We hid the nearest labels of these papers and used the remaining top-K papers from Citation Topics dataset to predict the hidden labels. The accuracy of these predictions was used to select the best K. The highest accuracy of 0.76 was achieved when K = 6. Finally, we used the KNN algorithm with k = 6 to predict the labels for the remaining unlabeled Scopus papers.
3.4 Controlling the impact of research field of institutes
To limit the influence of the institute’s main research field, we normalized the interdisciplinarity of the institute by main research field.
$F N D_{c}^{*}=\frac{D I V_{c}^{*}}{D I V_{a v g, f}^{*}}$
DIVc* is the interdisciplinarity of institue c, $D I V_{a v g, f}^{*}$ is the average in clustered field f and field f is the main research field of the institute c.
To determine the main research fields of institutes, we used a hierarchical clustering Algorithm (Müllner, 2011). We first represented each institution by its publication shares in different macro-level fields, then clustered them using the hierarchical clustering algorithm, and finally obtained the field to which each research institution belongs in our dataset. We set the number of clusters to 7. We tried cluster numbers from 2 to 10 and analyzed the Macro category with the highest average share of publications in each cluster. We found that when the number of clusters was 7, the difference in categories was most obvious. As shown in Table 1.
Table 1. Average share of publications in each cluster across macro categories. |
| macro | Cluster | ||||||
|---|---|---|---|---|---|---|---|
| 1 | 2 | 3 | 4 | 5 | 6 | 7 | |
| 1 Clinical & Life Sciences | 0.7458 | 0.0990 | 0.0278 | 0.0732 | 0.0716 | 0.1757 | 0.0769 |
| 2 Chemistry | 0.0849 | 0.0023 | 0.1192 | 0.0126 | 0.3456 | 0.0425 | 0.0378 |
| 3 Agriculture, Environment & Ecology | 0.0776 | 0.0226 | 0.0048 | 0.0072 | 0.0335 | 0.6720 | 0.2147 |
| 4 Electrical Engineering, Electronics & Computer Science | 0.0279 | 0.0570 | 0.0277 | 0.7334 | 0.1415 | 0.0161 | 0.0360 |
| 5 Physics | 0.0132 | 0.0028 | 0.7842 | 0.0262 | 0.1581 | 0.0044 | 0.0280 |
| 6 Social Sciences | 0.0228 | 0.7176 | 0.0043 | 0.1093 | 0.0218 | 0.0332 | 0.0606 |
| 7 Engineering & Materials Science | 0.0091 | 0.0025 | 0.0180 | 0.0148 | 0.1759 | 0.0062 | 0.0607 |
| 8 Earth Sciences | 0.0069 | 0.0068 | 0.0095 | 0.0099 | 0.0126 | 0.0489 | 0.4670 |
| 9 Mathematics | 0.0072 | 0.0046 | 0.0039 | 0.0078 | 0.0377 | 0.0005 | 0.0080 |
| 10 Arts & Humanities | 0.0047 | 0.0848 | 0.0005 | 0.0057 | 0.0015 | 0.0005 | 0.0103 |
3.5 Classifying the research types of institutes
The German research landscape is characterized by a mission-oriented division of tasks between universities and well-established and diversified non-university research organizations (Frietsch & Schubert, 2012). The four largest organizations are the Fraunhofer and the Max-Planck Societies as well as the Leibniz and the Helmholtz Associations. Their missions range from basic to applied research, from research infrastructures to documentation and service functions for the science system. The funding structures resembles the missions and tasks (Frietsch & Buehrer, 2022).
The Fraunhofer Society for the Promotion of Applied Research (FHG), with nearly 20,000 employees (full-time equivalents, FTE), is the largest application-oriented research organization in Europe. With its focus on future-relevant key technologies and the exploitation of its results in business and industry, it plays a central role in the innovation process. Its topics cover a broad range of engineering disciplines as well as the natural sciences. Specific areas of medicine and social sciences are also represented by individual institutes. However, the main focus lies on mechanical engineering, electrical engineering, information science, and materials research.
The Helmholtz Association of German Research Centers (HGF), with more than 34,000 employees (FTE), is the largest non-university research organization in Germany. It consists of 18 legally independent Helmholtz Centers. The Helmholtz Association operates large-scale and experimental facilities and is active across the entire spectrum of basic and application-oriented research in the six research areas of energy, earth and environment, health, information, aeronautics/space/transport, and matter.
The Gottfried Wilhelm Leibniz Association (WGL) - abbreviated to the “Leibniz Association” (WGL) - with its more than 13,000 employees (FTE) and 97 institutes, covers a broad spectrum of the research landscape. The WGL’s sections range from the humanities and educational research, economics and social sciences, spatial sciences, and life sciences to mathematics, natural sciences, and engineering. In addition to providing infrastructure for research and science, the Leibniz Association also operates research museums.
The Max Planck Society for the Advancement of Science - or Max Planck Society (MPG) for short - is one of the world’s most renowned organizations in the field of basic research. With over 16,000 employees (FTE) in 86 institutes and organized into three sections: the Biological-Medical Section, the Chemical-Physical-Technical Section, and the Humanities, Social Sciences, and Humanities Section, its focus is on the life sciences, natural sciences, and humanities.
We assigned each paper to one of the institutes of the four non-university research organizations according to the affiliation mentioned on the paper. We used the indicator “Research Level” (RL) to classify each paper to “applied” research or “basic” research. Based on the proportion of applied research papers, we then classified institutes into three categories: Applied Research-focused Institutes (ARI), Mix Reseach-focused Institutes (MRI), and Bascic Research-focused Institutes (BRI). To reduce the impact of outliers, we removed six institutes with fewer than 10 publications after matching the research type of papers. Ultimately, this dataset contains 234,326 papers from 256 research institutes.
Table 2. Difinitions of research levels. |
| Research Level | Biomedical definition | Non-biomedical definition |
|---|---|---|
| 1 | Clinical observation | Applied technology |
| 2 | Clinical mix | Engineering-technological mix |
| 3 | Applied research | Applied research |
| 4 | Basic research | Basic scientific research |
In this study, we used a labeled dataset of Scopus data, which builds on the implementation of Research Levels suggested by Boyack et al. (2014). This script refers to the title and abstract of publications to classify them into four categories (RL 1-4). In the implementation, an algorithm (multinomial logit model) was developed using a journal-based training data set based on the title, abstract, and the cited references, which was then applied to all publications. The research level method was used in Donner and Schmoch (2020) and also in Frietsch et al. (2023). Here, RL1-3 were categorized as “applied” research and RL4 as “basic” research. This classification is also followed in this study.
Then, institutes were ranked in ascending order based on their proportion of applied research. The disctribution is shown in Figure 2. Based on the applied research paper proportions, the institutes were divided in three groups: Applied research-focused institutes (ARI, 85 institutes), Mixed research-focused institutes (MRI, 85 institutes), and Basic research-focused institutes (BRI, 86 institutes).
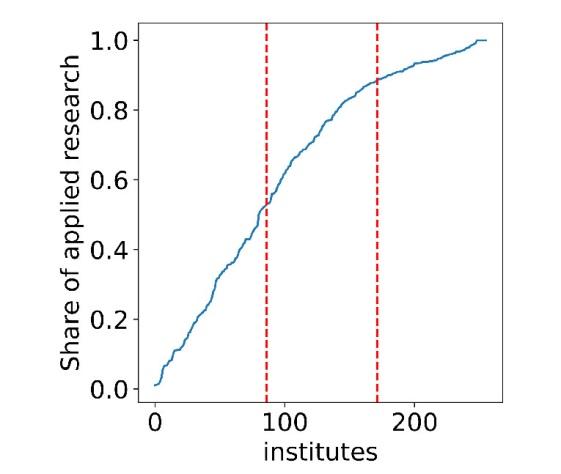
Figure 2. Distribution of applied research shares. |
4 Results
4.1 The inconsistency of interdisciplinarity across different organizations and institutes at three levels
To explore the distribution characteristics across different societies, we used box plots and statistical testing (two-sided Mann-Whitney-Wilcoxon test) to analyze DIV*s at macro, meso and micro level for each society. Figure 3 illustrates the interdisciplinarity distributions of institutes at these three levels, where DIV*-macro, DIV*-meso and DIV*-micro denote the interdisciplinarity at the macro, meso and micro level, respectively. Each box plot shows the distributions of DIV* for institutes within each society (“ns” means there is no significant difference between two groups).
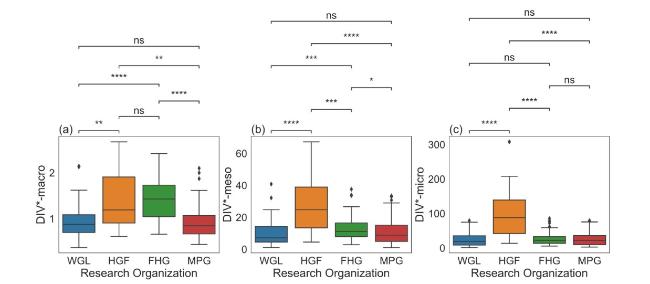
Figure 3. Distributions of interdisciplinarity at three levels. |
In the overall dataset, the range of DIV*-macro is the narrowest (0.37, 2.68), followed by the DIV*-meso (1.07, 67.28), and the range of DIV*-micro is the largest (1.28, 308.05). As shown in Figure 3(a), at the macro level, the Fraunhofer Society (FHG) and the Helmholtz Association (HGF) exhibit significantly higher interdisciplinarity compared to the Max Planck Society (MPG) and Leibniz Association (WGL), and there is no significant difference between HGF and FHG. At the meso and micro levels, HGF still shows significant high interdisciplinarity (Figures 3b and 3c). However, FHG does not lead the interdisciplinarity ranking of the four organizations as it does in the case of the macro level. At the micro level, there is no significant difference between MPG, FHG, and WGL.
Next, to reveal the inconsistencies among various institutes at different levels, Figure 4 depicts the interdisciplinarity distributions of the institutes within all four organizations across three levels. While we analyzed the effects of the three different levels of disciplinary demarcation aggregates at the four different organizations, we now switch our analytical focus to the individual institutes within the organizations. We observed there are some institutes which with a high DIV* at all three levels. For example, Karlsruhe Institute of Technology, which is affiliated with HGF but which is also a university and therefore a multi-disciplinary entity, ranks first in interdisciplinarity at the macro, meso and micro levels (DIV*-macro: 2.68, DIV*-meso: 67.28, DIV*-micro: 308.05). Conversely, some institutes show low DIV*s at all three levels, such as Leibniz Peace Research Institute Frankfurt (PRIF), which ranks 260th, 262nd and 247th at macro, meso and micro level. However, there are also some institutes that reach a high DIV* at one level but a low DIV* at the other level, such as the German Cancer Research Center (DKFZ), which ranks 9th at micro level and 18th at meso level but 179th at macro level.
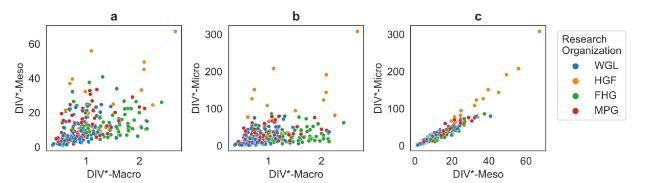
Figure 4. Institutes interdisciplinarities at different levels. |
The result of the Spearman correlation coefficients among the three levels reveals a strong correlation between DIV*-micro and DIV*-meso indicators (correlation coefficient: 0.96, P value less than 0.05), a weaker correlation between DIV*-macro and DIV*-meso indicators (correlation coefficient: 0.51, P value less than 0.05), and an even weaker correlation between DIV*-macro and DIV*-micro indicators (correlation coefficient: 0.41, P value less than 0.05). Therefore, an institute may perform differently across various levels.
According to these results, the performance of societies’ interdisciplinarity at the three levels is inconsistent. HGF and FHG showed significantly high DIV*-macro indicators, but FHG’s DIV* decreased when granularity change to meso and micro level. Additionally, there is an inconsistency in the interdisciplinarity of institutes across different levels, particularly between the macro and micro levels.
4.2 Rankings of FHG dropped significantly when a more granular level was used
Table 3 shows the average rankings of the four organizations across our three levels of interdisciplinarity. At each level, the overall average ranking of the dataset is 131.50 (we have 262 individual institutes in our analytical setting). FHG exhibits the highest average ranking at the macro level, with a score of 74.67, which is notably above the overall average. However, this ranking declines significantly at the meso and micro levels relative to the other organizations in our analysis, dropping to 113.19 and 128.86, respectively. In contrast, the ranking trajectories of the other three societies demonstrate distinct patterns. As the level of analysis becomes more refined, their average rankings exhibit an upward trend. Notably, HGF shows the most substantial improvement, with an increase of 60.61 positions. MPG follows, with a rise of 24.59 positions, while WGL exhibits the smallest gain, advancing by 9.70 positions.
Table 3. The average rankings of four organizations. |
| Society | The mean of rankings | ||
|---|---|---|---|
| macro level | meso level | micro level | |
| FHG | 74.67 | 113.19 | 128.86 |
| HGF | 97.83 | 55.06 | 37.22 |
| WGL | 161.31 | 141.31 | 136.72 |
| MPG | 157.49 | 152.80 | 147.79 |
Next, Figure 5 illustrates the differences in the distribution of ranking changes. Specifically, Figure 5a depicts the changes in rankings when the granularity is adjusted from the macro to the meso level, while Figure 5b shows the changes when moving from the meso to the micro level. The y-axis in both figures represents the ranking changes for each institute within the organizations. It is evident that in both Figure 5a and Figure 5b, the decline in FHG’s ranking is significantly different from that of the other three organizations (two-sided Mann-Whitney-Wilcoxon test).
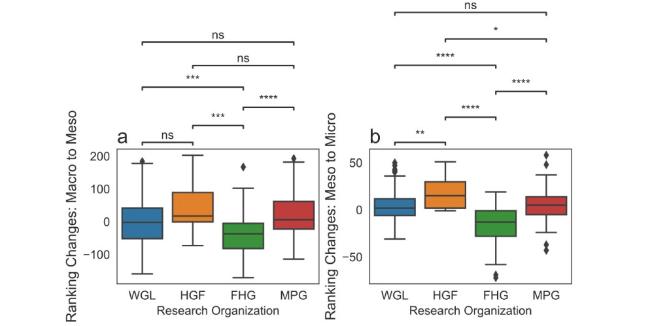
Figure 5. Changes of the institutes rankings across levels. |
An Ordinary Least Squares (OLS) linear regression model is employed to assess the impact of the ranking changes of variety (X1), evenness (X2) and disparity (X3) to the FHG’s ranking changes of DIV*(y). Variety refers to the number of disciplines represented in the publications of institute c, evenness is quantified as 1 - G(c) - G is the Gini coefficient -, and disparity represents the average disciplinary disparity among the publications of the institute.
The model is specified as follows:
y=β0+β1X1+β2X2+β3X3+ϵ
β0 is the intercept, β1, β2, β3 is the intercept, are the coefficients corresponding to the three dimensions of interdisciplinarity (variety, evenness, disparity), and ϵ is the error term.
Table 4. Regression analysis of factors affecting ranking changes. |
| Change of levels | variables | coef | std err | t | P>|t| | [0.025 | 0.975] | R-squared |
|---|---|---|---|---|---|---|---|---|
| From Macro to Meso | intercept | -16.9987 | 5.032 | -3.378 | 0.001 | -27.038 | -6.959 | 0.73 |
| Ranking change of variety | 0.2577 | 0.051 | 5.064 | 0 | 0.156 | 0.359 | ||
| Ranking change of evenness | 0.6059 | 0.06 | 10.101 | 0 | 0.486 | 0.726 | ||
| Ranking change of disparity | 0.5397 | 0.08 | 6.747 | 0 | 0.38 | 0.699 | ||
| From Meso to Micro | intercept | -5.5774 | 1.768 | -3.154 | 0.002 | -9.105 | -2.05 | 0.638 |
| Ranking change of variety | -0.176 | 0.076 | -2.322 | 0.023 | -0.327 | -0.025 | ||
| Ranking change of evenness | 0.3443 | 0.07 | 4.931 | 0 | 0.205 | 0.484 | ||
| Ranking change of disparity | 0.8479 | 0.127 | 6.672 | 0 | 0.594 | 1.101 |
Table 4 presents the results of the regression analysis, highlighting the significant effects of each variable on the FHG’s ranking changes. When the classification level is adjusted from macro to meso, the change in evenness ranks as the most influential factor, with a contribution of 0.6059, followed closely by the change in disparity (0.5397). The change of variety has the smallest effect, with a contribution of 0.2577. However, when the classification level is further refined to the micro level, the change in disparity becomes the most significant contributor, with a value of 0.8479, while the contribution of evenness decreases to 0.3443. Notably, during this transition, the change in variety has a negative effect, with a value of -0.176.
The positive impact of these variables on the final ranking changes is understandable, as they constitute the components of the final indicator. Consequently, when their rankings decline, the overall ranking of the DIV* is expected to decrease correspondingly. However, the observed negative effect of the variety ranking is noteworthy when the classification level shifts from meso to micro level. This finding suggests that FHG institutes which have improved their diversity rankings may have concurrently experienced more significant decreases in their evenness and disparity rankings.
4.3 Standardized analysis of ranking changes across research fields of institutes
There is an imbalance in the distribution of categories. As shown in Table 5 there are 132 meso-level categories in the field of Clinical & Life Sciences, while only 8 meso-level categories in Mathematics. At the micro level, the differences of the categories are even more exaggerated. Given that the research focuses of the four organizations are different, the imbalances in the distribution of disciplines and fields with the macro categories have very different effects in the interdisciplinary structure of the four organizations. FHG focused on Electrical Engineering, Electronics & Computer Science, HGF and MPG focused on Clinical & Life Sciences, including chemistry, and Physics, WGL focused on Clinical & Life Sciences.
Table 5. Number of meso- and micro- level categories in each macro level category. |
| Macro category | Number of meso level categories | Number of micro level categories | Share of publications | |||
|---|---|---|---|---|---|---|
| FHG | HGF | MPG | WGL | |||
| 1 Clinical & Life Sciences | 132 | 915 | 0.13 | 0.25 | 0.25 | 0.24 |
| 2 Chemistry | 37 | 265 | 0.16 | 0.15 | 0.14 | 0.14 |
| 3 Agriculture, Environment & Ecology | 28 | 221 | 0.04 | 0.09 | 0.07 | 0.18 |
| 4 Electrical Engineering, Electronics & Computer Science | 27 | 170 | 0.32 | 0.09 | 0.05 | 0.04 |
| 5 Physics | 26 | 210 | 0.15 | 0.21 | 0.36 | 0.15 |
| 6 Social Sciences | 24 | 246 | 0.05 | 0.02 | 0.04 | 0.15 |
| 7 Engineering & Materials Science | 20 | 141 | 0.13 | 0.08 | 0.02 | 0.02 |
| 8 Earth Sciences | 12 | 68 | 0.02 | 0.10 | 0.05 | 0.06 |
| 9 Mathematics | 12 | 93 | 0.01 | 0.01 | 0.02 | 0.01 |
| 10 Arts & Humanities | 8 | 62 | 0.00 | 0.00 | 0.01 | 0.00 |
To assess the impact of data imbalances and variations in the institutional focus, we first analyzed the ranking changes of institutes across seven clustered fields. As illustrated in Figure 6, rankings of institutes in Cluster 1 (primarily associated with Clinical & Life Sciences) showed a significant increase when the granularity was adjusted from the macro level to the meso level. Similarly, the rankings of institutes in Cluster 6 (mainly within the macro category Agriculture, Environment & Ecology) also experienced an upward shift when the granularity was further refined from the meso level to the micro level.
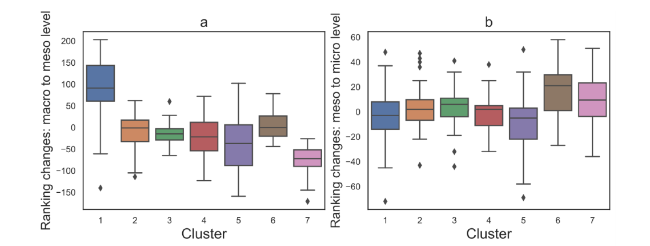
Figure 6. Distribution of ranking changes across clustered fields. |
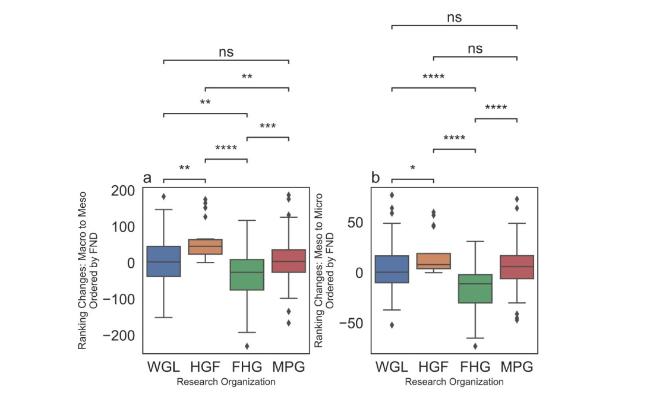
To assess whether the observed decline in FHG’s rankings at more granular levels persists after accounting for research field effects, we used the (field-normalized DIV*) rankings, which normalize interdisciplinarity values based on the number of categories per disciplinary field for each institute’s main research field. For example, at the meso level, each Arts and Humanities category gained a higher weight (1 out of 8) compared to Life Sciences (1 out of 132). This adjustment ensures that the rankings are not disproportionately influenced by differences in field-specific distribution/categorisation characteristics.
Our analysis reveals that even after standardizing the rankings, FHG’s ranking continues to exhibit a gradual decline as the classification granularity switches from macro to meso and micro. The results, as visualized in Figure 7, confirm that the previously observed trend—where FHG’s ranking drops significantly when moving from the macro to meso and micro levels—remains consistent.
Figure 7. Changes of the institutes rankings across levels based on FND*. |
4.4 Examining the influence of applied and basic research focus on rankings
Among the four societies, FHG is an organization more focused on applied research than the other three. Table 6 shows the shares of applied research papers of HGF, MPG, WGL and FHG according to the research level assignment suggested by Boyack et al. (2014) (see also (Donner, 2020) and (Frietsch et al. 2023)). As shown in this table, although FHG has the lowest absolute number of applied research papers, it has the highest proportion of applied research papers.
Table 6. Proportions of applied research of four societies. |
| Society | Number of applied research papers | Number of all papers | Proportion |
|---|---|---|---|
| HGF | 69,028 | 115,188 | 0.60 |
| MPG | 20,169 | 64,712 | 0.31 |
| WGL | 24,509 | 40,389 | 0.61 |
| FHG | 12,135 | 14,037 | 0.86 |
To verify whether the significant ranking drop is related to the research type of the institute, each institute was labelled as applied research-focused institutes (ARI), mix research-focused institutes (MRI) and basic research-focused institutes (BRI) according to the share of applied research papers (Table 7). Although HGF has the highest number of publications, the number of institutes belong to it is the lowest, totaling 18. MPG has the highest number of BRIs (58) but only nine ARIs. In contrast, FHG has the highest number of ARIs (46) but the lowest number of BRIs (1).
Table 7. Numbers of each type of institutes in the four societies. |
| Society | Type of institute | Number of institutes |
|---|---|---|
| HGF | BRI | 6 |
| MRI | 12 | |
| ARI | 0 | |
| MPG | BRI | 58 |
| MRI | 14 | |
| ARI | 9 | |
| WGL | BRI | 21 |
| MRI | 36 | |
| ARI | 30 | |
| FHG | BRI | 1 |
| MRI | 23 | |
| ARI | 46 |
To investigate whether the type of institution affects the change in ranking from macro to micro, which is ranked by DIVc*, we conducted an ordinary least squares (OLS) regression analysis (Table 8). The independent variables include organization (Org.), institution type (inst_type), and number of papers (count_paper). The R2 value of the regression model is 0.180.
Table 8. Effects of organization and institution type on Ranking Changes. |
| coef | std err | t | P>|t| | [0.025 | 0.975] | |
|---|---|---|---|---|---|---|
| Intercept | -46.3744 | 9.5920 | -4.8347 | 0.0000 | -65.2661 | -27.4827 |
| sektor[T.HGF] | 122.3198 | 28.6161 | 4.2745 | 0.0000 | 65.9594 | 178.6803 |
| sektor[T.MPG] | 52.2014 | 15.0183 | 3.4759 | 0.0006 | 22.6223 | 81.7805 |
| sektor[T.WGL] | 55.2645 | 12.3258 | 4.4837 | 0.0000 | 30.9885 | 79.5405 |
| inst_type[T.BFI] | 13.1273 | 13.9912 | 0.9383 | 0.3490 | -14.4288 | 40.6835 |
| inst_type[T.MFI] | -2.1380 | 11.9009 | -0.1797 | 0.8576 | -25.5773 | 21.3013 |
| count_paper | -0.0001 | 0.0033 | -0.0162 | 0.9871 | -0.0065 | 0.0064 |
The baseline coefficient (-46.3744, p < 0.001) indicates a negative starting point for ARIs within FHG. In contrast, HGF, MPG, and WGL exhibit significant positive impacts on ranking changes relative to FHG, suggesting that institutes in these organizations experience smaller declines in rankings when transitioning to micro-level classifications. Furthermore, neither BRI nor MRI shows a significant impact compared to ARI, whether in terms of the research types of institutes or the number of applied research papers published. We also performed a regression analysis using the proportion of applied research papers published by the institutes instead of the institute type, and the results of the two analyses were consistent.
5 Discussion and conclusion
In recent years, the interdisciplinarity of journals, researchers, and organizations has received increasing attention, and our analysis aims to enhance the understanding of the behaviour of these units and support better development strategies. In the analysis process, the disciplinary classification system is an important component. The journal-level classification system is widely used, but the paper-level classification system is more and more used because it can more directly reveal the research topics of the papers and describe the relationship between disciplines at a finer granularity. However, the granularity of paper-based classification systems is a direct function of the number of papers in a particular discipline, hence a size-dependency also of interdisciplinarity indicators might occur. The larger a discipline is, the higher is the probability of higher interdisciplinarity measures. For example, cardiology and vascular diseases might constitute two different disciplines, while in mechanical engineering a distinction between diesel and gasoline combustion engines is not made in the disciplinary structure. This leads to the question, if this definition and demarcation issue of disciplines blurs the concept of interdisciplinarity?
We analysed the effects of three different differentiation levels of disciplinary classification systems on the interdisciplinarity assessments at the institute and the organisational level. We measure the interdisciplinarity by employing the DIV* indicator, aggregating it at the level of institutes and further at the organizations they belong to.
Using a dataset of 262 research institutions from four major German non-university public research organizations, this study examines the consistency of interdisciplinarity of journal publications between different classification levels, explores the impact of classification granularity on institutional rankings, and studies the impact of field characteristics and research focus.
The results show that there is a significant inconsistency in interdisciplinarity at the macro, meso, and micro levels, and there are significant differences in the rankings of institutions. For example, the Fraunhofer Society (FHG), which shows high interdisciplinarity at the macro level, has a significant drop in ranking at the meso and micro levels. This highlights the impact of granularity on institutional evaluation and emphasizes the need for caution when comparing interdisciplinarity performance at different levels.
Then, normalizing interdisciplinarity rankings based on the main research field confirmed that the ranking decline of FHG persists, even after controlling for field-specific characteristics. This suggests that the decline in FHG’s ranking is not solely attributable to the influence of its main research field, but may reflect deeper structural or organizational factors affecting its interdisciplinarity performance across different granularity levels.
Finally, the classification of institutes into applied research-focused institutes (ARI), mixed research-focused Institutes (MRI), and basic research-focused Institutes (BRI) revealed that FHG has the highest proportion of ARIs and the lowest proportion of BRIs among the four organizations. However, regression analysis showed no significant effect of research focus on ranking changes, indicating that the observed ranking declines are not strongly related to the proportion of applied research papers or the type of research focus.
This study highlights the critical influence of classification granularity on interdisciplinarity assessment and ranking outcomes. The findings underscore the importance of standardizing metrics to account for field-specific characteristics and considering structural differences when evaluating interdisciplinary performance. For policymakers and research managers, these results emphasize the need to interpret rankings cautiously, particularly when comparing institutes with diverse research focuses or disciplinary compositions.
Further research is needed on the underlying structural and organizational factors that contribute to inconsistent interdisciplinary rankings. Furthermore, the impact of collaboration networks, funding mechanisms, and publishing strategies on interdisciplinary performance should also be investigated. Finally, extending this analysis to other national or international contexts could provide broader insights into the generalizability of the observed trends and patterns.
Moreover, this study relies on a single-discipline assignment for each paper, while in reality, scientific work often spans multiple dimensions such as research topics, methods, and domains. Future studies should explore multidimensional approaches to disciplinary classification to better reflect the complexity of interdisciplinary research.
Furthermore, future studies should also explore the question of disciplinary boundaries—namely, what level of granularity is most appropriate for distinguishing disciplines. Identifying the optimal granularity that balances specificity and practicality is crucial for refining interdisciplinarity metrics and ensuring robust assessments of research systems. Our empirical analyses showed that the definition of disciplines has a direct impact on interdisciplinarity measures and assessments. With paper-based definitions of disciplines, however, the size of a field gets a heavy impact on the disciplinary structure and therefore constitutes a relevant dimension in this kind of exercise.
Data availability statements
The data that support the findings of this study are available on request from the first author.
Author contributions
Jiandong Zhang (zhangjiandong21@mails.ucas.ac.cn): Conceptualization (Equal), Data curation (Equal), Formal analysis (Lead), Investigation (Lead), Methodology (Lead), Project administration (Equal), Resources (Equal), Software (Equal), Validation (Equal), Visualization (Lead), Writing - original draft (Lead);
Sonia Gruber (Sonia.Gruber@isi.fraunhofer.de): Data curation (Equal), Resources (Equal), Software (Equal);
Rainer Frietsch (Rainer.Frietsch@isi.fraunhofer.de): Conceptualization (Lead), Funding acquisition (Equal), Methodology (Equal), Project administration (Equal), Supervision (Equal), Writing - original draft (Equal), Writing - review & editing (Equal).