

1 Introduction
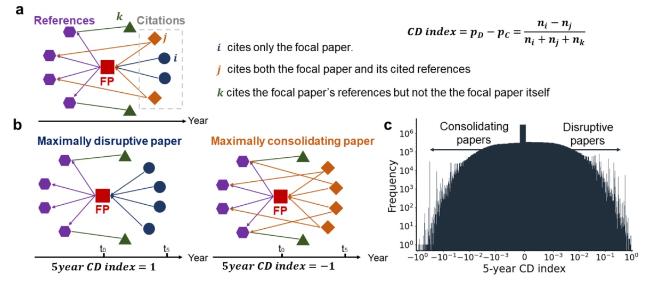
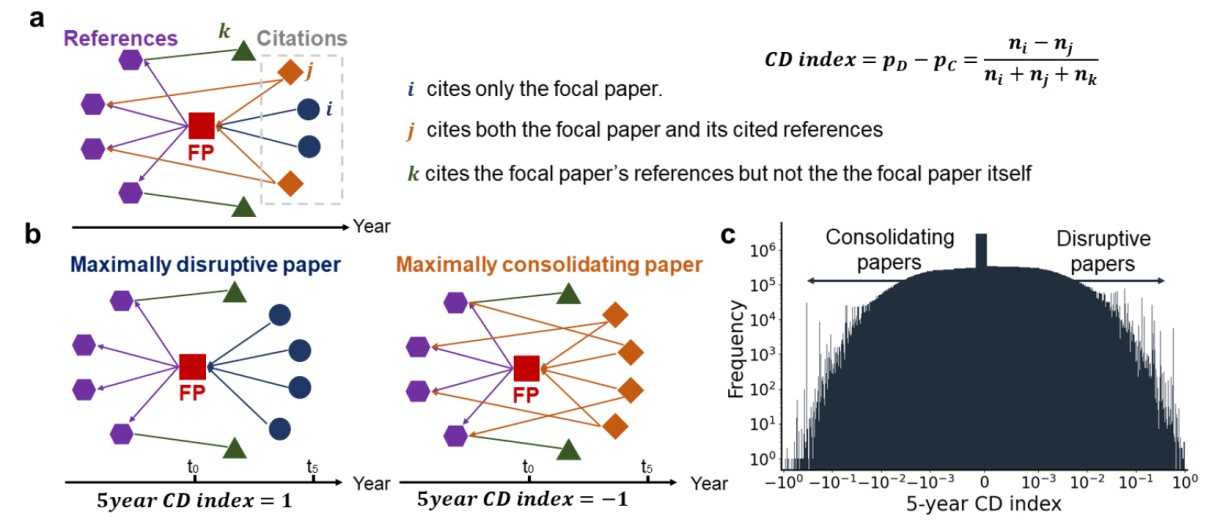
Figure 1. Quantifying the 5-year CD index. |
2 Background
3 Data and method
ln(E[Citationi])=α+β1(CD indexi)+εi
ln(E[Citationi])=α+β1 (CD indexi)+δf FieldFEf+θc Teamc+φr Refr+εi
4 Main results
4.1 Increasing bias against the CD index
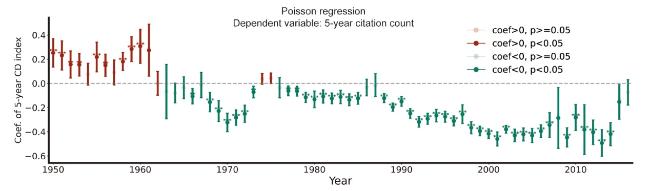
Figure 2. Basic yearly split-sample Poisson regression coefficients of the CD index on citation counts from 1950 to 2016. Error bars depict the upper and lower bounds of the 95% confidence intervals based on robust standard errors. Dark-red coloring indicates significant positive coefficients (p <0.05), and light-red coloring indicates non-significant positive coefficients. Dark-green coloring indicates significant negative coefficients (p <0.05), light-green coloring indicates non-significant negative coefficients. * p < 0.05, ** p < 0.01, *** p < 0.001. |
4.2 Reference count as a contributing factor
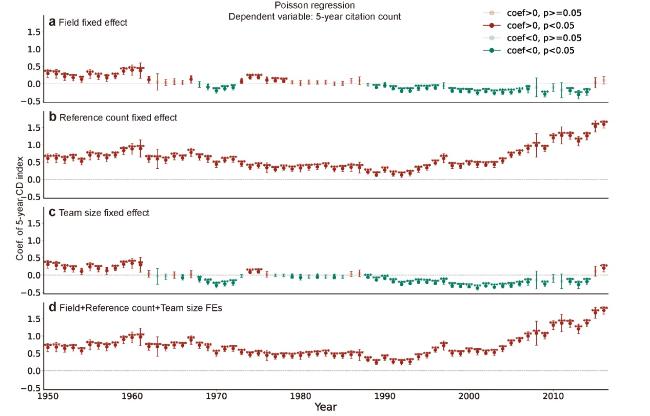
Figure 3. Yearly split-sample Poisson regression coefficients of the CD index on citation counts from 1950 to 2016, with (a) 292 fields fixed effect, (b) reference count fixed effect, (c) team size fixed effects, and (d) all fixed effects. Error bars depict the upper and lower bounds of the 95% confidence intervals based on robust standard errors. Dark-red coloring indicates significant positive coefficients (p<0.05), and light-red coloring indicates non-significant positive coefficients. Dark-green coloring indicates significant negative coefficients (p <0.05), light-green coloring indicates non-significant negative coefficients. * p < 0.05, ** p < 0.01, *** p < 0.001. |
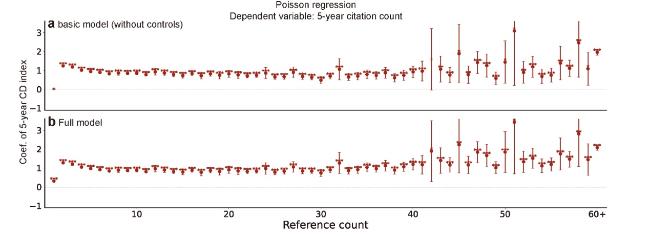
Figure 4. Split-sample Poisson regression coefficients of the CD index on citation counts based on reference counts. (a) Basic models without any fixed effects. (b) Full models including all fixed effects. Error bars depict the upper and lower bounds of the 95% confidence intervals based on robust standard errors. * p < 0.05, ** p < 0.01, *** p < 0.001. |
4.3 Other possible explanations
Table 1. The effect of the CD index on citation count with team-level controls. |
| Models | (1) | (2) | (3) | (4) | (5) | (6) | (7) |
|---|---|---|---|---|---|---|---|
| DV: 5-year citation count (Poisson regression) | |||||||
| 5-year CD index | -0.1993*** (0.0133) | -0.1541*** (0.0137) | -0.1639*** (0.0137) | -0.1789*** (0.0135) | -0.2018*** (0.0135) | -0.1618*** (0.0147) | -0.1234*** (0.0151) |
| ln(Team size) | 0.3405*** (0.0016) | 0.2533*** (0.0018) | |||||
| ln(Institution count) | 0.3960*** (0.0020) | 0.2159*** (0.0023) | |||||
| ln(Country count) | 0.4382*** (0.0029) | 0.0358*** (0.0034) | |||||
| ln(Home field count) | 0.1950*** (0.0018) | -0.0498*** (0.0018) | |||||
| Gender diversity | 0.2868*** (0.0021) | 0.0579*** (0.0021) | |||||
| Field FE | Yes | Yes | Yes | Yes | Yes | Yes | Yes |
| Year FE | Yes | Yes | Yes | Yes | Yes | Yes | Yes |
| Observations | 13,180,603 | 13,180,603 | 13,180,603 | 13,180,603 | 13,180,603 | 12,262,497 | 12,262,497 |
| Pseudo R2 | 0.05826 | 0.08234 | 0.0755 | 0.06733 | 0.06115 | 0.05924 | 0.08252 |
Note: Robust standard errors are reported in parentheses. * p < 0.05, ** p < 0.01, *** p < 0.001. |
Table 2. The effect of the CD index on citation count with author career-level controls. |
| Models | (1) | (2) | (3) | (4) | (5) | (6) | (7) |
|---|---|---|---|---|---|---|---|
| DV: 5-year citation count (Poisson regression) | |||||||
| 5-year CD index | -0.1993*** (0.0133) | -0.1012*** (0.0137) | 0.0429** (0.0146) | 0.0590*** (0.0146) | 0.2263*** (0.0157) | 0.2307*** (0.0157) | 0.3443*** (0.0166) |
| ln (Avg career age+1) | 0.3368*** (0.0011) | -0.3891*** (0.0019) | |||||
| ln (Avg career productivity+1) | 0.2601*** (0.0007) | -0.2974*** (0.0058) | |||||
| ln (Max career productivity +1) | 0.2445*** (0.0005) | -0.0278*** (0.0048) | |||||
| ln (Avg career citations +1) | 0.2198*** (0.0005) | 0.4242*** (0.0044) | |||||
| ln (Max career citations+1) | 0.2065*** (0.0004) | 0.0573*** (0.0040) | |||||
| Field FE | Yes | Yes | Yes | Yes | Yes | Yes | Yes |
| Year FE | Yes | Yes | Yes | Yes | Yes | Yes | Yes |
| Observations | 13,180,603 | 13,180,603 | 13,180,603 | 13,180,603 | 13,180,603 | 13,180,603 | 13,180,603 |
| Pseudo R2 | 0.05826 | 0.08442 | 0.11291 | 0.12075 | 0.16595 | 0.1694 | 0.20231 |
Note: Robust standard errors are reported in parentheses. * p < 0.05, ** p < 0.01, *** p < 0.001. |
Table 3. The effect of the CD index on citation count with reference-level controls. |
| Models | (1) | (2) | (3) | (4) | (5) | (6) |
|---|---|---|---|---|---|---|
| DV: 5-year citation count (Poisson regression) | ||||||
| 5-year CD index | -0.1993*** (0.0133) | 0.6228*** (0.0204) | 0.2267*** (0.0123) | -0.0006 | 0.0310 (0.0170) | 1.920*** (0.0212) |
| ln(Ref count) | 0.5939*** (0.0013) | 0.8642*** (0.0016) | ||||
| ln(Ref age+1) | -0.4257*** (0.0011) | -0.7780*** (0.0019) | ||||
| ln(Avg ref cit+1) | 0.1910*** (0.0005) | 0.6947*** (0.0021) | ||||
| ln(Max ref cit+1) | 0.1478*** (0.0003) | -0.4027*** (0.0014) | ||||
| Field FE | Yes | Yes | Yes | Yes | Yes | Yes |
| Year FE | Yes | Yes | Yes | Yes | Yes | Yes |
| Observations | 13,180,603 | 13,180,603 | 13,180,603 | 13,180,603 | 13,180,603 | 13,180,603 |
| Pseudo R2 | 0.05826 | 0.16705 | 0.08522 | 0.09294 | 0.09803 | 0.27983 |
Note: Robust standard errors are reported in parentheses. * p < 0.05, ** p < 0.01, *** p < 0.001. |
4.4 Mechanisms behind the influence of reference behavior
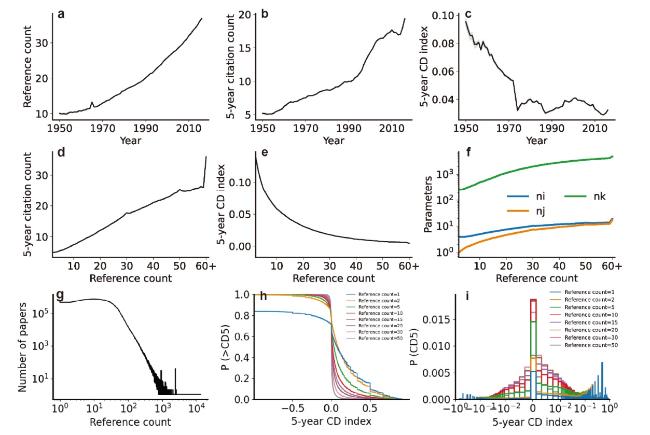
Figure 5. Reference counts as a contributing factor to the bias against CD index. (a) The average reference count of papers increases over time. (b) The average 5-year citation count of papers increases over time. (c) The average 5-year CD index of papers decreases over time. (d) Papers with higher reference count are associated with higher 5-year citation count. (e) Papers with higher reference count are associated with higher 5-year CD index. (f) Papers with higher reference count are associated with higher parameters of 5-year CD index (ni, nj, and nk). (g) The number of papers with different reference count follows log-normal distribution. (h-i) The complementary cumulative distribution function (ccdf) and probability density function (pdf) of the CD index for papers with varying reference counts. Shaded areas indicate 95% confidence intervals. |
5 Patterns of alternative innovation measures
5.1 New words, new word combination and their reuse
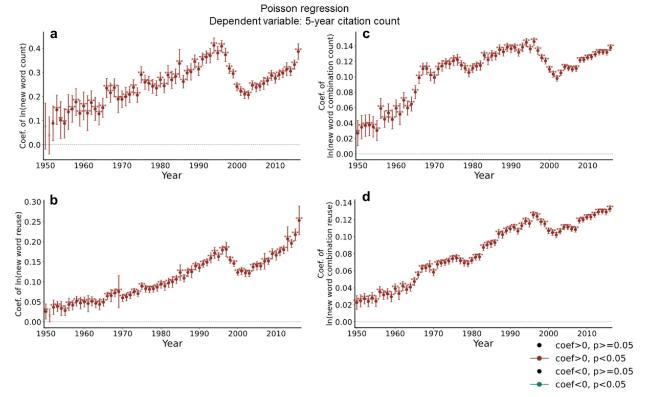
Figure 6. Yearly split-sample Poisson regression coefficients of new words, new word combinations, and their reuse on citation counts from 1950 to 2016. Error bars depict the upper and lower bounds of the 95% confidence intervals based on robust standard errors. Dark-red coloring indicates significant positive coefficients (p <0.05), and light-red coloring indicates non-significant positive coefficients. * p < 0.05, ** p < 0.01, *** p < 0.001. |
Table 4. The effect of the number of new words on citation count with reference-level controls. |
| Models | (1) | (2) | (3) | (4) | (5) | (6) |
|---|---|---|---|---|---|---|
| DV: 5-year citation count (Poisson regression) | ||||||
| ln(New words count+1) | 0.2191*** (0.0021) | 0.2195*** (0.0020) | 0.2094*** (0.0021) | 0.1970*** (0.0021) | 0.1956*** (0.0021) | 0.1771*** (0.0020) |
| ln(Ref count) | 0.6233*** (0.0009) | 0.8398*** (0.0011) | ||||
| ln(Ref age+1) | -0.4137*** (0.0009) | -0.6649*** (0.0015) | ||||
| ln(Avg ref cit+1) | 0.1836*** (0.0004) | 0.6474*** (0.0017) | ||||
| ln(Max ref cit+1) | 0.1439*** (0.0002) | -0.3873*** (0.0011) | ||||
| Field FE | Yes | Yes | Yes | Yes | Yes | Yes |
| Year FE | Yes | Yes | Yes | Yes | Yes | Yes |
| Observations | 25,263,987 | 25,263,987 | 25,174,032 | 25,262,880 | 25,262,880 | 25,174,032 |
| Pseudo R2 | 0.06392 | 0.17867 | 0.08835 | 0.09575 | 0.10168 | 0.26690 |
Note: Robust standard errors are reported in parentheses. * p < 0.05, ** p < 0.01, *** p < 0.001. |
Table 5. The effect of new word reuse on citation count with reference-level controls. |
| Models | (1) | (2) | (3) | (4) | (5) | (6) |
|---|---|---|---|---|---|---|
| DV: 5-year citation count (Poisson regression) | ||||||
| ln(New words reuse+1) | 0.1213*** (0.0011) | 0.1180*** (0.0011) | 0.1147*** (0.0011) | 0.1112*** (0.0011) | 0.1113*** (0.0011) | 0.0936*** (0.0011) |
| ln(Ref count) | 0.6230*** (0.0009) | 0.8390*** (0.0011) | ||||
| ln(Ref age+1) | -0.4117*** (0.0009) | -0.6622*** (0.0015) | ||||
| ln(Avg ref cit+1) | 0.1827*** (0.0004) | 0.6453*** (0.0017) | ||||
| ln(Max ref cit+1) | 0.1434*** (0.0002) | -0.3865*** (0.0011) | ||||
| Field FE | Yes | Yes | Yes | Yes | Yes | Yes |
| Year FE | Yes | Yes | Yes | Yes | Yes | Yes |
| Observations | 25,263,987 | 25,263,987 | 25,174,032 | 25,262,880 | 25,262,880 | 25,174,032 |
| Pseudo R2 | 0.06638 | 0.18096 | 0.09056 | 0.09790 | 0.10385 | 0.26838 |
Note: Robust standard errors are reported in parentheses. * p < 0.05, ** p < 0.01, *** p < 0.001. |
Table 6. The effect of the number of new word combinations on citation count with reference-level controls. |
| Models | (1) | (2) | (3) | (4) | (5) | (6) |
|---|---|---|---|---|---|---|
| DV: 5-year citation count (Poisson regression) | ||||||
| ln(New words count+1) | 0.0978*** (0.0004) | 0.0665*** (0.0004) | 0.1002*** (0.0004) | 0.0894*** (0.0004) | 0.0841*** (0.0004) | 0.0598*** (0.0004) |
| ln(Ref count) | 0.6144*** (0.0010) | 0.8333*** (0.0011) | ||||
| ln(Ref age+1) | -0.4242*** (0.0009) | -0.6654*** (0.0015) | ||||
| ln(Avg ref cit+1) | 0.1800*** (0.0004) | 0.6491*** (0.0017) | ||||
| ln(Max ref cit+1) | 0.1398*** (0.0002) | -0.3900*** (0.0011) | ||||
| Field FE | Yes | Yes | Yes | Yes | Yes | Yes |
| Year FE | Yes | Yes | Yes | Yes | Yes | Yes |
| Observations | 25,263,987 | 25,263,987 | 25,174,032 | 25,262,880 | 25,262,880 | 25,174,032 |
| Pseudo R2 | 0.07284 | 0.18198 | 0.09806 | 0.10322 | 0.10814 | 0.26989 |
Note: Robust standard errors are reported in parentheses. * p < 0.05, ** p < 0.01, *** p < 0.001. |
Table 7. The effect of new word combination reuse on citation count with reference-level controls. |
| Models | (1) | (2) | (3) | (4) | (5) | (6) |
|---|---|---|---|---|---|---|
| DV: 5-year citation count (Poisson regression) | ||||||
| ln(New words reuse+1) | 0.0970*** (0.0003) | 0.0741*** (0.0003) | 0.0952*** (0.0003) | 0.0888*** (0.0003) | 0.0860*** (0.0003) | 0.0597*** (0.0003) |
| ln(Ref count) | 0.6078*** (0.0010) | 0.8260*** (0.0011) | ||||
| ln(Ref age+1) | -0.4181*** (0.0009) | -0.6545*** (0.0014) | ||||
| ln(Avg ref cit+1) | 0.1755*** (0.0004) | 0.6402*** (0.0017) | ||||
| ln(Max ref cit+1) | 0.1363*** (0.0002) | -0.3860*** (0.0011) | ||||
| Field FE | Yes | Yes | Yes | Yes | Yes | Yes |
| Year FE | Yes | Yes | Yes | Yes | Yes | Yes |
| Observations | 25,263,987 | 25,263,987 | 25,174,032 | 25,262,880 | 25,262,880 | 25,174,032 |
| Pseudo R2 | 0.08425 | 0.19005 | 0.10848 | 0.11290 | 0.11761 | 0.27463 |
Note: Robust standard errors are reported in parentheses. * p < 0.05, ** p < 0.01, *** p < 0.001. |
5.2 Atypical combinations of knowledge
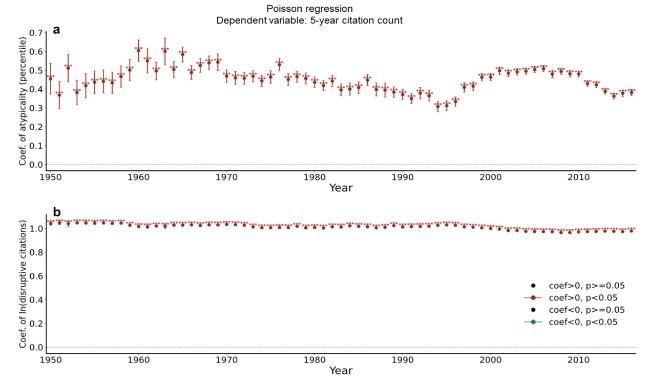
Figure 7. Yearly split-sample Poisson regression coefficients of atypicality and disruptive citations on citation count from 1950 to 2016. Error bars depict the upper and lower bounds of the 95% confidence intervals based on robust standard errors. Dark-red coloring indicates significant positive coefficients (p <0.05), and light-red coloring indicates non-significant positive coefficients. * p < 0.05, ** p < 0.01, *** p < 0.001. |
Table 8. The effect of atypicality on citation counts with reference-level controls. |
| Models | (1) | (2) | (3) | (4) | (5) | (6) |
|---|---|---|---|---|---|---|
| DV: 5-year citation count (Poisson regression) | ||||||
| Atypicality (percentile) | 0.4457*** (0.0018) | 0.0249*** (0.0019) | 0.5505*** (0.0017) | 0.3110*** (0.0018) | 0.2475*** (0.0019) | 0.0217*** (0.0018) |
| ln(Ref count) | 0.6557*** (0.0009) | 0.8536*** (0.0011) | ||||
| ln(Ref age+1) | -0.5450*** (0.0010) | -0.6462*** (0.0014) | ||||
| ln(Avg ref cit+1) | 0.1764*** (0.0004) | 0.6479*** (0.0017) | ||||
| ln(Max ref cit+1) | 0.1407*** (0.0002) | -0.3834*** (0.0011) | ||||
| Field FE | Yes | Yes | Yes | Yes | Yes | Yes |
| Year FE | Yes | Yes | Yes | Yes | Yes | Yes |
| Observations | 27,656,587 | 27,656,587 | 27,584,165 | 27,656,569 | 27,656,569 | 27,584,165 |
| Pseudo R2 | 0.06756 | 0.17913 | 0.10371 | 0.09461 | 0.0997 | 0.26379 |
Note: Robust standard errors are reported in parentheses. * p < 0.05, ** p < 0.01, *** p < 0.001. |
5.3 Disruptive citations
Disruptive citation=ni
Table 9. The effect of disruptive citations on citation count with reference level controls. |
| Models | (1) | (2) | (3) | (4) | (5) | (6) |
|---|---|---|---|---|---|---|
| DV: 5-year citation count (Poisson regression) | ||||||
| ln(Disruptive citations+1) | 0.9791*** (0.0004) | 0.9435*** (0.0004) | 0.9657*** (0.0004) | 0.9682*** (0.0004) | 0.9663*** (0.0004) | 0.8993*** (0.0005) |
| ln(Ref count) | 0.1827*** (0.0004) | 0.2734*** (0.0006) | ||||
| ln(Ref age+1) | -0.2951*** (0.0005) | -0.3831*** (0.0007) | ||||
| ln(Avg ref cit+1) | 0.0497*** (0.0002) | 0.1780*** (0.0007) | ||||
| ln(Max ref cit+1) | 0.0435*** (0.0001) | -0.0992*** (0.0005) | ||||
| Field FE | Yes | Yes | Yes | Yes | Yes | Yes |
| Year FE | Yes | Yes | Yes | Yes | Yes | Yes |
| Observations | 29,009,690 | 29,009,690 | 28,888,580 | 29,007,831 | 29,007,831 | 28,888,580 |
| Pseudo R2 | 0.70948 | 0.71983 | 0.71953 | 0.71123 | 0.71217 | 0.73775 |
Note: Robust standard errors are reported in parentheses. * p < 0.05, ** p < 0.01, *** p < 0.001. |