

1 Introduction
A significant degree of skewness exists in output distribution among individuals engaged in certain activities (Cox & Chung, 1991). The phenomenon known as “success breeds success,” in which a relatively small number of individuals dominate their respective fields, is frequently observed across various social contexts (Holliday et al., 2013). For example, within introductory-level economics, a few textbooks achieve best-seller status despite over a hundred different titles (Cox & Chung, 1991). The observation that the academic landscape exhibits significant skew is well-established in scholarly discourse (Huber, 1998). Pioneering researchers, such as Bradford, Lotka, and Zipf, have long demonstrated that skewness represents a fundamental characteristic of academic publishing (Baum, 2012). Numerous studies conducted over the past years have found that Lotka’s Law (Lotka, 1926) effectively describes productivity in a wide range of academic fields, such as economics (Cox & Chung, 1991), information science (Sobrino et al., 2009), medicine (Holliday et al., 2013), and environmental science and ecology (Parker et al., 2013), as well as in patents and research projects. Skewness, which can manifest as positive or negative, signifies a deviation from a normal distribution. A positive skew, prevalent in academia, indicates that the distribution’s right tail is longer than the left, with most observations clustered to the left of the mean. Within science, the term “skewed few” refers to those journals, articles, and authors that occupy the “fat” right tails of publication, orientation, patents, projects, and citation distributions (Baum, 2012). These individuals are regarded as the distinguished elite, and their presence in these tails is increasingly interpreted as an indicator of quality (Parker et al., 2010).
The academic elite, a relatively small group of researchers, produces knowledge of significant relevance,which is widely disseminated (and cited) within the scientific community (Ahmad et al., 2022; Han et al., 2024; Lotka, 1926; Parker et al., 2010). They accumulate many publications and citations, lead large research projects, and are recognized for prestigious awards (Azoulay et al., 2017; Li et al., 2019). The situation is no different if we focus on Brazil.
In Brazil, several studies demonstrate that Lotka’s and Bradford’s laws are valid for publications and citations (Pereira, 2006; da Silva et al., 2019). The elite researchers in Brazil are largely represented by productivity scholarship holders, a highly selective group of researchers who receive financial support from the National Council for Scientific and Technological Development (CNPq) (Gomes et al., 2023; Leite & Neto, 2017). About 14,000 of Brazil’s over 130,000 PhDs benefit from the research productivity scholarship program. These scholars (popularly known as PQ scholarship) are recognized for their excellence and consistency in scientific productivity, including supervision of graduate students. They significantly contribute to Brazil’s high rankings in indices like the SJR Scimago ①, placing the country in the 14th and 17th positions for articles and citations, respectively.
Given their importance, elite researchers have been the focus of recent studies. For instance, Han et al. (2024) examined their patterns of international mobility, while Xie et al. (2022) investigated the positive effects of co-authorship with these top scientists. However, there is a surprising lack of knowledge about the characteristics of elite researchers (Alves & da Silva, 2022; Parker et al., 2010, 2013). Existing research typically analyzes general characteristics, e.g., the number of publications, citations, research groups, or specific fields (Ahmad et al., 2022; Araújo & Bufrem, 2021). Particularly in Brazil, there is a relevant body of literature analyzing the “PQ researchers”. These studies are divided into two main groups. The first analyzes the gender differences or gender inequality (Cunha et al., 2021; Guedes et al., 2015; Oliveira et al., 2021). These efforts generally analyze asymmetries in the distribution of PQ grants, describe factors that influence this inequality, and add to a vast literature on gender inequality in the sciences. The second group of studies analyzed a set of characteristics (e.g., academic publications and type of supervision of the PQ researchers in specific areas of knowledge, including medicine (Martelli et al., 2019; Mendes et al., 2010), and health sciences (Gomes et al., 2023)).
While these efforts are relevant, they fail to address three significant gaps in the literature on elite researchers. First, they often focus on a specific field of knowledge. Second, many studies analyze small samples of researchers, such as Martins and Schäfer (2023) (n=19), which may limit the generalization of their findings. Finally, the third gap is that studies frequently rely solely on descriptive statistics, which can constrain the conclusions drawn.
Using a large Brazilian database, our article aims to understand the characteristics of elite Brazilian researchers through a profile-based approach. We used multivariate techniques (Principal Component Analysis - PCA, and cluster analysis, particularly, cluster hierarchical and K-means) to cluster the elite researchers in homogeneous groups. These methodological procedures show the existence of patterns, which can contribute to improving the general understanding of the elite researcher profile. Therefore, we present information on various academic activities that are still not explored, such as the number of published books and citations. Thus, according to the groups formed, this study contributes to analyzing the performance and disparities of Brazilian elite researchers, filling the abovementioned gaps in the current bibliometric and scientometrics literature.
The remainder of this study is structured as follows. Section 2 describes the methodological aspects, including data and a brief presentation of the statistical analysis. The results are presented and discussed in section 3. Finally, a summary of the results and areas of future research are provided in Section 4.
2 Methodology
2.1 Data description
For this work, we consider the Brazilian elite researchers to be the recipients of the university’s productivity grant by CNPq (from the Portuguese, “Conselho Nacional de Desenvolvimento Científico e Tecnológico”). This grant is awarded to researchers who excel in scientific, technological, and innovation activities. The PQ scholarship aims to recognize and encourage ongoing high-quality research in Brazil. The selection for the PQ grant is based on an evaluation of the researcher’s curriculum vitae (CV), recent scientific output, and the impact of their research. In addition to providing financial support, the grant serves as a mark of peer recognition for researchers with outstanding scientific contributions (Gomes et al., 2023; Leite & Neto, 2017). Given this backdrop, productive scholarship has gained increasing attraction and importance since the mid-1990s, when there was an increase in public expenditure on science and technology activities in Brazil (Alves & da Silva, 2022; Gomes et al., 2023; Guedes et al., 2015).
The PQ scholarship is highly competitive and is organized into different levels, namely PQ-Sr, PQ-A, PQ-B, PQ-C, PQ-D, and PQ-E. ② PQ-E is considered an entry-level scholarship for researchers who are consolidating their careers. The PQ-A, PQ-B, PQ-C and PQ-D categories, with PQ-A being the highest level, are intended for researchers with outstanding scientific production and leadership in their field of activity (CNPq, 2024). Also noteworthy is the senior modality (PQ-Sr), aimed at researchers with successive grant renewals and notable prominence in their field of knowledge.
Data used in the article were sourced from the Lattes CV, which, after 1999, replaced the previous paper-based and non-integrated electronic systems. Lattes is internationally recognized as an exemplary model of academic practice, serving as a comprehensive database for storing, analyzing, and evaluating Brazilian research activities and outputs. Researchers widely use this platform to record their scholarly activities, such as article publications, research projects, and advising ③. The Lattes CV facilitates the management of academic information, and it has been utilized in various studies to analyze the profile of researchers and their publications (Borenstein et al., 2022; Perlin et al., 2021). As Lattes CV is a performance assessment tool, researchers are highly motivated to keep their profiles updated (Borenstein et al., 2022).
We collected data from all PhD researchers registered in the Lattes database from 2022 onwards. After filtering out entries with missing information, the dataset contained bibliometric data for 133,847 researchers. Thus, we selected only the PQ researchers (n=14,003). Specifically, we analyzed data on:
• Researcher’s characteristics, such as the number of citations and years of PhD;
• Graduate and undergraduate supervisions;
• Books’ characteristics (published books, edited books, and book chapters) and;
• Scientific papers (number of publications and proportion of studies in English).
2.2 Analysis method
This paper presents a set of procedures to examine the profile of elite researchers. First, the data were “normalized” based on the number of years since each researcher obtained their PhD, generating standardized scores for several variables. These scores represent the average value of each variable per year. For example, if a researcher has held a PhD for 15 years and has published 15 articles, their score for the number of articles variable would be 1.
Given that multiple variables were analyzed, a dimensionality reduction analysis was initially performed using PCA, a well-known statistical technique to reduce the dimensionality of a dataset by grouping correlated variables into components. PCA is necessary to manage the high number of variables in our dataset, allowed us to eliminate overlap among variables, and retain the main patterns of variation using just a few components. These components are ordered such that the first component captures most of the data variability (Field, 2024). Before running the PCA, the data suitability for this analysis was assessed. The Kaiser-Meyer-Olkin (KMO) measure of sampling adequacy was greater than 0.6 (0.677), verifying that the dataset was appropriate for the PCA. Subsequently, Bartlett’s test of sphericity was found to be significant (p < 0.05), indicating that PCA could proceed. Based on the Kaiser criterion with eigenvalues greater than 1, the selected factors explained 65.4 percent of the variance.
Later, to understand the profile of researchers awarded the highest level grants in Brazil, we isolated the individuals with the PQ1-A and PQ1-B grants within our sample. The PQ grant is awarded based on scientific merit, academic productivity, and the researcher’s significance within their field. Researchers in the PQ-2 category typically consolidate their initial leadership and academic maturity. In contrast, the PQ-1 category is reserved for distinguished researchers with a well-established record of scholarly output and leadership in publications and research projects. We further analyze the PQ-A and PQ-B researchers, ④ denominated as the high-caliber scientists.
3 Results and discussions
Table 1 details the PCA results. We found the following three components: (1) advanced supervision and article publications (ASAP), (2) book outlet focus (BOF), and (3) master’s, undergraduate, and scientific initiation supervision (MUS).
Table 1. Factor loadings of the researchers’ variables. |
| Variable | ASAP | BOF | MUS | Communalities |
|---|---|---|---|---|
| Master’s dissertation supervision | .728 | .655 | ||
| Doctoral thesis supervision | .656 | .590 | ||
| Undergraduate thesis supervision | .786 | .655 | ||
| Scientific initiation supervision | .726 | .564 | ||
| Posdoctoral supervision | .653 | .461 | ||
| Published books | .750 | .596 | ||
| Edited books | .822 | .693 | ||
| Published book chapters | .851 | .771 | ||
| Amount of scientific papers | .873 | .796 | ||
| Proportion of scientific papers in English | .876 | .811 | ||
| Eigenvalues | 3.13 | 2.13 | 1.28 | |
| Explained variance (%) | 31.34 | 21.31 | 12.80 |
The PCA’s factor scores (regression scores) were analyzed using Ward’s hierarchical clustering and K-means clustering methods (Burns & Burns, 2008). Firstly, the scores were used for Ward’s hierarchical clustering technique. The dendrogram resulting from hierarchical clustering helped to determine the appropriate number of clusters, which can be used in non-hierarchical clustering methods such as K-means. Ward’s hierarchical clustering results show that the ideal number of clusters for the successive K-means clustering method is n = 3. The K-means method was performed, which minimizes the distances within each cluster to the cluster’s center (Singh et al., 2013). Afterward, the researchers in the sample were grouped into their respective clusters. The scores of final clusters derived from the K-means cluster and used to group the sample are in Table 2 and Figure 1, respectively.
Table 2. Scores of the final centers of clusters. |
| Cluster | Sample | % of sample | ASAP | BOF | MUS |
|---|---|---|---|---|---|
| The advanced supervisors | 3398 | 0.244 | 0.200 | -0.235 | 1.30 |
| The book publisher/organizer | 1141 | 0.081 | -0.043 | 2.57 | -0.013 |
| The generalists | 9464 | 0.675 | -0.06 | -0.22 | -0.46 |
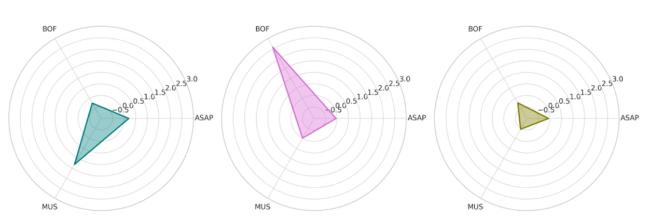
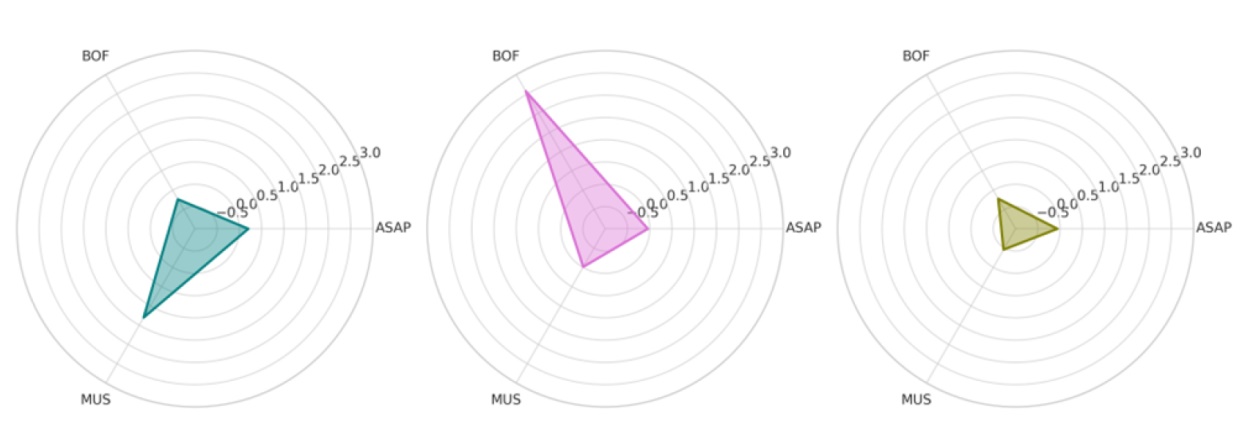
Figure 1. Radar diagrams illustrating the scores of the three identified clusters across the three PCA components, derived from the cluster centers presented in Table 2. Green represents the advanced supervisors, pink, the book publisher/organizer and yellow, the generalists. |
3.1 General characteristics of elite researchers
Table 3 provides general information about the elite researchers. Except for “years of PhD” and “years of PQ” (the number of years the researcher has received the productivity grant), the other variables are analyzed normalized per year, as described in the methodology. With the normalization, we prevent years of academic experience from altering the results, especially about countable variables.
Table 3. Descriptive statistics of elite researchers. |
| Variable | Mean | Median | SD | Min. | Max. |
|---|---|---|---|---|---|
| Years of PhD | 24.97 | 24.00 | 9.02 | 3.00 | 69.00 |
| Published Books | 0.08 | 0.02 | 0.16 | 0.00 | 3.11 |
| Published book chapters | 0.58 | 0.28 | 0.84 | 0.00 | 11.00 |
| Edited books | 0.08 | 0.00 | 0.20 | 0.00 | 3.89 |
| Years PQ | 12.71 | 14.00 | 5.06 | 0.00 | 18.00 |
| Published scientific papers | 3.91 | 3.05 | 3.29 | 0.00 | 47.33 |
| Proportion of scientific papers in English | 2.36 | 1.73 | 2.62 | 0.00 | 46.33 |
| Master’s dissertation supervisions | 0.90 | 0.78 | 0.63 | 0.00 | 7.43 |
| Doctoral thesis supervisions | 0.55 | 0.48 | 0.40 | 0.00 | 5.65 |
| Undergraduate thesis supervisions | 0.60 | 0.26 | 0.91 | 0.00 | 19.50 |
| Scientific initiation supervisions | 0.95 | 0.71 | 0.94 | 0.00 | 15.56 |
| Postdoctoral supervisions | 0.12 | 0.06 | 0.18 | 0.00 | 3.33 |
The results indicate that while the average time since earning a PhD is nearly 25 years, some researchers are recent graduates, having completed their PhDs just three years ago. These early-career researchers likely demonstrated substantial scientific productivity during their doctoral studies. Such early publications play a pivotal role in fostering the development of scientific and academic competencies, underscoring the potential of emerging scientists to conduct impactful research and produce high-quality outputs (Horta & Santos, 2016; Mangematin, 2000).
The findings in Table 3 also show a discrepancy in supervision at graduation. In this regard, we found that some researchers have high supervision rates. Analyzing the database used in this paper, we also note that, eleven researchers oversee at least five master’s theses annually, and sixteen supervise at least three doctoral theses yearly. At the undergraduate level, nine researchers oversee at least nine supervisions by year. The findings also indicate that over 11,000 researchers supervise at most one undergraduate thesis per year.
The average number of articles published annually among the researchers is approximately four. Notably, two researchers stand out, averaging over 40 articles annually. Furthermore, according to the dataset, while 76 researchers publish at least 20 articles yearly. This high productivity is likely attributed to extensive collaboration with research groups and institutions and active involvement in supervising theses and dissertations (see Fan et al. (2022) for further discussion on the role of research collaboration). Conversely, 1,125 researchers produce no publications annually, on average. Given that normalized data were used, the results may indicate that many researchers have held a PhD for a long time, but have only recently been granted a productivity scholarship. These findings underscore a striking disparity within the elite group, where few researchers drive most knowledge production.
Another interesting result is the large variation in the proportion of scientific publications in English (with an average of 2.36 and a maximum of 46.33), which indicates a substantial difference in the proportion of articles published in English among the elite researchers. It seems there is a tendency for elite researchers to publish in English, assuming that this will make their articles more visible and cited (see, Di Bitetti & Ferreras (2017)). Although this trend may be related to the research field, the target audience, or access to international scientific journals, it may be the essence of an elite researcher.
3.2 Clusters of elite researchers
This section outlines the characteristics of the groups formed through the methodological procedures used, i.e., “The advanced supervisor” (AS), “The book publisher/organizer” (BP), and “The generalists” (G). Table 4 presents descriptive statistics of the clusters. Using the Kruskal-Wallis test and Dunn’s posthoc test, it was found that all variables analyzed in Table 4 exhibit significant differences between groups (p < 0.05). The exception was “Doctoral thesis supervisions” for the “AS” and the “BP”. The chi-square test yielded χ2 = 3476.7, df = 14, p-value < 0.001, indicating a significant difference between the clusters. “AS” is more represented in fields such as Agricultural Sciences, Engineering, and Exact and Earth Sciences. “BP” concentrates more on the Humanities, Linguistics, and Arts. “G” is stronger in Biological Sciences, Exact and Earth Sciences, and Engineering. More details in Table 5.
Table 4. Descriptive statistics of elite researchers by clusters. |
| Variable | Mean | Median | Standard deviation | ||||||
|---|---|---|---|---|---|---|---|---|---|
| AS | BP | G | AS | BP | G | AS | BP | G | |
| Years of PhD | 20.19 | 23.33 | 26.88 | 20.00 | 23.00 | 26.00 | 6.22 | 8.02 | 9.30 |
| Published books | 0.06 | 0.37 | 0.04 | 0.03 | 0.27 | 0.00 | 0.10 | 0.35 | 0.07 |
| Published book chapters | 0.61 | 2.38 | 0.36 | 0.41 | 2.05 | 0.19 | 0.63 | 1.52 | 0.43 |
| Edited books | 0.06 | 0.52 | 0.03 | 0.00 | 0.42 | 0.00 | 0.11 | 0.45 | 0.07 |
| Amount of citations | 24.66 | 8.26 | 23.96 | 7.86 | 0.26 | 7.40 | 97.77 | 41.20 | 76.63 |
| Mean of citations by publications | 14.02 | 6.63 | 20.39 | 9.75 | 2.00 | 13.04 | 30.74 | 42.58 | 50.15 |
| Minimum of citations by publications | 1.41 | 1.09 | 2.02 | 1.00 | 1.00 | 1.00 | 3.49 | 2.76 | 15.07 |
| Maximum of citations by publications | 87.03 | 45.18 | 135.51 | 37.50 | 3.00 | 47.00 | 261.76 | 296.54 | 438.83 |
| Number of scientific papers | 5.25 | 3.92 | 3.43 | 4.29 | 2.76 | 2.71 | 3.85 | 3.72 | 2.85 |
| Proportion of first author | 0.82 | 1.72 | 0.71 | 0.58 | 1.41 | 0.52 | 0.85 | 1.33 | 0.68 |
| Mean of authors by publication | 5.64 | 2.77 | 7.13 | 5.20 | 2.10 | 4.88 | 6.03 | 2.66 | 35.86 |
| Proportion articles in English | 2.88 | 0.98 | 2.35 | 2.14 | 0.20 | 1.79 | 2.99 | 2.26 | 2.46 |
| Proportion articles in Portuguese | 2.34 | 2.85 | 1.06 | 1.68 | 2.19 | 0.70 | 2.18 | 2.47 | 1.13 |
| Proportion articles in Spanish | 0.02 | 0.06 | 0.01 | 0.00 | 0.00 | 0.00 | 0.08 | 0.15 | 0.04 |
| Master’s dissertation supervisions | 1.53 | 1.17 | 0.65 | 1.40 | 1.04 | 0.61 | 0.70 | 0.63 | 0.39 |
| Doctoral thesis supervisions | 0.77 | 0.73 | 0.45 | 0.67 | 0.67 | 0.41 | 0.52 | 0.43 | 0.30 |
| Undergraduate thesis supervision | 1.48 | 0.82 | 0.26 | 1.20 | 0.52 | 0.12 | 1.28 | 1.05 | 0.34 |
| Scientific initiation supervision | 1.88 | 1.03 | 0.60 | 1.71 | 0.84 | 0.50 | 1.20 | 0.88 | 0.51 |
| Postdoctoral supervision | 0.14 | 0.17 | 0.11 | 0.08 | 0.11 | 0.05 | 0.19 | 0.21 | 0.17 |
Table 5. The science fields of the elite researchers. |
| Absolute (relative) frequency | |||
|---|---|---|---|
| Field | AS | BP | G |
| Agricultural | 761 (41.56%) | 71 (3.88%) | 999 (54.56%) |
| Applied Social | 368 (36.22%) | 183 (18.01%) | 465 (45.73%) |
| Health | 357 (23.91%) | 86 (5.76%) | 1050 (70.33%) |
| Biological | 421 (18.19%) | 19 (0.82%) | 1875 (80.99%) |
| Humanities | 261 (15.71%) | 559 (33.65%) | 840 (50.57%) |
| Linguistics and Arts | 53 (11.67%) | 167 (36.78%) | 234 (51.54%) |
| Exact and Earth | 466 (14.44%) | 30 (0.93%) | 2731 (84.63%) |
| Engineering | 711 (35.43%) | 26 (1.30%) | 1270 (63.28%) |
| Relative proportion | 24.2% | 8.1% | 67.5% |
Based on the results shown in Table 4, “AS” presents the lowest average years of PhD (20.19) compared to “BP” (23.33) and “G” (26.88). “AS” comprises researchers who excel in graduate supervision and publication output, particularly in scientific journals. The prominence of supervision activities within this group underscores their pivotal role in mentoring the next generation of researchers (Lei & Hu, 2015), as evidenced by their high averages in master’s and doctoral supervision. This group demonstrates high research productivity, publishing a substantial number of articles (an average of 5.25) frequently in international journals. This highlights their integration into the global scientific community and underscores the significance of collaborative structures. Notably, this cluster exhibits the highest averages in both master’s and doctoral thesis supervisions, suggesting collaboration with supervised students is critical in enhancing research output (Uddin et al., 2019).
While several factors influence citation counts, including author reputation, the institutions with which authors are affiliated, and the paper’s impact (Tahamtan et al., 2016; Waltman et al., 2013), the amount of paper also is relevant. “AS” is the most productive in terms of the average number of articles and the proportion published in English, so it is expected to attain higher citation metrics. The results in Table 4 confirm this, with “AS” achieving a mean of 24.66 citations, slightly surpassing the average of “G”.
“BP” has almost 80% researchers from Applied Social Sciences, Humanities, and Linguistics and Arts (Table 5). This cluster has higher averages regarding published books and book chapters in these metrics. While less prolific in journal publications and supervision than the advanced supervisors, this group plays a critical role in knowledge dissemination through monographs and edited volumes. Therefore, the distinctiveness of this cluster suggests that the academic contributions of elite researchers are not solely determined by journal articles but also by their ability to synthesize and organize knowledge into larger, comprehensive works. This cluster presents the lower mean in the number of authors by publication. This suggests that these researchers may develop their research in small groups or independently. These factors can affect the number of scientific publications in academic journals. Furthermore, the proportion of articles published in Portuguese in this cluster is the highest compared to the other clusters (2.85), indicating a greater focus on publications aimed at the local or Portuguese-speaking community. This group is, on average, less concerned with the “publish in English or perish” mindset, widely diffused in other scientific fields (Di Bitetti & Ferreras, 2017).
“G” has the highest values for both mean and maximum citations. However, on average, it published fewer scientific articles than other clusters. This suggests that, although it publishes less, its work tends to have a significant academic impact. The higher maximum number of citations evidences this in a publication (135,51), which indicates that some of its articles achieve great relevance in the field. This cluster exhibits a broad range of academic activities but does not excel in any specific area compared to the other clusters. These researchers tend to be involved in both supervision and publications, though at a more moderate level. Their presence in the most traditional scientific fields, especially biological, health, humanities, and exact and earth fields, indicates that this cluster has made a diverse contribution to scientific progress. “The generalists” balanced profile highlights their role as versatile contributors who participate in multiple academic functions without specializing in one aspect. Based simultaneously on the tradition and importance of these areas for scientific research, this cluster tends to advance Brazilian science. Its representatives are in the most important positions and management roles concerning higher education and scientific development, defining evaluation criteria for science and allocating financial resources. This cluster generally represents the typical behavior of elite researchers in Brazil.
Table 5 shows that most Brazilian elite researchers are categorized in “G” (67.5%), e.g., they carry out the main activities related to academic research in a balanced way. This result was expected, as the internal evaluation at each university and research center and the productivity grant motivate this behavior, in which all aspects are evaluated, although with different weights. Only 8.1% of all the evaluated research belongs to “BP”, concentrated in three areas: Applied Social, Humanities, and Linguistics and Arts. The specificities of the Brazilian context for teaching justify the valorization of books for these areas. For example, the justice system and the Brazilian economy present peculiarities that foreign books cannot present. The same goes for the area of Linguistics and Arts, which has an essentially national context. For other fields of a more technical nature, the adoption of classic foreign books is fully acceptable.
“AS” is represented by the second largest number of researchers (24.4%). This cluster is more influential in applied sciences, such as Agricultural and Engineering, where research is highly dependent on experiments conducted in labs or case studies with the assistance of graduate students.
3.3 The high-caliber scientists
Table 6 describes the high-caliber scientists based on the identified clusters. That is, the PQ-A and PQ-B. The number of high-caliber researchers is around 17.70% of our sample and around 1.85% of all researchers with CVs in the Lattes platform. These grants are not distributed equally. Regarding the clusters, the distribution between categories generally follows the results for all elite researchers, with a clear predominance of “G”. This result confirms the generalist nature of academic research in Brazil.
Table 6. The science fields of the super-elite researchers. |
| Absolute (relative) frequency | |||
|---|---|---|---|
| Field | AS | BP | G |
| Agricultural | 114 (37.38%) | 19 (6.23%) | 172 (56.39%) |
| Applied Social | 21 (17.21%) | 32 (26.23%) | 69 (56.56%) |
| Health | 46 (14.6%) | 22 (6.98%) | 247 (78.41%) |
| Biological | 64 (12.96%) | 7 (1.42%) | 423 (85.63%) |
| Humanities | 7 (2.36%) | 128 (43.1%) | 162 (54.55%) |
| Linguistics and Arts | 3 (3.95%) | 21 (27.63%) | 52 (68.42%) |
| Exact and Earth | 36 (7.0%) | 4 (0.78%) | 474 (92.22%) |
| Engineering | 91 (25.56%) | 11 (3.09%) | 254 (71.35%) |
| Relative proportion | 15.4% | 9.8% | 74.7% |
The Applied Sciences and Humanities areas have significant proportions of high-caliber researchers in “BP”, if we compare with the values in Table 5. This increase in the proportion of researchers in “BP” is due to the decrease of “AS”, for both areas. The most plausible explanation for this difference in proportions is due to the late consolidation of postgraduate programs in these two areas. Graduate programs in the more traditional areas of science, such as Exact Sciences, Health, Biological, and Engineering, began to be established in the ’30s, consolidated in the ’60s, and expanded since then. The Applied Sciences and Humanities areas began their structuring in the ’70s, consolidated in the ’90s and 2020s, and only from then did they start to expand (de Oliveira Moritz et al., 2013; Schwartzman, 2022). This late consolidation justifies the low proportion of researchers of “AS” in the two areas of late consolidation. The oldest researchers in this area were recognized by textbooks widely adopted in undergraduate and postgraduate courses. There weren’t enough programs to value graduate advising. The consolidation of programs is already reflected when looking at all elite researchers, not just the high-caliber ones. The existence of master’s and doctorate courses in these two areas is already leading to the recognition of this activity, mainly in Applied Sciences. It will be very interesting to follow the evolution of both areas over the coming years regarding the relative importance of each research output. We expect these areas to converge to a similar profile to the most traditional fields soon.
Table 7 presents the same results as Table 4 for the high-caliber researchers.⑤ Despite some differences, the results are quite similar, suggesting that elite and high-caliber researchers exhibit comparable characteristics when using measures of central tendency such as the mean and median. Nevertheless, some specific differences can be pointed out by analyzing both tables, which might even be expected to categorize a researcher as high-caliber.
Table 7. Descriptive statistics of super-elite researchers by clusters. |
| Variable | Mean | Median | Standard Deviation | ||||||
|---|---|---|---|---|---|---|---|---|---|
| AS | BP | G | AS | BP | G | AS | BP | G | |
| Years of PhD | 26.81 | 31.16 | 35.63 | 27.00 | 30.00 | 35.00 | 5.25 | 7.54 | 8.76 |
| Published books | 0.09 | 0.41 | 0.05 | 0.05 | 0.33 | 0.03 | 0.11 | 0.35 | 0.08 |
| Published book chapters | 0.68 | 2.40 | 0.39 | 0.50 | 2.06 | 0.24 | 0.62 | 1.52 | 0.44 |
| Edited books | 0.05 | 0.47 | 0.03 | 0.00 | 0.36 | 0.00 | 0.10 | 0.40 | 0.06 |
| Amount of citations | 58.06 | 11.51 | 38.88 | 22.00 | 0.41 | 12.65 | 204.58 | 31.46 | 115.91 |
| Mean of citations by publications | 21.13 | 7.04 | 25.06 | 15.02 | 3.00 | 16.71 | 43.71 | 11.15 | 53.28 |
| Minimum of citations by publications | 1.41 | 1.09 | 2.02 | 1.00 | 1.00 | 1.00 | 3.49 | 2.76 | 15.07 |
| Maximum of citations by publications | 87.03 | 45.18 | 135.51 | 37.50 | 3.00 | 47.00 | 261.76 | 296.54 | 438.83 |
| Number of scientific papers | 5.25 | 3.92 | 3.43 | 4.29 | 2.76 | 2.71 | 3.85 | 3.72 | 2.85 |
| Proportion of first author | 0.82 | 1.72 | 0.71 | 0.58 | 1.41 | 0.52 | 0.85 | 1.33 | 0.68 |
| Mean of authors by publication | 5.64 | 2.77 | 7.13 | 5.20 | 2.10 | 4.88 | 6.03 | 2.66 | 35.86 |
| Proportion articles in English | 2.88 | 0.98 | 2.35 | 2.14 | 0.20 | 1.79 | 2.99 | 2.26 | 2.46 |
| Proportion articles in Portuguese | 2.34 | 2.85 | 1.06 | 1.68 | 2.19 | 0.70 | 2.18 | 2.47 | 1.13 |
| Proportion articles in Spanish | 0.02 | 0.06 | 0.01 | 0.00 | 0.00 | 0.00 | 0.08 | 0.15 | 0.04 |
| Master’s dissertation supervisions | 1.53 | 1.17 | 0.65 | 1.40 | 1.04 | 0.61 | 0.70 | 0.63 | 0.39 |
| Doctoral thesis supervisions | 0.77 | 0.73 | 0.45 | 0.67 | 0.67 | 0.41 | 0.52 | 0.43 | 0.30 |
| Undergraduate thesis supervision | 1.48 | 0.82 | 0.26 | 1.20 | 0.52 | 0.12 | 1.28 | 1.05 | 0.34 |
| Scientific initiation supervision | 1.88 | 1.03 | 0.60 | 1.71 | 0.84 | 0.50 | 1.20 | 0.88 | 0.51 |
| Postdoctoral supervision | 0.14 | 0.17 | 0.11 | 0.08 | 0.11 | 0.05 | 0.19 | 0.21 | 0.17 |
The high-caliber researchers have a longer time since earning their PhDs, indicating that they have been active in academia for longer. Additionally, there is a significant increase in the number of citations across all clusters. This result suggests that these researchers are more likely to be cited by specializing in a specific field and building a strong reputation. Similarly, their journal articles tend to have higher average citation counts. These results show that the high-caliber class characterizes the current status quo in Brazilian research, considering their leadership and influence in the main research funding bodies, especially in the more traditional fields.
4 Conclusion and further research
The application of cluster analysis was crucial in uncovering hidden patterns in the data, enabling a deeper understanding of the differences between researcher profiles. Therefore, we propose that differentiated policies could be designed based on these profiles. For instance, researchers in the ASAP cluster may benefit from mentoring programs or incentives to expand international collaborations, while those in the BOF cluster could be supported through funding mechanisms that recognize book-oriented scientific production, especially in the humanities and social sciences. Likewise, researchers in the MUS cluster, who demonstrate strong engagement in teaching and early-career supervision, might benefit from initiatives that enhance integration between research and academic training. Future studies and institutional policies may build on this framework to develop more effective and equitable support mechanisms.
Future studies also could expand this methodological approach by including other researcher categories and considering qualitative metrics, such as social impact and innovation. Finally, exploring the longitudinal evolution of academic profiles, particularly in the context of changes in scientific policies, may offer deeper insights into Brazil’s academic elite dynamics.
Author contributions
Cristian Rogério Foguesatto (cristian.foguesatto@ufrgs.br): Conceptualization (Equal), Data curation (Equal), Formal analysis (Equal), Investigation (Equal), Methodology (Equal), Project administration (Equal), Software (Equal), Validation (Equal), Visualization (Equal), Writing - original draft (Equal), Writing - review & editing (Equal);
Denis Borenstein (denis.borenstein@ufrgs.br): Conceptualization (Equal), Investigation (Equal), Visualization (Equal), Writing - original draft (Equal), Writing - review & editing (Equal);
Marcelo Perlin (marcelo.perlin@ufrgs.br): Investigation (Equal), Visualization (Equal), Writing - original draft (Equal), Writing - review & editing (Equal);
Takeyoshi Imasato (t.imasato@ufrgs.br): Conceptualization (Equal), Validation (Equal), Writing - review & editing (Equal).