


1 Introduction
Some say that low journal self-citation rate (LJSCR) is suggestive the journal authors are not reading the journal in which they are publishing. Others argue that low journal self-citation rate is good, that citations from other journals is prestigious (Krauss, 2007). In this novel dialectical perspective, we find both arguments to be compatible. When authors do not read a journal in which they publish, low journal self-citation rate can still be prestigious. This thus makes low journal self-citation rate an odd bibliographic metric: it rewards low author readership. We devote this article to the physics of journal self-citation. By physics, we at least mean the properties and phenomena of journal self-citation. By journal self-citation rate, we mean the fraction of citations in a journal to articles in that same journal. Throughout this work, we define journal self-citation rate over the two-year impact factor window, namely (see Paragraph 2 of Column 2 of p. 7 of Garfield (1976)):
$f \equiv \frac{\mathrm{IF}^{-}}{\mathrm{IF}}$
where IF and IF - are the impact factors with (Eq. (1) of Li et al. (2024); see Paragraph 2 of Column 2 of p. 6 of Garfield (1976); Eq. (1) of Phan-Thien and Giacomin (2024); Eq. (III.5.1.) and Table III.5.2. of Egghe and Rousseau (1990); Eq. (2) of Frandsen and Rousseau (2005)) and without self-citation, as reported by the Web of Science (WOS) (Clarivate, 2024a, 2024b).
The subject of this paper, journal self-citation rate (also called journal self-cited rate) is not to be confused with journal self-citing rate. By journal self-citing rate, we mean the fraction of the journal citations from said journal (over some well-defined interval). By journal self-cited rate, we mean the fraction of the journal citations to said journal (over some well-defined interval). In other words, the difference between self-citing, and self-cited, is in the denominator of the fraction, and not in the numerator. Further, for the self-cited rate, the denominator is always larger than the denominator for the self-citing rate. This is why the self-cited rate is always larger than the self-citing rate. We are aware of alternative lexicography of the term self-cited (Fassoulaki et al., 2000). Throughout this work, journal self-citation rate means journal self-cited rate. Self-citing and self-cited are, unfortunately, also known as synchronous and diachronous, respectively (Tsay, 2006). By unfortunately, we at least mean both recherché and departing from plain meaning. Others assign still other meanings to synchronous and diachronous (Frandsen & Rousseau, 2005). Further, our work here is silent on if or how self-citation may or may not be indicative of prestige or self-author readership.
Journal self-citation rate is not to be confused with the unrelated (a) author self-citation rate, about which much has been written (Abramo et al., 2021; Aksnes, 2003; Davarpanah & Amel, 2009; Engqvist & Frommen, 2008; Fowler & Aksnes, 2007; Ioannidis, 2015; King et al., 2017; Kulkarni et al., 2011; Ma et al., 2021; Minasny et al., 2010; Mishra et al., 2018; Rousseau, 1999; Sanfilippo et al., 2021; Szomszor et al., 2020; Tagliacozzo, 1977; Trimble, 1986), (b) institutional self-citation rate (Hendrix, 2009). From this literature, we glean the canonical experimental observations of journal self-citation:
(i) for high impact factor journals, removing self-citation does not affect their rankings (Taşkın et al., 2021),
(ii) journal self-citation rates increase with number of publications, total citations, and with self-citations per publication (Quincho-Lopez, 2024),
(iv) the self-citation rate of an individual journal changes over time (Tighe et al., 2011),
(v) Chinese scientific journals have generally higher self-citation rates than otherwise (Yang et al., 2012),
(vi) high-impact journals self-cite to recent publications more than lower-impact ones (Gazni & Didegah, 2021),
(vii) articles citing to the same journal are cited more frequently (Gazni & Didegah, 2021),
(viii) excluding journal self-citation, publisher self-citation increases publisher citation (Zhou, 2021),
(x) rapid peer review decisioning increases journal self-cited rates (Tsay, 2006),
(xi) the total number of citations increases with the self-citing rate (Tsay, 2006),
(xii) journal self-cited rate does not increase the journal size (Tsay, 2006),
(xiv) mean self-cited rate is about 50% higher than mean self-citing (Tsay, 2006),
(xvi) rapid peer review decisioning increases journal self-citing (Tsay, 2006),
(xvii) the journal size increases with the self-citing rate (Tsay, 2006),
(xviii) a journal with a higher self-citing rate tends to be self-cited (Tsay, 2006),
(xx) journal self-citation increases with the proportion of Letter or Editorial article types (Jain et al., 2021)
(xxii) journal self-citation either decreases impact factor (Gazni & Didegah, 2021; Krauss, 2007; Livas & Delli, 2018) or hardly affects it (Bhandari et al., 2007; Heneberg, 2016; Huang & Lin, 2012; Kurmis & Kurmis, 2010; Reiter et al., 2016) or increases it (Fassoulaki et al., 2000; Frandsen, 2007; Ghane, 2010; Mavrogenis et al., 2010; Mehrad & Goltaji, 2010; Mimouni & Segal, 2014).
We call Romanettes (i) through (xxii) the canonical experimental observations on journal self-citation. On the effect of journal self-citation rate on journal impact, taken together, Romanettes (xxi) and (xxii) point in all directions. Romanettes (xxi) and (xxii) thus suggest that a relevant variable might have been overlooked. We devote this paper to seeing how journal market share affects journal self-citation.
By market share, ms, we mean the fraction of papers in the Web of Science (WOS) category to which the fluids journals under investigation belong (Clarivate, 2024a, 2024b). Since market share is a fraction, it must not be confused with cognate dimensional quantities such as total number of papers. Further, market share is not to be confused with journal share in related disciplines regarding citing articles (see first bullet of right column of page 9 of Section 3.6, and Figures 6(a)-(c) of Zhou (2022)), or the like. We test our analysis against the 61-journal year cluster of three competing hybrid fluids journals of the Web of Science Physics, Fluids & Plasmas category: Journal of Fluid Mechanics, Physical Review Fluids and Physics of Fluids (Clarivate, 2024a, 2024b), about which much has been written (Giacomin et al., 2025; Phan-Thien & Giacomin, 2024; Phan-Thien et al., 2024; Zatloukal et al., 2024a, 2024b). The uninitiated might expect that, as market share approaches unity, so might the fractional self-citation rate. In this work, we will see what the physics of journal self-citation has to say about this.
2 Method
We begin our analysis by deepening our understanding of the fluids journal market. From Figure 1, we learn that, since 1997 (the interval over which these WOS data are available), the fluids market has grown linearly, by about 291 papers per year. From Figure 2, we discover that, since 1997, the fluids market has grown by about three quarters of a journal per year. From Figure 3, we learn that the average journal size, since 1997, has grown from about 220 to 300 papers per journal. Otherwise put, average journal size has grown by only less than 3 papers per year. From Figure 1 through Figure 3, we learn that the fluids market grows mainly by journal proliferation, and only hardly by journal size. We next explore the quality of this market, focussing on the two-year impact factor windows. Figure 4 uncovers a more or less linear increase in the market arithmetic average impact factor, 〈IF〉. Though Figure 4 is sometimes misinterpreted pessimistically as impact inflation, it reflects objectively the increasing value of the fluids research enterprise. More recent metrics, having dimensions of constant currency, have been advanced for the value of published research. These include estimated article processing charge value, and estimated journal financial value (Halevi et al., 2024).
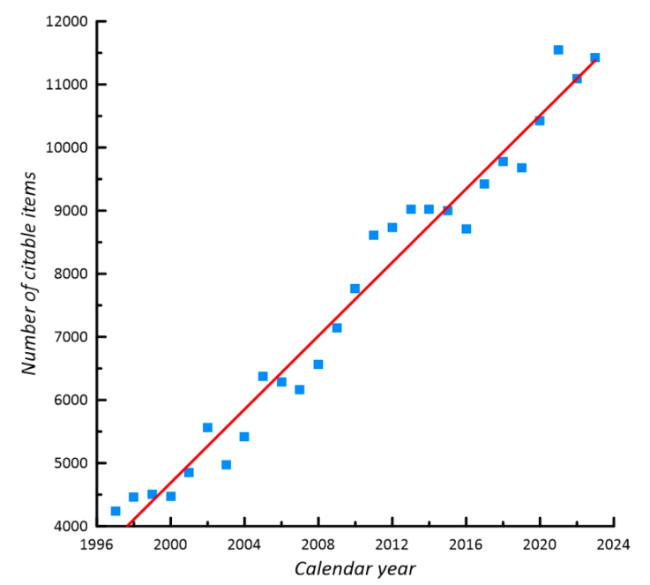
Figure 1. Citeable items in WOS Physics, Fluids & Plasmas category versus calendar year. Slope 291 citeable items per year (correlation coefficient R = 0.985). |
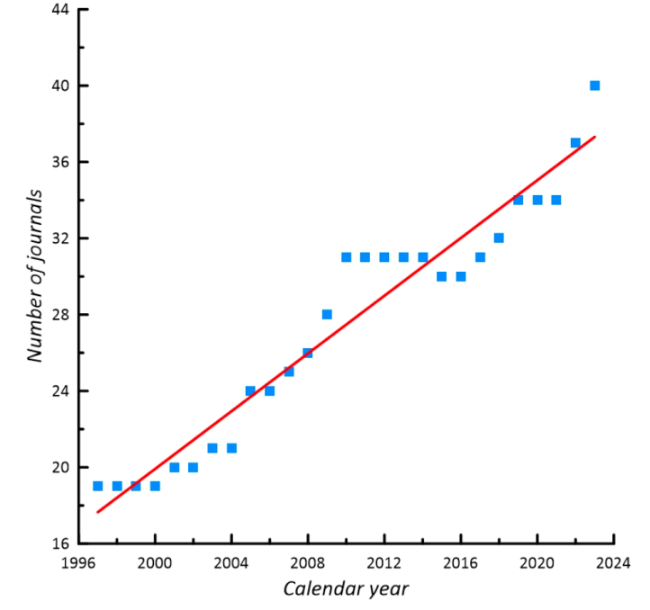
Figure 2. Number of journals in WOS Physics, Fluids & Plasmas category versus calendar year. Slope 0.756 journals per year (correlation coefficient R = 0.985). |
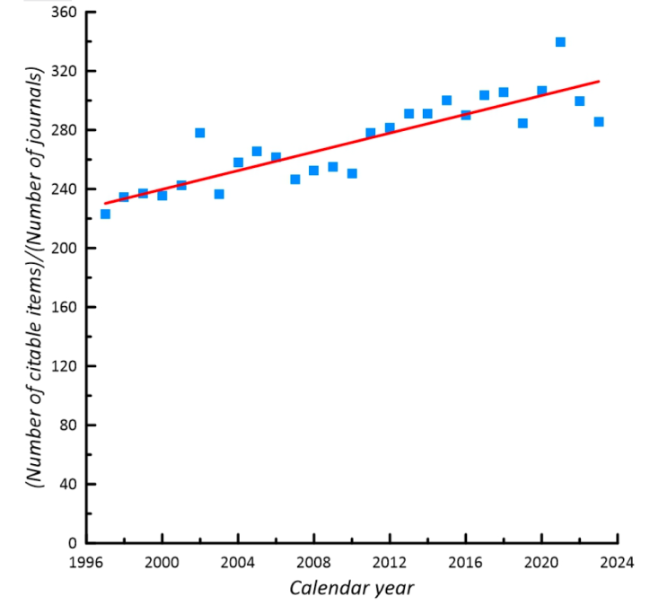
Figure 3. Size of journal in WOS Physics, Fluids & Plasmas category versus calendar year. Slope 3.2 citable items per journal per year (correlation coefficient R = 0.875). |
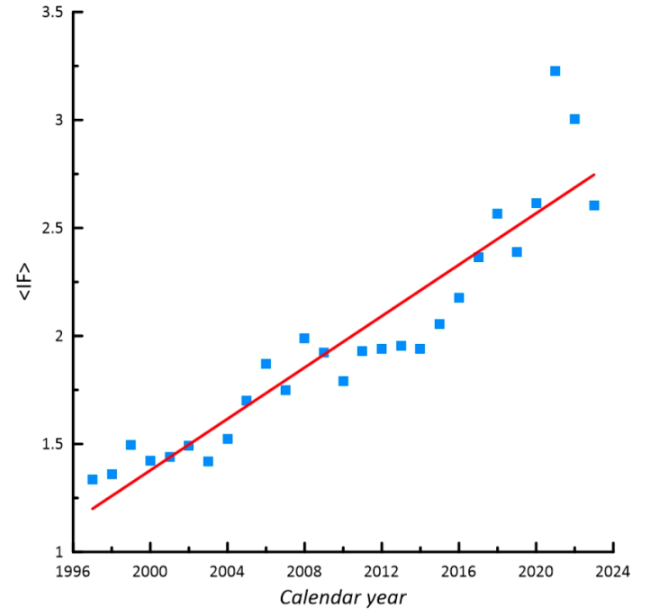
Figure 4. Arithmetic average impact factor, 〈IF〉, of all journals in WOS Physics, Fluids & Plasmas category versus calendar year. Slope is 0.0595 citations per citeable article per year (correlation coefficient R = 0.931). |
We continue our analysis by deepening our understanding of fractional market share, ms, for each of the three journals in the cluster, since 1997, the interval over which these WOS data are available. Figure 5 follows ms versus calendar year, from which we identify a growing market share growing disruptively after 2020 (solid blue squares). We find this disruption to be concomitant with one market share constancy (solid magenta squares), and another decline (solid green squares).
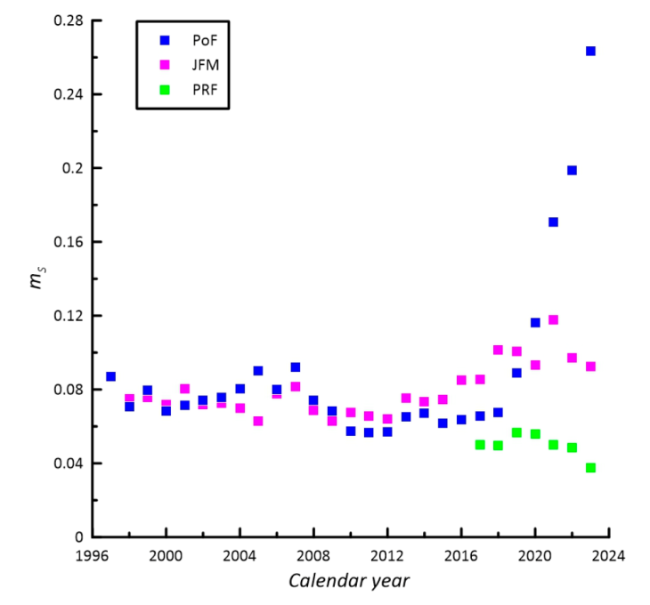
Figure 5. Market shares, ms, of Physics of Fluids (solid blue squares), Journal of Fluid Mechanics (solid magenta squares) and Physical Review Fluids (solid green squares) versus calendar year. |
3 Results
We next explore bibliographic metrics of the fluids journal cluster. Not unlike Figure 4, we focus on the two-year impact factor windows. Figure 6 and Figure 7 examine the impact factor trends for the 3-fluids journal cluster, with (IF) and without self-citation (IF -), respectively. From Figure 6 and Figure 7, we calculate Figure 8, the fractional self-citation rates, 1-f, for each member of the fluids journal cluster. Figure 8 uncovers a disruption in the self-citation rate after 2020 (solid blue squares). We find this disruption to be concomitant with one market share constancy (solid magenta squares), and one decline (solid green squares). These parallel the market share behavior uncovered by Figure 5, and thus motivate the crossplotting of fractional self-citation rate, 1-f, versus market share, ms, of Figure 9 (which crossplots Figure 8 versus Figure 5). From this crossplot, we learn that self-citation rate, for the fluids journal cluster, is mainly governed by market share. We also learn that (α) journal fractional self-citation rate approaches a maximum, 1-f1, (β) this maximum falls well below unity, and (γ) a positive abscissa intercept, m0, suggests itself. This abscissa intercept implies that a minimum market share must be achieved for a self-citation rate to be observed at all. This corrects the occasional assertion that journal self-citation rates are proportional to WOS category market share (see above Eq. (10) of Zhou (2022)).
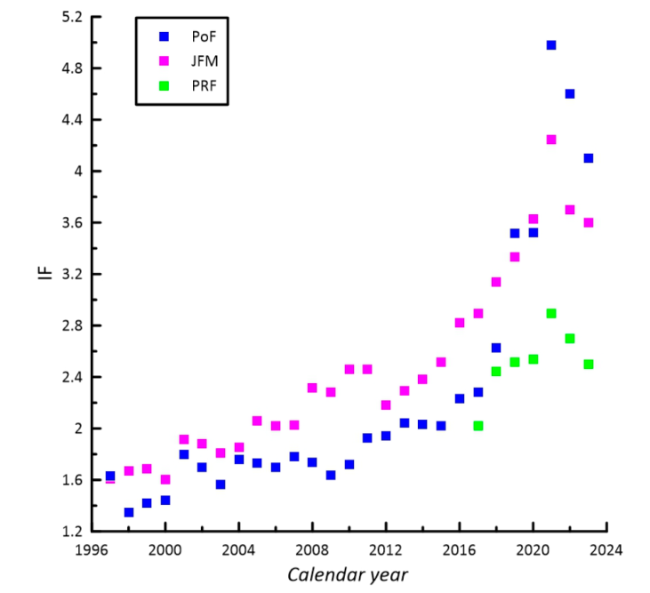
Figure 6. Impact factor with journal self-citation, IF, or Physics of Fluids (solid blue squares), Journal of Fluid Mechanics (solid magenta squares) and Physical Review Fluids (solid green squares) versus calendar year. |
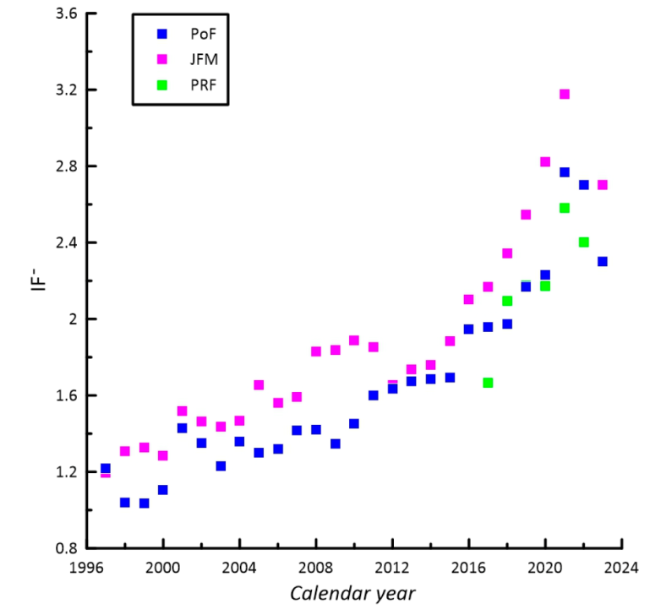
Figure 7. Impact factor without journal self-citation, IF -, for Physics of Fluids (solid blue squares), Journal of Fluid Mechanics (solid magenta squares) and Physical Review Fluids (solid green squares) versus calendar year. |
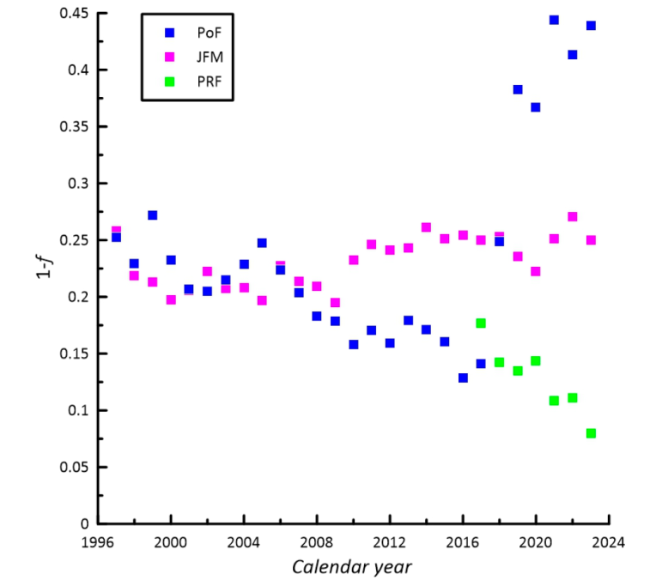
Figure 8. Journal self-citation rate, f, for Physics of Fluids (solid blue squares), Journal of Fluid Mechanics (solid magenta squares) and Physical Review Fluids (solid green squares) versus calendar year. |
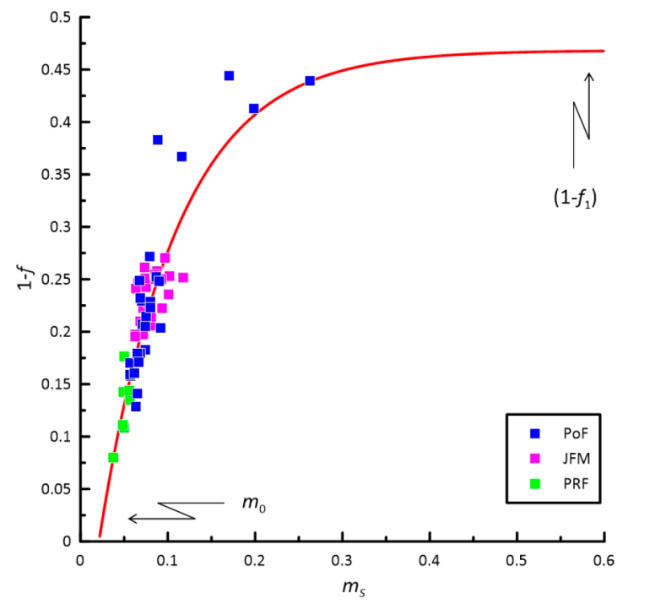
Figure 9. Crossplot of journal self-citation rate, 1-f, for Physics of Fluids (solid blue squares), Journal of Fluid Mechanics (solid magenta squares) and Physical Review Fluids (solid green squares) versus their market shares, ms. Crossplot of Figure 8 versus Figure 5. Solid curve is Eq. (6) [with fitted values of Eq. (8)]. |
We can imagine that the kinetics of journal self-citation, and of fluids market share obey the following kinetic rate expressions:
$\left\{\begin{array}{c} \frac{d}{d t}\left(\frac{1-f}{1-f_{1}}\right)=\left\{\kappa_{2}\right\}-\left[\kappa_{1}\left(\frac{1-f}{1-f_{1}}-1\right) e^{\frac{\kappa_{1}}{\kappa_{3}} m_{s}}\right] \\ \frac{d m_{s}}{d t}=\left\{\kappa_{3} e^{\frac{\kappa_{1}}{\kappa_{3}} m_{s}}\right\} \end{array}\right.$
The first of these pegs journal self-citation kinetics to a constant birth rate, {k2}, and to its death rate being both linear in journal self-citation, and exponential in market share. The second of these pegs market share to kinetics exponential in market share (and thus logarithmic in time). Dividing the second into the first of these gives the constitutive equation for journal self-citation:
$\frac{d}{d m_{s}}\left(\frac{1-f}{1-f_{1}}\right)=\frac{\kappa_{2}}{\kappa_{3}} e^{-\frac{\kappa_{1}}{\kappa_{3}} m_{s}}-\left[\frac{\kappa_{1}}{\kappa_{3}}\left(\frac{1-f}{1-f_{1}}-1\right)\right]$
which we rewrite as:
$\frac{d}{d m_{s}}\left(\frac{1-f}{1-f_{1}}\right)=\left\{\frac{e^{\frac{m_{0}}{m_{c}}}}{1-m_{0}}\right\} e^{-\frac{m_{s}}{m_{c}}}-\left[\frac{1}{m_{c}}\left(\frac{1-f}{1-f_{1}}-1\right)\right]$
from which we learn that the term in {braces} in Eq. (4) is where and how self-citations are created, and the term in [brackets], where they are destroyed. From Eq. (4), we learn that journal self-citation rate seems to be following a first order nonhomogeneous differential equation with constant coefficients (with special right side).
Solving Eq. (4) can deepen our understanding of how m0 and mc each intervene in journal self-citation dynamics. Subjecting Eq. (4) to the final condition:
$m_{s}=1 ;\left(\frac{1-f}{1-f_{1}}\right)=1$
$\frac{1-f}{1-f_{1}}=1-\frac{1-m_{s}}{1-m_{0}} \exp \left(-\frac{m_{s}-m_{0}}{m_{c}}\right)=1-\frac{1-m_{s}}{1-m_{0}} \sum_{k=0}^{\infty} \frac{1}{k!}\left(\frac{m_{0}-m_{s}}{m_{c}}\right)^{k}$
whose series form we cannot revert. The market share exceeding the abscissa intercept, (ms-m0), arises naturally nondimensionalized by the characteristic market share, mc. From Eq. (6), we also glean:
$m_{s}=m_{0} ;\left(\frac{1-f}{1-f_{1}}\right)=0$
which assigns meaning to m0. Eq. (6) satisfies Hellenettes (α) through (γ) parsimoniously. Each truncation of the series in Eqs. (6) after k produces an approximation to the dimensionless journal self-citation rate as a function of fractional market share that is accurate to order k+1.
We next fit Eq. (6) to the 61 journal-year three fluids journal cluster data of Figure 9, to get:
$\left\{\begin{array}{c} m_{0} \cong 0.0211 \\ m_{c} \cong 0.0975 \\ \left(1-f_{1}\right) \cong 0.468 \end{array}\right.$
Eqs. (6) and (8) [with Figure 9] are the main results of this work. Figure 9 shows good agreement between the physics of journal self-citation, and the experimental observations. The findings of Eqs. (6) and (8) [with Figure 9] correct the assertion that journal self-citation rates are proportional to WOS category market share (see above Eq. (10) of Zhou (2022)). The relation is nonlinear, does not contain the origin, and reaches a maximum value that falls well below unity.
From Eq. (8), we glean the curious empiricism:
$m_{c} \cong 5 m_{0}$
which we will use in Section 5 below.
Eq. (6) expands about ms = m0 [where (1-f ) = 0] as:
$\frac{1-f}{1-f_{1}}=\left[\frac{1}{1-m_{0}}+\frac{1}{m_{c}}\right]\left(m_{s}-m_{0}\right)+\frac{1-m_{0}+2 m_{c}}{2\left(m_{0}-1\right) m_{c}^{2}}\left(m_{s}-m_{0}\right)^{2}+\cdots$
whose frontmost [bracketed] factor is the initial slope of the self-citation rate (the high positive slope at the abscissa), and Eq. (6) expands about ms = 1 as:
$\frac{1-f}{1-f_{1}}=1+\left[\frac{\exp \left(\frac{m_{0}-1}{m_{c}}\right)}{1-m_{0}}\right]\left(m_{s}-1\right)+\frac{\exp \left(\frac{m_{0}-1}{m_{c}}\right)}{m_{c}\left(m_{0}-1\right)}\left(m_{s}-m_{0}\right)^{2}+\cdots$
whose frontmost [bracketed] factor is the final slope of the self-citation rate (the slightly positive slope at ms = 1). Using Eqs. (8) we thus get the dimensionless slopes:
$\left.\frac{d}{m_{s}}\left(\frac{1-f}{1-f_{1}}\right)\right|_{m_{s}=0}=\left[\frac{1}{1-m_{0}}+\frac{1}{m_{c}}\right]=11.278$
$\left.\frac{d}{m_{s}}\left(\frac{1-f}{1-f_{1}}\right)\right|_{m_{s}=1}=\left[\frac{\exp \left(\frac{m_{0}-1}{m_{c}}\right)}{1-m_{0}}\right]=4.456 \times 10^{-5}$
for the three fluids journal cluster.
Only one fluids journal has ever penetrated the market beyond 12%. From the curve of Figure 9, we learn that for a characteristic market share of mc ≅ 0.0975, market penetration of 20% produces fractional self-citation of 0.41, namely, already close to maximum fractional self-citation of (1-f1) ≅ 0.468. We speculate that (1-f1)≪1 because more than half of the citationing is coming from outside the fluids market, namely, from outside the Physics, Fluids & Plasmas WOS journal category. We leave the exploration of this speculation for another day.
Whereas the [bracketed] destruction of self-citations is linear in the self-citation rate, $\left(\frac{1-f}{1-f_{1}}\right)$,the {braced} creation of self-citations increases linearly with $e^{-m}$. From Eq. (4), we also learn that the [bracketed] destruction is moderated by the kinetic rate constant, $\frac{1}{m_{c}}$. This assigns physical meaning to mc. Regarding the {braces}, only m0 contributes to the creation of journal self-citations. This creation accelerates with $\frac{1}{1-m_{0}}$. This assigns additional physical meaning to m0, beyond the boundary value.
Curiously, from Eq. (9), we learn that for the fluids journal cluster, the kinetic rate constant for destruction, $\frac{1}{m_{c}}$, is roughly the reciprocal of the quintuple of the abscissa intercept, $\frac{1}{5 m_{0}}$. We have used a dynamics framework, Eq. (4) [with Eq. (5)], to deepen our understanding of the physics of journal self-citation. However, of the equivalent forms of Eq. (4), namely:
$\left\{\begin{array}{c} \frac{d y}{d x}+\beta[y-1]=\left\{\alpha e^{-x}\right\} \\ \begin{array}{c} (D+\beta) y=\left\{\alpha e^{-x}\right\} \\ (D+\beta) y=\left\{\alpha e^{x}\right\} \end{array} \end{array}\right.$
special cases sometimes appear as exercises for the reader in textbook treatments of applied mathematics (compare with Section 17.14. of Rektorys (1995) or Rektorys (1969); Section IV.3 of Chapter 4 of Spiegel (1967); EXERCISES 3. and 6. of § 46. of Chapter 6 of Kells (1954); Problem 6. of Section 1.7 of Kreyszig (1968); PROBLEM 13. of Chapter 6 of Pipes (1958); Problems 6. (a) or 7. (b) of Section 11.4 of McQuarrie (2003); PROBLEMS 5. and 22. of Chapter 2. of Boyce and DiPrima (2009)).
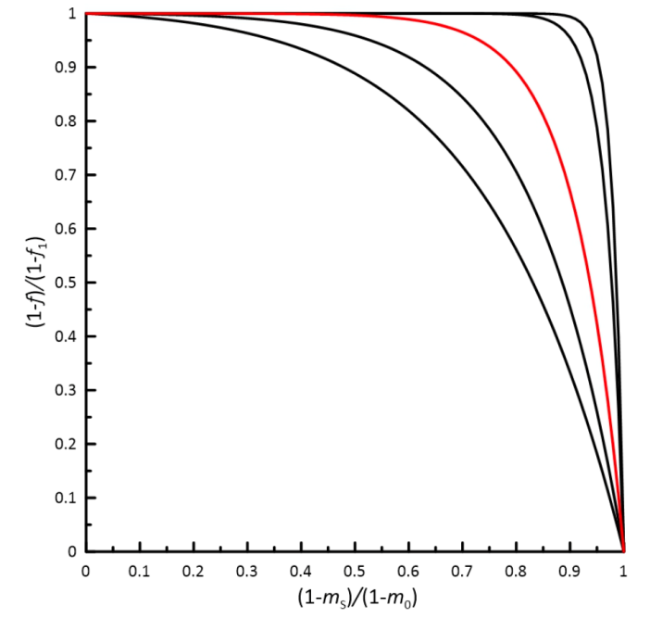
We can rewrite our main result, Eq. (4), in terms of just one dimensionless parameter, $\frac{1-m_{0}}{m_{c}}$, as:
$\frac{1-f}{1-f_{1}}=1-\frac{1-m_{s}}{1-m_{0}}\left[\exp \left(\frac{1-m_{s}}{1-m_{0}}-1\right)\right]^{\frac{1-m_{0}}{m_{c}}}$
in which $\frac{1-m_{s}}{1-m_{0}}$ emerges as the dimensionless fractional market remainder, and in which $\frac{1-m_{0}}{m_{c}}$ is the fractional threshold self-citation market remainder made dimensionless with the characteristic market share, mc. By market remainder, we mean the fraction of the market that is unshared. Figure 10 illustrates Eq. (15). From this we learn that low self-citation rate can be achieved by decreasing market share. Since the slope:
$\frac{d\left(\frac{1-f}{1-f_{1}}\right)}{d\left(\frac{1-m_{s}}{1-m_{0}}\right)}<0$
Figure 10. Dimensionless normalized journal self-citation rate, $\frac{1-f}{1-f_{1}}$, from Eq. (15) versus dimensionless normalized market remainder, $\frac{1-m_{s}}{1-m_{0}}$, parametrized with, $\frac{1-m_{0}}{m_{c}}$, the zero journal self-citation market remainder made dimensionless with the characteristic market share, mc. The 61 journal year three fluids journal cluster studied here corresponds almost exactly to the $\frac{1-m_{0}}{m_{c}}=10$ isopleth (solid red curve). |
we learn that the pursuit of low journal self-citation rate, as a quality metric, inclines the journal against its own market share. Otherwise put, an industry that inclines itself toward products with low journal self-citation rate, inclines itself against its own competitiveness and inclines itself against market share disruptions such as the one identified in Figure 9. Other journal metrics with anticompetitive properties include the impact factor (Giacomin et al., 2025; Phan-Thien & Giacomin, 2024; Zatloukal et al., 2024a) and the CiteScore (Giacomin et al., 2025; Phan-Thien et al., 2024; Zatloukal et al., 2024b).
4 Exact sequential chemical reaction analogy
Consider the irreversible homogeneous isothermal sequential unimolecular conversions of one molecule, A, into another intermediate molecule, B, and then into a third, C, with stoichiometry (Eqs. (2-109) through (2-118) of Carberry (1976)):
$\mathrm{A} \xrightarrow{k_{1}} \mathrm{~B} \xrightarrow{k_{2}} \mathrm{C}$
in which both reactions follow first order kinetics (Example 1.14-2. of Chan Man Fong et al. (2003)). If we begin, as one does, with just A, in a constant volume batch reactor, then we begin with initial concentrations cA = cA0, and cB0 = cC0 = 0. Following Section 1.14 of Chan Man Fong et al. (2003), using the initial condition:
$k_{1} t=0 ; \frac{c_{\mathrm{B}}}{c_{\mathrm{A} 0}}=0$
we get the following dimensional kinetic rate expression for the evolution of the concentration of middle compound in our chemical balance, Eq. (17) (Eq. (1.14-18) of Chan Man Fong et al. (2003); Eq. (45) of Chapter 3 of Levenspiel (1972); Eq. (E6-4.7) of Fogler (2006); Eq. (2-52) of Illustration 2-6 of Section 17. of Chapter 2 of Walas (1959); Eq. (2-110) of Carberry (1976)):
$\frac{d c_{\mathrm{B}}}{d t}+k_{2} c_{\mathrm{B}}=\left\{k_{1} c_{\mathrm{A} 0} e^{-k_{1} t}\right\}$
which matches the equivalent forms in Eq. (14) with dimensionless correspondences for the variables:
$\left\{\begin{array}{c} x \equiv k_{1} t \\ \boldsymbol{y} \equiv \frac{c_{\mathrm{B}}}{c_{\mathrm{A} 0}} \\ y \equiv \boldsymbol{y}+1 \end{array}\right.$
and for the constants:
$\left\{\begin{array}{l} \beta \equiv \frac{k_{2}}{k_{1}} \\ \alpha \equiv \frac{1}{c_{\mathrm{A} 0}} \end{array}\right.$
from which we discover the mathematical correspondences between the physics of journal self-citation and the physics of the sequential chemical conversions of Eq. (14)(a):
$\left\{\begin{array}{c} \frac{m_{s}}{m_{c}} \sim k_{1} t=x \\ \left(\frac{1-f}{1-f_{1}}\right) \sim \frac{c_{\mathrm{B}}}{c_{\mathrm{A} 0}}+1=y \end{array}\right.$
and for the constants:
$\left\{\begin{array}{c} 1 \sim \frac{k_{2}}{k_{1}}=\beta \\ \frac{m_{c} e^{\frac{m_{0}}{m_{c}}}}{1-m_{0}} \sim \frac{1}{c_{\mathrm{A} 0}}=\alpha \end{array}\right. $
We find that the mathematical physics of Eq. (19) match the physics of Eq. (14) (and thus of Eqs. (3) and (4). However, these physics are subject to very different boundary conditions. Whereas the sequential unimolecular kinetics problem is solved as an initial value problem, with cA = cA0, and cB0 = cC0 = 0, the journal self-citation problem is solved with the shooting boundary value, $\left(\frac{1-f}{1-f_{1}}\right)=1$ at ms = 1. Also, the ranges for market share and reaction time differ, as:
$\left\{\begin{array}{c} 0 \leq m_{0} \leq m_{s} \leq 1 \\ 0 \leq k_{1} t<+\infty \end{array}\right.$
Nonetheless, the sequential batch reaction analogy teaches us that journal self-citations behave as the molecular intermediates, B, caught between sequential reactions, born of the left reaction, and spent by the right. Practical examples following the stoichiometries of Eqs. (17) would at least include catalyzed sequential isomerizations such as the ones performed by the liver (Chaudhry & Varacallo, 2025; Fernie et al., 2001; Van Schaftingen et al., 1980).
5 Worked example 1: Estimating (1-f1)
A publishing house has a popular and successful growing fluids journal in its care, whose market penetration is projected to exceed 12%. Over time, the fluids journal self-citation rate has crept upward, and the failing competition is disrupting the marketplace by drawing author attention to this. The publishing house engages a publishing engineer to arrive at a reasonable expectation for maximum journal self-citation rate.
From her low-penetration data (from the early years of her journal), the publishing engineer easily arrives at m0 ≅ 0.010. She next approximates mc using Eq. (8) by quintupling m0 [following Eq. (9)]:
$\frac{1-f}{1-f_{1}} \cong 1-\frac{1-m_{s}}{1-m_{0}} \exp \frac{1}{5}\left(1-\frac{m_{s}}{m_{0}}\right)$
Solving for the self-citation maximum:
$1-f_{1} \cong \frac{1-f}{1-\frac{1-m_{s}}{1-m_{0}} \exp \frac{1}{5}\left(1-\frac{m_{s}}{m_{0}}\right)}$
and then inserting the latest available ordered pair for her journal, (1-f, ms) ≅ (0.18,0.06), yields her extrapolated upper bound (1-f1) ≅ 0.2766. The engineer thus reports, to within publishing engineering certainty, an upper bound to her journal self-citation rate of about 28%.
6 Worked example 2: Estimating ms
A popular upstart fluids journal was founded in 2008, and reached ml ≅ 0.040 in 2014. Its first significant journal self-citation rate was observed in 2011 at its threshold market share of m0 ≅ 0.0195. The publishing house is developing a plan for its journal proliferation. Of their new popular upstart fluids journal, they want to keep its self-citation rate below (1-f ) ≅ 0.20. At which market penetration should they bring to market their next spin-off subdisciplinary fluids journal? About this, they consult their publishing engineer.
The publishing engineer first adopts the empiricism for fluids journals of Eq. (8). She then nondimensionalizes the journal self-citation rate:
$Y \equiv \frac{1-f}{1-f_{1}} \cong \frac{0.20}{0.468}=0.428$
and next, calculates the exponent of Eq. (15) (see red curve in Figure 10):
$z \equiv \frac{1-m_{0}}{m_{c}} \cong \frac{1-0.0211}{0.0975}=0.427=10.04$
and she next constructs the transcendental function for the fractional error of the numerical solution:
$\epsilon=\frac{1-\frac{1-m_{s}}{1-m_{0}}\left[\exp \left(\frac{1-m_{s}}{1-m_{0}}-1\right)\right]^{z}-Y}{Y}$
which, solved by trial, gives $\left(\frac{1-m_{s}}{1-m_{0}}, \epsilon\right) \cong(0.9495,0.0001)$, so that [using Eq. (8)(a)]
we get the market share below which the new subdisciplinary journal should be spun off, ms = 0.0705.
The publishing engineer then wonders when to advise the new journal launch. Solving Eq. (2)(b) yields the market share as a function of time:
$m_{s}=-\frac{\kappa_{3}}{\kappa_{1}} \log \left(1-\frac{\kappa_{3}^{2}}{\kappa_{1}}\left(t-t_{F}\right)\right)$
where tF is the foundation year and in which the logarithm is Napierian, so that:
$\left(t-t_{F}\right)=\frac{\kappa_{1}}{\kappa_{3}^{2}}\left(1-\exp \left(-\frac{\kappa_{1}}{\kappa_{3}} m_{s}\right)\right)=\frac{1}{\kappa_{3}} \frac{\kappa_{1}}{\kappa_{3}}\left(1-\exp \left(-\frac{\kappa_{1}}{\kappa_{3}} m_{s}\right)\right)$
into which she inserts the threshold condition:
$\left(t_{0}-t_{F}\right)=\frac{\kappa_{1}}{\kappa_{3}^{2}}\left(1-\exp \left(-\frac{\kappa_{1}}{\kappa_{3}} m_{0}\right)\right)$
and the latest contemporaneous value of the market share:
$\left(t_{\ell}-t_{F}\right)=\frac{\kappa_{1}}{\kappa_{3}^{2}}\left(1-\exp \left(-\frac{\kappa_{1}}{\kappa_{3}} m_{\ell}\right)\right)$
Dividing Eq. (33) by Eq. (32):
$\frac{t_{\ell}-t_{F}}{t_{0}-t_{F}}=\frac{1-\exp \left(-\frac{\kappa_{1}}{\kappa_{3}} m_{\ell}\right)}{1-\exp \left(-\frac{\kappa_{1}}{\kappa_{3}} m_{0}\right)}$
from which she next constructs the transcendental function for the fractional error of the numerical solution:
$\epsilon=\frac{\frac{1-\exp \left(-\frac{\kappa_{1}}{\kappa_{3}} m_{\ell}\right)}{1-\exp \left(-\frac{\kappa_{1}}{\kappa_{3}} m_{0}\right)}-\frac{t_{\ell}-t_{F}}{t_{0}-t_{F}}}{\frac{t_{\ell}-t_{F}}{t_{0}-t_{F}}}$
in which ml ≅ 0.040 and m0 ≅ 0.0195 are given, and:
$\frac{t_{\ell}-t_{F}}{t_{0}-t_{F}}=\frac{2014-2008}{2011-2008}=2$
She begins her solution to Eq. (35) by trial with the initial guess from the approximation:
$\frac{\kappa_{1}}{\kappa_{3}} \cong \frac{2}{m_{0}-m_{\ell}}\left(\frac{t_{\ell}-t_{F}}{t_{0}-t_{F}} \frac{m_{0}}{m_{\ell}}-1\right) \cong 2.43$
to get $\left(\frac{\kappa_{1}}{\kappa_{3}}, \epsilon\right)=(2.4957,0.0001)$. Solving Eq. (33) to get κ3:
$\kappa_{3}=\frac{1}{\left(t_{\ell}-t_{F}\right)} \frac{\kappa_{1}}{\kappa_{3}}\left(1-\exp \left(-\frac{\kappa_{1}}{\kappa_{3}} m_{\ell}\right)\right) \cong \frac{1}{6}(2.4957)(1-\exp (-(2.4957) 0.040))$
gives κ3 = 0.0395 year-1.
Finally, she inserts the upper bound for the launch market share, ms = 0.0705, into Eq. (31):
$t=2008+\frac{1}{0.0395}(2.4957)(1-\exp (-(2.4957) 0.0705))=2018.19$
from which she learns that to keep the self-citation rate below 20% (holding all else constant), the proliferation by subdisciplinary spin-off (sometimes called twigging) should launch not later than the start of calendar year 2018.
7 Conclusion
The novelty in this work lies in its exploration of market share as a cause of self-citation in the fluids journal market. We specifically explore the 61 journal-year three fluids journal cluster of the Web of Science Physics, Fluids & Plasmas category: Journal of Fluid Mechanics, Physical Review Fluids and Physics of Fluids (Clarivate, 2024a, 2024b). We find that journal self-citation rate (1) increases with the journal market share, (2) approaches its upper bound asymptotically, (3) said upper bound is well below unity, and (4) without a minimum market share, journal self-citation rate hardly exists. Our work here is silent on, and not to be confused with, the cognate subject of author self-citation.
Our physics of self-citations resolves the quandary of the canonical experimental observation of Romanette (xxii), and it does so by introducing the missing variable, market share. Our physics resolves this without introducing inconsistencies with the other canonical experimental observations of journal self-citation [Romanettes (i) through (xv)]. Our physics of journal self-citation is built on two kinetic rate expressions [Eqs. (2)], one for the self-citations, and another for their cause, market share. We consider these expressions to be parsimonious, and thus likewise for our main results (Eqs. (6) and (8) [with Figure 9]). These main results explain our new observations of journal self-citation rate versus market share.
Our work dispels the myth that unit fractional market share will lead to unit self-citation. Instead, our physical model arrives at an upper bound for self-citation that is (a) well below half, and (b) that this is approached when fractional market share exceeds just about 1/4 (see Figure 9).
We find that the kinetics of journal self-citation are mathematically and physically analogous to the concentration of a molecular intermediate born and then consumed between two irreversible unimolecular chemical reactions (following specifically the stoichiometry of Eq. (17) of Section 4). We uncover exact correspondences (i) between market share and reaction time [Eq. (22)(a)], (ii) between journal self-citation and chemical intermediate concentration [Eq. (22)(b)], (iii) between self-citation threshold and reaction rate constants [Eq. (23)(a)], and between self-citation threshold and initial concentration of the principal reagent [Eq. (23)(b)].
For this work, we defined the fluids journal market as the number of papers in the Web of Science (WOS) category to which the fluids journals belong (Clarivate, 2024a, 2024b). We are, of course, aware that there is plenty of fluids content falling outside this category, and that even contents within the category are subject to misclassification (Liao et al., 2025; Shen et al., 2024). Despite all this, we know of no higher, publicly available, standard definition of the fluids journal market. Our work here is silent on the subject of whether or not citation rates, self or not, are of any use at all in journal ranking or for bibliographical metrication (Giacomin, 2007; Seglen, 1998).
We close penultimately with a note on market share disruption. By taking sequentially, the canonical experimental observations of Romanettes (xvi), (xvii) and (xviii) [mindful of Romanette (xii)], we learn that a journal market share may grow with the speed of its editorial decision making. By extension, when one journal decides much faster than another (holding all else constant), increased and accelerated market share may result. This may explain the disruption uncovered by Figure 9 (mindful of Figure 8). We leave this intriguing exploration of the effect of editorial decision speed on journal market share for another day.
We close by observing that the history of information science provides us with just one market penetration deep enough to test our theory, Eq. (6). Our analysis thus relies on one and only one such journal market penetration: Physics of Fluids. We know of no other Web of Science category penetrated as disruptively as the Physics of Fluids penetration of its category (see Figure 9).
Author contributions
Alan Jeffrey Giacomin (Email: giacomin@unr.edu): Conceptualization (Equal), Project administration (Equal), Writing - original draft (Equal), Writing - review & editing (Equal).
Martin Zatloukal (Email: mzatloukal@utb.cz; ORCID: 0000-0003-1894-2103): Methodology (Equal), Software (Equal), Validation (Equal), Visualization (Equal).
Mona Kanso (Email: kansom@mit.edu; ORCID: 0000-0002-5632-9302): Investigation (Equal), Writing - original draft (Equal), Writing - review & editing (Equal).
Nhan Phan-Thien (Email: nhan@nus.edu.sg; ORCID: 0000-0003-3716-7907): Formal analysis (Equal), Investigation (Equal), Validation (Equal).