


1 Introduction
The proliferation of Multi-Regional Input-Output (MRIO) databases has substantially enriched the analytical toolkit for studying Global Value Chains (GVCs), enabling the mapping of cross-border flows of goods and services and revealing structural interdependencies among economies. These frameworks provide essential data infrastructure for understanding industrial fragmentation, regional interlinkages, and the environmental consequences of globalization.
Despite these advances, conventional MRIO models exhibit a fundamental limitation: they adhere to the territorial principle and therefore cannot distinguish between DFEs and multinational enterprises (MNEs). This impedes the analysis of firm heterogeneity within production networks, particularly in large economies such as China. Moreover, existing ownership-extended MRIO tables (e.g., OECD-AMNE) lack sufficient spatial granularity to capture subnational differences in industrial specialization and regional restructuring.
Existing methods for analyzing firm heterogeneity each have clear limitations. MRIO models offer broad system coverage but ignore ownership differences. Micro-level firm data provide detailed insights but are often fragmented. Computable General Equilibrium (CGE) models are useful for policy simulation but depend on fixed assumptions, making them less effective in capturing dynamic structural changes. None of these approaches fully account for the combined effects of firm type, region, and sector.
To address these challenges, we develop a dual-extended MRIO model, termed Regionally-Ownership Dually-Extended Multi-Regional Input-Output (RODE-MRIO), which integrates macro-level input-output tables with micro-level ownership data. This framework embeds 31 Chinese provinces into the global MRIO system and disaggregates each industrial sector by domestic-invested (DIS) and foreign-invested sector (FIS). It thereby enables a nuanced analysis of how ownership structure shapes interregional production linkages and value chain dynamics.
Building on the RODE-MRIO model, we develop the Global Domestic and Foreign Enterprises Network (GDFEN) model and extract the Global Domestic and Foreign Enterprises Backbone Network (GDFEBN), which highlights the core trade flows shaping value distribution. From this network, a set of indicators is developed to analyze the structural differences between domestic and foreign enterprises. This framework provides a new tool for tracing industrial relocation patterns and offers data-driven insights for understanding regional disparities and guiding policy on foreign investment and industrial upgrading.
2 Data support for GVC accounting
Within a regional economic system, industrial sectors and the value flows, material flows, and information flows between them form relatively independent production networks. These production networks are linked through inter-regional and international supply chains, forming a complex system known as the Global Production Network (GPN). The GPN reflects the global division of labor under the GVC framework. It integrates concepts of space, network structure, and embeddedness to explain recent changes in global production organization. Today, GPN has become a key analytical framework for studying globalization and regional development.
2.1 Inter-Country Input-Output data
Recent advances in GVC research have progressively transitioned from conceptual mapping to empirical decomposition. Scholars first addressed data scarcity through proxies distinguishing intermediate from final goods (Hummels et al., 2001), followed by the development of global participation and positioning metrics to trace vertical specialization across economies (Koopman et al., 2010). Responding to the limitations of these aggregated approaches, further refinements introduced sector-level decomposition frameworks, capturing nuanced bilateral trade linkages and value-added flows (Wang et al., 2015). Building on this trajectory, newer frameworks began to incorporate firm-level heterogeneity and ownership structures into GVC accounting, bringing MNE-local linkages to the fore (Zhu et al., 2022). Complementing this, some researchers explored income formation through the lens of domestic, trade, and investment chains, revealing temporal shifts in national value accrual patterns (Duan & Cai, 2022).
The Inter-Country Input-Output (ICIO) table is the most comprehensive data structure for studying the distribution and production efficiency of the global economic system. It explains which consumers use the various resources put into the production system and how much they consume. The data structure of the ICIO table is presented in Appendix A.
Building on the structural foundation of the ICIO table, many scholars have modeled global production networks to decode industrial interdependencies, identify systemic vulnerabilities, and assess sectoral centrality under various economic shocks (Ando, 2014; Amador & Cabral, 2017; Araújo & Faustino, 2017; Cerina et al., 2015; Grazzini & Spelta, 2022; Soyyiğit & Eren, 2016; Soyyiğit & Yavuzaslan, 2018). Others introduced complex network metrics, such as PageRank, HITS, and modularity, to quantify industrial influence and resilience across countries and sectors (Xiao et al., 2017; Xing, 2022; Xing, Dong, & Guan, 2017; Xing et al., 2019; Xing, Guan, Dong, & Wu, 2018; Xing, Guan, & Wu, 2018; Xing et al., 2024; Xing, Xu, Guan, & Dong, 2017), thereby bridging economic topology with value-added dynamics in the GVC landscape.
The GVC accounting system established by mainstream economists using the world ICIO table is very mature (Hummels et al., 2001; Koopman et al., 2010; Mi et al., 2018; Timmer et al., 2012; Wang et al., 2017; Yang et al., 2020). However, most related studies rely on reductionist approaches, focusing only on trade structures and trends. Traditional ICIO models also follow the territorial principle, treating all domestic activity as uniform. This overlooks ownership differences and masks the structural roles of MNEs and FFEs in host economies.
2.2 Multi-region Input-Output data based on ownership expansion
Industrial transfer can be understood on two levels. At the micro level, it involves the relocation of individual firms; at the macro level, it reflects broader spatial restructuring processes driven by changes in comparative advantage or geopolitical shifts. In China, FFEs dominate processing trade, and their offshoring has sparked national security concerns. Scholars have examined industrial transfer and GVC restructuring from both macro and micro perspectives (Ge et al., 2021; Xu & Li, 2012; Zhang & Liu, 2009).
Despite advances in MRIO-based accounting (Liu et al., 2011; Gao et al., 2018), traditional input-output models fail to distinguish ownership, limiting their ability to analyze FFEs’ role. The OECD-AMNE database provides a breakthrough by reallocating value-added through bilateral firm-level mappings, forming the basis for the Ownership-Extended MRIO (OE-MRIO) structure (Andrenelli et al., 2018; Cadestin et al., 2018). Recent studies have applied OE-MRIO to capture firm heterogeneity in GVCs (Duan & Cai, 2022; Jiang et al., 2024; Zhu et al., 2022). The data structure of the Ownership-Extended ICIO (OE-ICIO) table is shown in Appendix A.
DFEs and FFEs differ in spatial behavior and strategic positioning: DFEs are locally embedded and stable, while FFEs are more mobile and technology-intensive (Guo, 2016; Liu & Nie, 2015; Zhang & Liu, 2013; Zhang & Long, 2018). Incorporating ownership heterogeneity into MRIO frameworks is essential to accurately model cross-border production dynamics and national economic resilience. Functionally, both DFEs and FFEs contribute comparably to global production through their sectoral outputs. Yet, amid surging deglobalization and geopolitical turbulence, the need to differentiate them becomes pressing. Ignoring this distinction risks overlooking the strategic influence of MNC-led restructuring on domestic industrial resilience. As such, in modeling intermediate flows based on the MRIO framework, integrating ownership heterogeneity helps us understand how production networks are reconfigured and what this means for national economic security.
2.3 Multi-Regional Input-Output data based on regional extensions
Global integration has changed both international and domestic divisions of labor. Intermediate goods now move more frequently across regions and sectors, linking GVCs and National Value Chains (NVCs) (Zhang & Liu, 2010). Scholars have different views on this trend. Some point to risks such as the “low-end lock-in” trap (Li, 2020; Lv et al., 2018), while others see chances for industrial upgrading through spillovers and resource coordination (Pietrobelli & Rabellotti, 2011; Li, 2020). Under China’s “dual circulation” strategy, balancing GVC participation with national market integration has become a pivotal policy concern.
Existing GVC studies tend to focus on national-level patterns, overlooking internal heterogeneity within NVCs. Due to spatial differences in resources and industrial structures, regional modes of GVC participation vary greatly. To capture this complexity, we adopt a RE-MRIO approach by embedding China’s IRIO table into the global ICIO framework (Meng et al., 2013; Tukker & Dietzenbacher, 2013).
As a common tool for analyzing trade flows and economic structures of sub-countries, the Chinese IRIO table has provided strong support for empirical research based on RE-MRIO. Methodologies such as gravity models (Mi et al., 2018), entropy models (Bonfiglio & Chelli, 2008; Zheng et al., 2022), and nested modeling approaches (Fry et al., 2022; Meng et al., 2013) have all contributed. Case studies show diverse embedding patterns across regions: Ni and Xia (2016) revealed the growing GVC integration of inland provinces; Li and Pan (2016) examined regional GVC positioning via vertical specialization and re-exportation metrics; Su (2016) exposed overestimations in coastal export value-added using 2007 data. Other efforts explored dual-chain effects on growth (Sheng et al., 2020), addressed NVC fragmentation (Liu & Xia, 2021), or improved model robustness through data fusion (Ye et al., 2022). Together, these studies lay the empirical foundation for RE-MRIO model construction. The data structure of the RE-MRIO table is presented in Appendix A.
In summary, the MRIO table offers a powerful lens through which the inner workings of global economic systems can be unraveled. By abstracting intermediate product flows into an adjacency matrix, researchers are able to construct single-mode network models that reflect intersectoral dependencies and cross-regional value transmissions. While China’s economy maintains overall stability, its production networks face mounting systemic risks, including global supply chain disruptions, shifting international power structures, and intensifying geopolitical tensions. These pressures challenge the resilience of its industrial foundations. Existing research leveraging the RE-MRIO table has achieved a reasonable level of methodological sophistication, and applications of the OECD-AMNE-based OE-MRIO framework are gradually emerging.
2.4 Gaps in Ownership-Region duality
The global disruptions caused by the COVID-19 pandemic and US-China trade friction have highlighted the need to understand internal restructuring of GVCs (Jiang et al., 2024; Li, 2020). However, existing models typically focus on regional differences or firm ownership, rather than both. Additionally, research on resilience often relies on qualitative classifications or single-layer network structures, lacking empirical tools capable of simultaneously capturing ownership and spatial heterogeneity.
This study fills this gap by offering a framework that links spatial and ownership heterogeneity in a unified empirical setting. It enables a more precise assessment of how foreign-funded and domestic firms contribute to regional imbalances, respond to disruptions, and influence industrial relocation across China’s production landscape.
3 Multiple extensions of MRIO tables
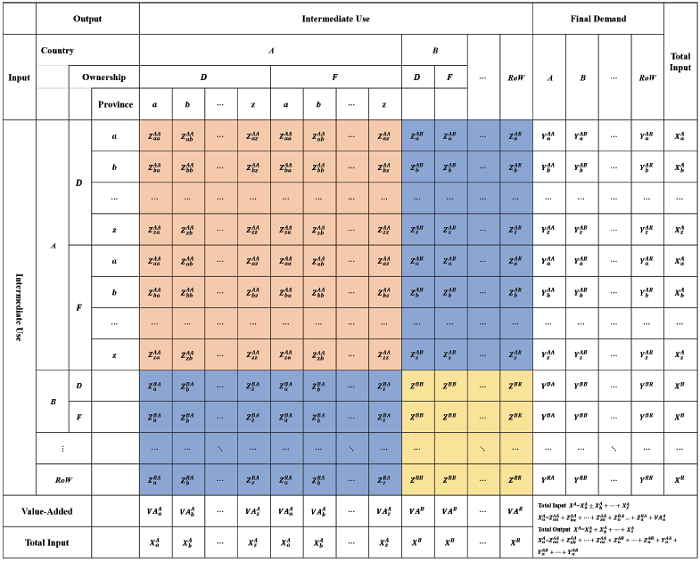
The traditional ICIO table allows us to analyze at the country level and consider the interdependencies between countries (Tian et al., 2022). Considering the need for linkages between a specific country and the global industry chain, we integrated the country’s IRIO into the global ICIO table and developed the RE-MRIO table. It is worth noting that there are two problems with IRIO tables in general. One is that IRIO tables are published less frequently than ICIO tables, resulting in missing data for some years. Therefore, we need to combine the existing data to derive the data for other years, and then get a series of temporally continuous IRIO tables. Second, the statistical caliber of IRIO table and ICIO table is not consistent. If IRIO combines domestic trade in intermediate goods at the regional level according to the classification of industrial sectors, we will find that the results are not the same as the data for this country in the ICIO table. In other words, we can only utilize the industrial structure information provided by the IRIO table to extend the ICIO table. In this section, we explain how to solve the above two problems and how to realize the regional extension of ICIO and OE-ICIO tables.
Figure 1 illustrates the construction logic of the RODE-MRIO table. The whole process consists of two main stages: regional extension and ownership extension. First, based on the global ICIO table and China’s IRIO tables, we fill in missing years and extract interregional input-output structures to refine the ICIO into RE-MRIO. This step resolves issues related to temporal discontinuity and spatial granularity. On this foundation, we incorporate structural statistical data on the share of DIS and FIS, and compile the OE-ICIO and OE-IRIO tables. Using the same methodology as the RE-MRIO extension, we apply the regional and ownership ratios from OE-IRIO to OE-ICIO, ultimately constructing the RODE-MRIO table. This table uniquely integrates both regional industrial connectivity and ownership disaggregation, offering enhanced realism and structural explanatory power.
Figure 1. The process flow chart of RODE-MRIO compilation. |
3.1 Fitting continuous year IRIO tables based on interval year IRIO tables
The IRIO table, as a class of MRIO table, requires a survey method for data collection and table preparation. Therefore, its preparation process is often labor-intensive and generally needs to be led by an economic organization or even the state. The China IRIO table can be used to analyze the production and consumption structure of provincial regions and the pattern of inter-provincial trade, and as a tool for national and regional economic planning. However, the last three years of China IRIO tables were released in 2012, 2015, and 2017, which obviously cannot meet the needs of academic research. Generally, in order to obtain MRIO tables for consecutive years, we can construct IO information for the remaining years in the sample period by linear interpolation (Zhang et al., 2020).
Table 1. IRIO table. |
 |
In order to improve the accuracy of the data, in this paper, based on the Chinese IRIO tables of the CEADs database in 2012, 2015, and 2017, the IRIO tables of other years during 2010-2019 were fitted by Weighted Linear Interpolation Method (WLIM) with the following formula:
$Z_{S_{i} S_{j}}^{R_{u} R_{v}}(t)=\left\{\begin{array}{cc} \frac{2}{3} Z_{S_{i} S_{j}}^{R_{u} R_{v}}(t-1)+\frac{1}{3} Z_{S_{i} S_{j}}^{R_{u} R_{v}}(t+2) & t=2013 \\ \frac{1}{3} Z_{S_{i} S_{j}}^{R_{u} R_{v}}(t-2)+\frac{2}{3} Z_{S_{i} S_{j}}^{R_{u} R_{v}}(t+1) & t=2014 \\ \frac{1}{2} Z_{S_{i} S_{j}}^{R_{u} R_{v}}(t-1)+\frac{1}{2} Z_{S_{i} S_{j}}^{R_{u} R_{v}}(t+1) & t=2016 \\ Z_{S_{i} S_{j}}^{R_{u} R_{v}}(t) & \text { else } \end{array}\right.$
where t∈{2010, 2011, …, 2019}. For the final demand, value added, and aggregate input/output components, we can fit a similar approach.
The basic assumption of the method is the stability of industrial structure in the short run. Since factors such as industrial restructuring, technological progress and policy changes do not usually change drastically in the short run, higher weights are assigned to adjacent years in case of data scarcity.
Figure 2 shows the total intermediate inputs of six representative industrial sectors to other regions of the country from 2010 to 2019. It can be seen that stable industries exhibit a smooth pattern consistent with the interpolation assumption, while volatile industries fluctuate within a reasonable range. This indicates that our key assumption of “short-term structural stability” is valid.
Figure 2. Provincial Inter-Industry Output Trends by Sector Based on IRIO (2010-2019). (a), (c), and (e) display three volatile sectors: S14 (Computer, electronic and optical equipment), S21 (Information transfer, software and IT services), and S22 (Financial and insurance activities). (b), (d), and (f) show three stable sectors: S16 (Electricity, gas, water supply, sewerage, waste and remediation services), S23 (Real estate activities), and S26 (Public administration and defence). Each line represents the total output of a sector in a specific province: gray = Beijing, red = Henan, blue = Shanghai, and green = Chongqing. The output is measured by the IRIO row sum, indicating the sector’s total intermediate input to the rest of China. |
3.2 Preparation of OE-IRIO tables based on statistical data and IRIO tables
The OE-MRIO table further describes the composition of DFEs and FFEs in the industrial sector, as well as the input-output relationship between these two types of firms. At present, there has not been any research on the regional extension of the OE-ICIO table, mainly due to the lack of an IRIO table that distinguishes the ratio of DFEs and FFEs in the industrial sector obtained through the survey method. To simplify calculations, we use a regional expansion method similar to the ICIO table, but it is necessary to assume that the internal and external investment ratios of each province and industry in the IRIO table are equal to the national level. However, this assumption deviates significantly from reality. Therefore, in order to better depict industrial structure and value flow patterns, we refined the domestic and foreign investment structure of the IRIO table. This refinement used data from DFEs and FFEs across Chinese regions (e.g., total industrial output of above-scale enterprises). Then, we construct a Regional Input-Output table (RE-IRIO) which enabled regional expansion of the OE-ICIO table.
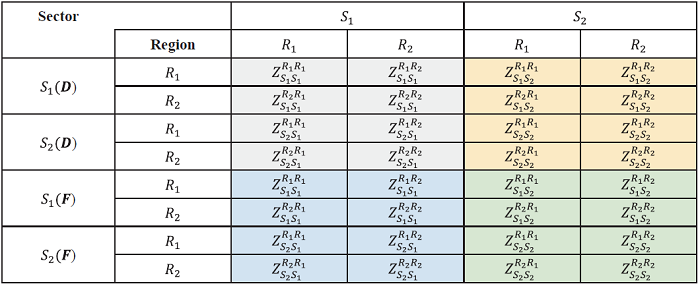
It is assumed that the OE-IRIO table contains two regions, denoted by R1 and R2, respectively; and the industrial sector of each region is subdivided into two parts, DIS and FIS, denoted by D and F, respectively. Considering that the GIVCN model built in this paper only deals with the intermediate use part of the MRIO table, we only introduce the regional extension method for this part.
The specific steps for the preparation of the OE-IRIO form are as follows:
Step 1: We count the Gross Industrial Output Value (GIOV) of Industrial Enterprises above Designated Size (IEADS) in each region. Based on this, we estimated the contribution ratio of domestic-funded enterprises to the production system in each region using the following formula:
$\text { Ratio }_{R_{1}}=\frac{R_{1} \text { Gross industrial output value of enterprises above industrial scale among DFEs in the region }}{R_{1} \text { Gross industrial output value of enterprises above industrial scale among DFEs and FFEs in the region }} \times 100 \%$
$\text { Ratio }_{R_{2}}=\frac{R_{2} \text { Gross industrial output value of enterprises above industrial scale among DFEs in the region }}{R_{2} \text { Gross industrial output value of enterprises above industrial scale among DFEs and FFEs in the region }} \times 100 \%$
Step 2: Assuming that the contribution ratios of DFEs and FFEs in all industrial sectors in each region to the production system are the same, namely Ratio and 1-Ratio, respectively, the intermediate product trade volume between DFEs and FFEs within and between regions can be obtained using the following formula:
$\begin{array}{c} Z_{D D}^{R_{1} R_{1}}=\text { Ratio }_{R_{1}} \times \text { Ratio }_{R_{1}} \times Z^{R_{1} R_{1}} ; Z_{D F}^{R_{1} R_{1}}=\text { Ratio }_{R_{1}} \times\left(1-\text { Ratio }_{R_{1}}\right) \times Z^{R_{1} R_{1}} ; \\ Z_{F D}^{R_{1} R_{1}}=\left(1-\text { Ratio }_{R_{1}}\right) \times \text { Ratio }_{R_{1}} \times Z^{R_{1} R_{1}} ; Z_{F F}^{R_{1} R_{1}}=\left(1-\text { Ratio }_{R_{1}}\right) \times\left(1-\text { Ratio }_{R_{1}}\right) \times Z^{R_{1} R_{1}} ; \\ Z_{D D}^{R_{1} R_{2}}=\text { Ratio }_{R_{1}} \times \text { Ratio }_{R_{2}} \times Z^{R_{1} R_{2}} ; Z_{D F}^{R_{1} R_{2}}=\text { Ratio }_{R_{1}} \times\left(1-\text { Ratio }_{R_{2}}\right) \times Z^{R_{1} R_{2}} \\ Z_{F D}^{R_{1} R_{2}}=\left(1-\text { Ratio }_{R_{1}}\right) \times \text { Ratio }_{R_{2}} \times Z^{R_{1} R_{2}} ; Z_{F F}^{R_{1} R_{2}}=\left(1-\text { Ratio }_{R_{1}}\right) \times\left(1-\text { Ratio }_{R_{2}}\right) \times Z^{R_{1} R_{2}} ; \\ Z_{D D}^{R_{2} R_{1}}=\text { Ratio }_{R_{2}} \times \text { Ratio }_{R_{1}} \times Z^{R_{2} R_{1}} ; Z_{D F}^{R_{2} R_{1}}=\text { Ratio }_{R_{2}} \times\left(1-\text { Ratio }_{R_{1}}\right) \times Z^{R_{2} R_{1}} \\ Z_{F D}^{R_{2} R_{1}}=\left(1-\text { Ratio }_{R_{2}}\right) \times \text { Ratio }_{R_{1}} \times Z^{R_{2} R_{1}} ; Z_{F F}^{R_{2} R_{1}}=\left(1-\text { Ratio }_{R_{2}}\right) \times\left(1-\text { Ratio }_{R_{1}}\right) \times Z^{R_{2} R_{1}} ; \\ Z_{D D}^{R_{2} R_{2}}=\text { Ratio }_{R_{2}} \times \text { Ratio }_{R_{2}} \times Z^{R_{2} R_{2}} ; Z_{D F}^{R_{2} R_{2}}=\text { Ratio }_{R_{2}} \times\left(1-\text { Ratio }_{R_{2}}\right) \times Z^{R_{2} R_{2}} \\ Z_{F D}^{R_{2} R_{2}}=\left(1-\text { Ratio }_{R_{2}}\right) \times \text { Ratio }_{R_{2}} \times Z^{R_{2} R_{2}} ; Z_{F F}^{R_{2} R_{2}}=\left(1-\text { Ratio }_{R_{2}}\right) \times\left(1-\text { Ratio }_{R_{2}}\right) \times Z^{R_{2} R_{2}} \end{array}$
Step 3: We organize the converted trade in intermediate products into an OE-IRIO table similar to the data structure of the OE-ICIO table, based on regional and sectoral attribution, as shown in Table 2.
Table 2. OE-IRIO table. |
 |
As shown in Figure 3, the total output of FIS has undergone structural and cyclical dynamics over the past decade. Since 2018, the escalation of US-China trade tensions has led to a significant decline in industries such as S14 (Computer, electronic and optical equipment) and S22 (Financial and insurance activities), particularly in coastal regions like Beijing and Shanghai. Additionally, even industries with weaker ties to global value chains, such as S23 (Real estate activities) and S21 (Information transfer, software and information technology services), have contracted as a result. In contrast, non-market service sectors like S26 (Public administration and defence) have shown moderate growth. Between 2015 and 2016, a brief period of policy-driven optimism emerged. Reforms such as the expansion of the Shanghai Free Trade Zone triggered a surge in input across various sectors.
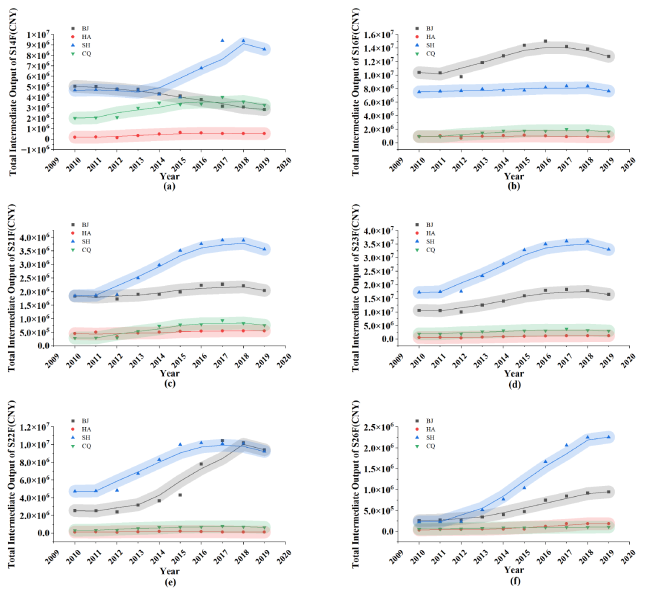
Figure 3. FIS Output Trends by Sector and Province Based on OE-IRIO (2010-2019). a-f show the OE-IRIO row sum (sector’s total intermediate output to the rest of China) for sectors S14, S16, S21, S23, S22 and S26, respectively. Colored dots and lines represent provinces: gray = Beijing, red = Henan, blue = Shanghai, green = Chongqing. |
3.3 Preparation of RE-MRIO tables based on ICIO and IRIO tables
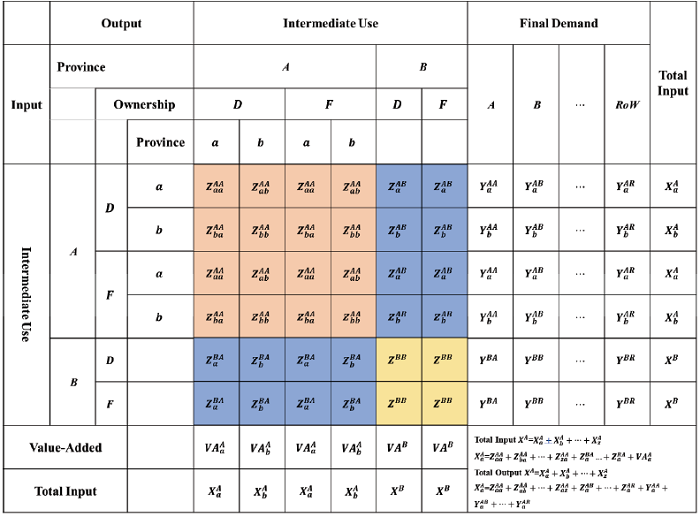
Researchers typically adopt one of two main approaches to construct RE-MRIO tables. The first approach preserves the total values from the IRIO table, then revises the structure using input-output ratios from the ICIO table (Meng et al., 2013). The second approach does the opposite: it retains the ICIO totals and adjusts the block matrix based on structural coefficients from the IRIO table (Pei et al., 2015). Both methods require prior harmonization of sector classifications between the ICIO and IRIO tables. MRIO tables can also ignore current-year currency units and exchange rates. In this study, we hold the ICIO’s aggregate data constant and apply IRIO input-output ratios to disaggregate China’s industrial sectors into 31 provincial units (excluding Xizang). This procedure extends the IRIO framework regionally within the ICIO table. Suppose that the ICIO table contains 2 countries, each of which in turn contains two sectors, where the IRIO table for country A contains 2 regions, each of which likewise contains two sectors. In practice, if the number of sectors in the ICIO table and the IRIO table are not equal, the greatest common divisor of the two can be taken, as shown in Tables 6 and 7. Considering that the GIVCN model developed in this paper only deals with the intermediate use part of the MRIO table, we only present the regional extension method for this part.
In the ICIO table, we used different colors to highlight IO relationships among sectors in Country A. We applied the same color scheme in the IRIO table to mark its sectoral IO links.
Table 3. ICIO table for two countries and two sectors (intermediate use area). |
 |
Table 4. IRIO table for two regions and two sectors in country A (intermediate use area). |
 |
Table 5. ICIO table prioritized by sector(intermediate use area). |
 |
Table 6. IRIO table prioritized by sector (intermediate use area). |
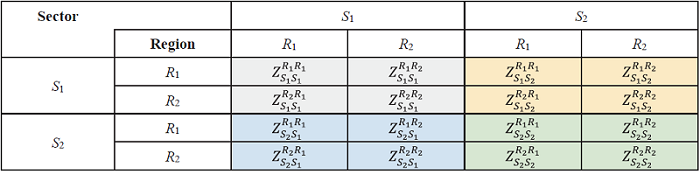 |
Table 7. Interregional input-output coefficients based on IRIO tables (intermediate-use area). |
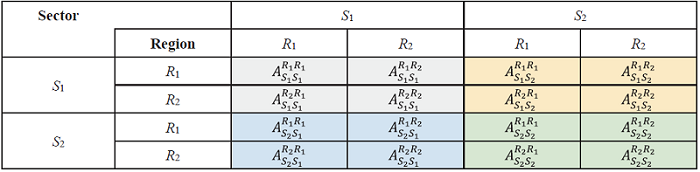 |
Table 8. Table RE-MRIO for regional extensions for country A (intermediate use area). |
 |
The specific steps for the preparation of the RE-MIRO table are as follows:
Step 1: Extend the domestic intermediate use component of country A in the ICIO table according to the IRIO table.
Consider the issue of consistency in the caliber of the data statistics, i.e., there may be:
$Z_{S_{1} S_{1}}^{A A} \neq Z_{S_{1} S_{1}}^{R_{1} R_{1}}+Z_{S_{1} S_{1}}^{R_{1} R_{2}}+Z_{S_{1} S_{1}}^{R_{2} R_{1}}+Z_{S_{1} S_{1}}^{R_{2} R_{2}}$
In this case, the set of formulas for each of the IO coefficients is as follows:
$\begin{array}{l} A_{S_{1} S_{1}}^{R_{1} R_{1}}=Z_{S_{1} S_{1}}^{R_{1} R_{1}} \div\left(Z_{S_{1} S_{1}}^{R_{1} R_{1}}+Z_{S_{1} S_{1}}^{R_{1} R_{2}}+Z_{S_{1} S_{1}}^{R_{2} R_{1}}+Z_{S_{1} S_{1}}^{R_{2} R_{2}}\right) ; A_{S_{1} S_{1}}^{R_{1} R_{2}}=Z_{S_{1} S_{1}}^{R_{1} R_{2}} \div\left(Z_{S_{1} S_{1}}^{R_{1} R_{1}}+Z_{S_{1} S_{1}}^{R_{1} R_{2}}+Z_{S_{1} S_{1}}^{R_{2} R_{1}}+Z_{S_{1} S_{1}}^{R_{2} R_{2}}\right) ; \\ A_{S_{1} S_{1}}^{R_{2} R_{1}}=Z_{S_{1} S_{1}}^{R_{2} R_{1}} \div\left(Z_{S_{1} S_{1}}^{R_{1} R_{1}}+Z_{S_{1} S_{1}}^{R_{1} R_{2}}+Z_{S_{1} S_{1}}^{R_{2} R_{1}}+Z_{S_{1} S_{1}}^{R_{2} R_{2}}\right) ; A_{S_{1} S_{1}}^{R_{1} R_{2}}=Z_{S_{1} S_{1}}^{R_{2} R_{2}} \div\left(Z_{S_{1} S_{1}}^{R_{1} R_{1}}+Z_{S_{1} S_{1}}^{R_{1} R_{2}}+Z_{S_{1} S_{1}}^{R_{2} R_{1}}+Z_{S_{1} S_{1}}^{R_{2} R_{2}}\right) ; \\ A_{S_{1} S_{2}}^{R_{1} R_{1}}=Z_{S_{1} S_{2}}^{R_{1} R_{1}} \div\left(Z_{S_{1} S_{2}}^{R_{1} R_{1}}+Z_{S_{1} S_{2}}^{R_{1} R_{2}}+Z_{S_{1} S_{2}}^{R_{2} R_{1}}+Z_{S_{1} S_{2}}^{R_{2} R_{2}}\right) ; A_{S_{1} S_{2}}^{R_{1} R_{2}}=Z_{S_{1} S_{2}}^{R_{1} R_{2}} \div\left(Z_{S_{1} S_{2}}^{R_{1} R_{1}}+Z_{S_{1} S_{2}}^{R_{1} R_{2}}+Z_{S_{1} S_{2}}^{R_{2} R_{1}}+Z_{S_{1} S_{2}}^{R_{2} R_{2}}\right) ; \\ A_{S_{1} S_{2}}^{R_{2} R_{1}}=Z_{S_{1} S_{2}}^{R_{2} R_{1}} \div\left(Z_{S_{1} S_{2}}^{R_{1} R_{1}}+Z_{S_{1} S_{2}}^{R_{1} R_{2}}+Z_{S_{1} S_{2}}^{R_{2} R_{1}}+Z_{S_{1} S_{2}}^{R_{2} R_{2}}\right) ; A_{S_{1} S_{2}}^{R_{2} R_{2}}=Z_{S_{1} S_{2}}^{R_{2} R_{2}} \div\left(Z_{S_{1} S_{2}}^{R_{1} R_{1}}+Z_{S_{1} S_{2}}^{R_{1} R_{2}}+Z_{S_{1} S_{2}}^{R_{2} R_{1}}+Z_{S_{1} S_{2}}^{R_{2} R_{2}}\right) ; \\ A_{S_{2} S_{1}}^{R_{1} R_{1}}=Z_{S_{2} S_{1}}^{R_{1} R_{1}} \div\left(Z_{S_{2} S_{1}}^{R_{1} R_{1}}+Z_{S_{2} S_{1}}^{R_{1} R_{2}}+Z_{S_{2} S_{1}}^{R_{2} R_{1}}+Z_{S_{2} S_{1}}^{R_{2} R_{2}}\right) ; A_{S_{2} S_{1}}^{R_{1} R_{2}}=Z_{S_{2} S_{1}}^{R_{1} R_{2}} \div\left(Z_{S_{2} S_{1}}^{R_{1} R_{1}}+Z_{S_{2} S_{1}}^{R_{1} R_{2}}+Z_{S_{2} S_{1}}^{R_{2} R_{1}}+Z_{S_{2} S_{1}}^{R_{2} R_{2}}\right) ; \\ A_{S_{2} S_{1}}^{R_{2} R_{1}}=Z_{S_{2} S_{1}}^{R_{2} R_{1}} \div\left(Z_{S_{2} S_{1}}^{R_{1} R_{1}}+Z_{S_{2} S_{1}}^{R_{1} R_{2}}+Z_{S_{2} S_{1}}^{R_{2} R_{1}}+Z_{S_{2} S_{1}}^{R_{2} R_{2}}\right) ; A_{S_{2} S_{1}}^{R_{2} R_{2}}=Z_{S_{2} S_{1}}^{R_{2} R_{2}} \div\left(Z_{S_{2} S_{1}}^{R_{1} R_{1}}+Z_{S_{2} S_{1}}^{R_{1} R_{2}}+Z_{S_{2} S_{1}}^{R_{2} R_{1}}+Z_{S_{2} S_{1}}^{R_{2} R_{2}}\right) ; \\ A_{S_{2} S_{2}}^{R_{1} R_{1}}=Z_{S_{2} S_{2}}^{R_{1} R_{1}} \div\left(Z_{S_{2} S_{2}}^{R_{1} R_{1}}+Z_{S_{2} S_{2}}^{R_{1} R_{2}}+Z_{S_{2} S_{2}}^{R_{2} R_{1}}+Z_{S_{2} S_{2}}^{R_{2} R_{2}}\right) ; A_{S_{2} S_{2}}^{R_{1} R_{2}}=Z_{S_{2} S_{2}}^{R_{1} R_{2}} \div\left(Z_{S_{2} S_{2}}^{R_{1} R_{1}}+Z_{S_{2} S_{2}}^{R_{1} R_{2}}+Z_{S_{2} S_{2}}^{R_{2} R_{1}}+Z_{S_{2} S_{2}}^{R_{2} R_{2}}\right) ; \\ A_{S_{2} S_{2}}^{R_{2} R_{1}}=Z_{S_{2} S_{2}}^{R_{2} R_{1}} \div\left(Z_{S_{2} S_{2}}^{R_{1} R_{1}}+Z_{S_{2} S_{2}}^{R_{1} R_{2}}+Z_{S_{2} S_{2}}^{R_{2} R_{1}}+Z_{S_{2} S_{2}}^{R_{2} R_{2}}\right) ; A_{S_{2} S_{2}}^{R_{2} R_{2}}=Z_{S_{2} S_{2}}^{R_{2} R_{2}} \div\left(Z_{S_{2} S_{2}}^{R_{1} R_{1}}+Z_{S_{2} S_{2}}^{R_{1} R_{2}}+Z_{S_{2} S_{2}}^{R_{2} R_{1}}+Z_{S_{2} S_{2}}^{R_{2} R_{2}}\right) \end{array}$
Within sector S1, the group of formulae for calculating IO data between regions R1 and R2 in country A is:
$\begin{array}{l} Z_{S_{1} S_{1}}^{A R_{1} A R_{1}}=Z_{S_{1} S_{1}}^{A A} \times A_{S_{1} S_{1}}^{R_{1} R_{1}} ; Z_{S_{1} S_{1}}^{A R_{1} A R_{2}}=Z_{S_{1} S_{1}}^{A A} \times A_{S_{1} S_{1}}^{R_{1} R_{2}} ; \\ Z_{S_{1} S_{1}}^{A R_{2} A R_{1}}=Z_{S_{1} S_{1}}^{A A} \times A_{S_{1} S_{1}}^{R_{2} R_{1}} ; Z_{S_{1} S_{1}}^{A R_{2} A R_{2}}=Z_{S_{1} S_{1}}^{A A} \times A_{S_{1} S_{1}}^{R_{2} R_{2}} \end{array}$
Sector S1 to Sector S2, the group of formulae for calculating the IO data for regions R1 and R2 in State A and State B are:
$\begin{array}{l} Z_{S_{1} S_{2}}^{A R_{1} A R_{1}}=Z_{S_{1} S_{2}}^{A A} \times A_{S_{1} S_{2}}^{R_{1} R_{1}} ; Z_{S_{1} S_{2}}^{A R_{1} A R_{2}}=Z_{S_{1} S_{2}}^{A A} \times A_{S_{1} S_{2}}^{R_{2} R_{2}} ; \\ Z_{S_{1} S_{2}}^{A R_{2}}=Z_{S_{1} S_{2}}^{A A} \times A_{S_{1} S_{2}}^{R_{2} R_{1}} ; Z_{S_{1} S_{2}}^{A R_{2} A R_{1}}=Z_{S_{1} S_{2}}^{A A} \times A_{S_{1} S_{2}}^{R_{2} S_{1}} \end{array}$
Sector S2 to Sector S1, the group of formulae for calculating the IO data for regions R1 and R2 in State A and State B are:
$\begin{array}{l} Z_{S_{2} S_{1}}^{A R_{1} A R_{1}}=Z_{S_{2} S_{1}}^{A A} \times A_{S_{2} S_{1}}^{R_{1} R_{1}} ; Z_{S_{2} S_{1}}^{A R_{1} A R_{1}}=Z_{S_{2} S_{1}}^{A A} \times A_{S_{2} S_{1}}^{R_{1} R_{1}} ; \\ Z_{S_{2} S_{1}}^{A R_{2} A R_{1}}=Z_{S_{2} S_{1}}^{A A} \times A_{S_{2} S_{1}}^{R_{2} R_{1}} ; Z_{S_{2} S_{1}}^{A R_{2} A R_{2}}=Z_{S_{2} S_{1}}^{A A} \times A_{S_{2} S_{1}}^{R_{2} R_{2}} \end{array}$
Within sector S2, the group of formulae for calculating IO data between regions R1 and R2 in country A is:
$\begin{array}{l} Z_{S_{2} S_{1}}^{A R_{2} A R_{2}}=Z_{S_{2} S_{1}}^{A A} \times A_{S_{2} S_{1}}^{R_{2} R_{2}} ; Z_{S_{2} S_{2}}^{A R_{1} A R_{2}}=Z_{S_{2} S_{2}}^{A A} \times A_{S_{2} S_{2}}^{R_{1} R_{2}} ; \\ Z_{S_{2} S_{2}}^{A R_{2} A R_{1}}=Z_{S_{2} S_{2}}^{A A} \times A_{S_{2} S_{2}}^{R_{2} R_{1}} ; Z_{S_{2} S_{2}}^{A R_{2} A R_{2}}=Z_{S_{2} S_{2}}^{A A} \times A_{S_{2} S_{2}}^{R_{2} R_{2}} \end{array}$
Step 3: Synthesize the above calculations and compile the RE-MRIO table.
We compiled the results of the above calculations into Table 8. It is important to note that the IO values within country B have not changed.
The RE-MRIO procedure converts annual data from the IRIO table into the ICIO framework. This procedure closes data gaps and resolves inconsistent definitions. while ensuring comparability between domestic measurements and global benchmarks. Researchers can apply this procedure to other countries, such as by province in China or by state in the United States.
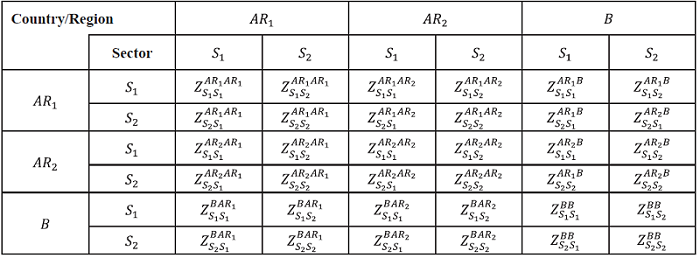
3.4 Preparation of RODE-MRIO table based on OE-ICIO tables and OE-IRIO tables
The methodology of the RODE-MRIO table is similar to that of the RE-MRIO table. The main difference is that the RE-MRIO table does not distinguish between DFEs and FFEs. We continue with the example of two regions and two sectors. First, we convert the OE-IRIO and OE-ICIO tables into a Priority-Ordered MRIO Table by Industrial Sector, as shown in Tables 9 and 10.
Table 9. OE-ICIO table prioritized by sector (intermediate use area). |
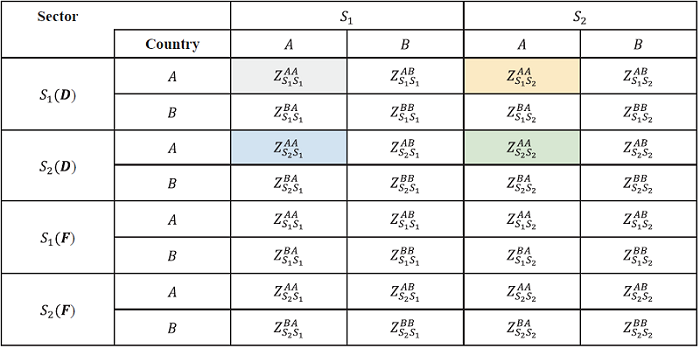 |
Table 10. OE-IRIO table prioritized by sector (intermediate use area). |
 |
Then, we converted the industrial structure information provided by the OE-IRIO table into IO coefficients between regions R1 and R2, and regionally extended the OE-ICIO table to obtain the global RODE-MRIO table, as shown in Table 11.
Table 11. RODE-MRIO table (intermediate use area). |
 |
To enhance model transparency, we provide a simplified case in Table 12. This example involves two countries: A (China) and B (Other). Country A is further disaggregated into two provinces (a and b), each with multiple sectors. Under this framework, China’s national-level data is split into interprovincial flows. For example, represents intra-provincial inputs, and represents inputs from province a to province b. Cross-border trade is also disaggregated. For instance, shows intermediate exports from province a to country B, while Y_a^AB captures final demand in country B for goods from province a. Data for country B remains unchanged (e.g., ZBB) to preserve consistency with the original ICIO structure.
Table 12. RODE-MRIO table containing only two countries (intermediate use area). |
 |
China’s OE-IRIO table includes 30 industrial sectors in 31 provincial-level administrative regions (except Xizang). Because of the statistical caliber issue, the number of sectors is set as the greatest common denominator between the two databases. In contrast, the global OE-ICIO table also includes the Hong Kong Special Administrative Region (HKSAR) and Taiwan Province of China. Therefore, the global RODE-MRIO table actually includes input-output data of local and multinational firms among the 33 provincial administrative regions in China, as shown in Appendix B. This is a data structure that no previous MRIO table has ever had at the same time.
4 Modeling and measurement of GDFEN
4.1 Modeling of GDFEN
We represent each sector in a country or region as a vertex (V), and the trade of intermediate goods between sectors as an edge (E). The trade volume, which reflects the strength of the relationship, is used as the weight (W). The total number of vertices is denoted as N, with the vertex set defined as V={v1, v2, ⋯, vN}. The edge set is E={e11, e12, ⋯, eij,⋯,eN(N-1), eNN}, and the corresponding weight set is W={w11, w12, ⋯, wij, ⋯, wN(N-1), wNN}. In this weighted network, the weight set W replaces the role of the edge set E. Specifically, we use the intermediate use matrix from the MRIO database as W. This matrix captures the production and trade of intermediate goods across countries and sectors in a given year, and quantifies their upstream and downstream linkages within GVCs. The graph G=(V, E, W) describes the underlying mechanism of value flow and interaction in GVCs. It reflects the global industrial division of labor under economic globalization.
The GPN constructed from the RODE-MRIO table is a heterogeneous network. This heterogeneity stems from differences in firm ownership within the industrial sector. Each node is associated with an attribute vector x, and all such vectors form the attribute matrix X. The network includes two mapping functions: a node type function τ:V→A and an edge type function ϕ:E→R. Each node v is assigned a type τ(v)∈A, and each edge e is assigned a type ϕ(e)∈R. In the GDFEN model, there are two node types (A=2): DIS and FIS. There are also four edge types (R=4), representing the possible connections between upstream and downstream sectors: DIS → DIS, DIS → FIS, FIS → DIS, and FIS → FIS.
The GDFEN model is a dense and nearly fully connected heterogeneous network. To uncover meaningful structural patterns, we apply the X-Index Filtering Algorithm (XIFA) (Xing et al., 2024) to extract a subnetwork that captures the most important intermediate product trade relationships. The resulting subnetwork is GDFEBN. The topological structures of China’s GDFEBN in 2010 and 2019 are shown in Figure 4. In 2010, FIS nodes were relatively isolated, mainly distributed at the network periphery, but their scale was comparable to that of DIS nodes, and both had similar connection levels. By 2019, the scale of FIS nodes had significantly expanded, and they had moved much closer to the network center. This shift reflects deeper integration between DFEs and FFEs within China’s production network. It also signals a higher degree of FIS embeddedness in the national value chain and a growing convergence in their industrial roles.
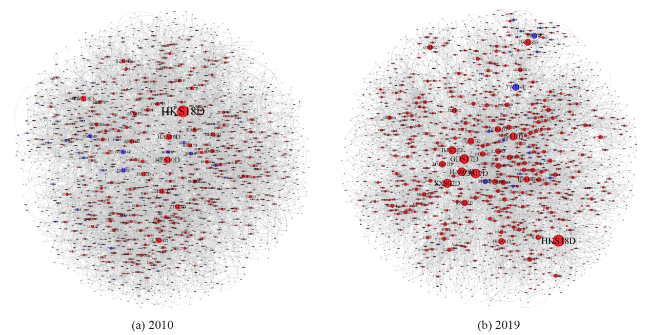
Figure 4. Topology of the GDFEBN-PRC model. (a) and (b)shows the network structure in 2010, and panel (b) shows the structure in 2019. Red nodes represent domestic-invested sectors (DIS), and blue nodes represent foreign-invested sectors (FIS). Node size reflects node degree, indicating the level of connectivity within the network. |
Building on this, we use the time-series changes in network metrics to trace the industrial relocation trend of FIS. Specifically, we select commonly used centrality measures from network science and interpret their economic meaning within the GDFEBN model. By comparing the ratios of FIS to DIS, we reveal the development heterogeneity between ownership types under the same macroeconomic conditions.
4.2 Analyzing regional differences and trends in the influence of China’s FIS
Degree Centrality (DC) measures the number of direct industrial links a sector maintains, indicating its influence within the GVC. The normalized DC of node i is:
$D C(i)=\frac{k_{i}}{N-1}$
Where ki is the number of edges directly connected to node i, and N is the total number of nodes. Higher DC suggests stronger network positioning. In directed networks, we distinguish between in-degree DCIN(i) and out-degree DCOUT(i) to reflect upstream and downstream linkages.
In order to measure the influence scope of FIS on GVC in each province of China, we design two indicators based on degree centrality, i.e., the downstream value chain influence of FIS (FIS_Downstream_Influence) and the upstream value chain influence of FIS (FIS_Upstream_Influence):
$F I S_{-} D o w n s t r e a m_{-} I n f l u e n c e(u)=\frac{\sum_{i \in \tau(u)} D C_{F}^{O U T}(i)}{\sum_{i \in \sigma(u)} D C_{D}^{O U T}(i)}$
$F I S_{-} U p s t r e a m_{-} I n f l u e n c e(u)=\frac{\sum_{i \in \tau(u)} D C_{F}^{I N}(i)}{\sum_{i \in \sigma(u)} D C_{D}^{I N}(i)}$
Where: and are the out-degree centrality of FIS and DIS, respectively; and are the in-degree centrality of the FIS and DIS, respectively; τ(u) and σ(u) are the subsets of sequence numbers in the set V of network nodes for the DIS and FIS of province u, respectively.
From 2010 to 2019, the influence of FIS in China’s provinces within GVCs showed a declining trend. Their role in export value-added creation weakened, and their reliance on imported intermediate goods also decreased. On average, FIS_Upstream_Influence dropped from 0.76 to 0.69, while FIS_Downstream_Influence fell from 0.75 to 0.67.
However, regional differences became more pronounced. Developed regions saw the largest declines, with both FIS_Upstream_Influence and FIS_Downstream_Influence dropping significantly. For example, Jiangsu’s FIS_Upstream_Influence fell by 25%, and in Guangdong, FIS_Upstream_Influence dropped from 0.819 to 0.577, and FIS_Downstream_Influence from 0.878 to 0.597. Many more developed and moderately developed regions followed similar patterns, though with greater variation. In provinces with heavy foreign investment in heavy industry, such as Liaoning, GVC influence rose sharply after 2016. In contrast, provinces like Anhui experienced a steady decline due to slower industrial upgrading.
Underdeveloped regions maintained the highest absolute values for both indicators, with only slight decreases. For instance, Guangxi’s FIS_Upstream_Influence declined from 1.088 to 0.701, and Qinghai’s FIS_Downstream_Influence only dropped slightly from 0.931 to 0.923. These results suggest that FIS still dominate the low-end segments of the value chain in these regions, with limited upstream domestic value-added and persistent reliance on downstream imports.
Figures 5 and 6 reveal the spatial shift of FIS. As a region with a high concentration of foreign investment, Eastern areas showed the most significant declines in both indicators, especially in the Yangtze River Delta and Pearl River Delta. Central China showed signs of catching up, but internal differences reflect the staged nature of industrial transfer. Western regions faced a dual challenge: high participation in GVCs but low value-added, with FIS still focused on resource exports and low-end processing.
Figure 5. Downstream Value Chain Influence of FIS by Province in China. |
Figure 6. Upstream Value Chain Influence of FIS by Province in China. |
Figure 7. Global Value Chain Profitability of FIS by Province in China. |
4.3 Regional differences and trend analysis of profitability in China’s FIS
Betweenness Centrality (BC) measures the extent to which a sector controls value-added flows by lying on the shortest paths in the production network. It reflects structural advantage per Burt’s structural holes theory. Specifically, for any pair of nodes j and k, let djk be the number of shortest paths between them, and djk(i) the number of such paths that pass through node i. The normalized formula is:
$B C(i)=\sum_{i, j, k \in\{1,2, \cdots, N\}} \frac{2 d_{j k}(i)}{(N-1)(N-2) d_{j k}}$
A higher BC indicates greater control and information advantage. Removal of high- BC sectors significantly impacts network efficiency and topology. To measure the relative profitability of foreign sectors within China’s GVC, we construct the FIS_GVC_Profitability index as:
$F I S_{-} G V C_{-} \operatorname{Profitability}(u)=\frac{\sum_{i \in \tau(u)} B C_{F}(i)}{\sum_{i \in \sigma(u)} B C_{D}(i)}$
Where: BCF(i) and BCD(i) are the median centrality of FIS and DIS, respectively; τ(u) and σ(u) are the subset of sequence numbers of the province u FIS and DIS in the set V of network nodes, respectively.
The relative profitability of FIS within the GVC has shown a general decline but with significant regional divergence. From 2010 to 2019, the FIS_GVC_Profitability value of more than 80% of the provinces in China decreased, the overall control of foreign capital channels weakened, and the network status of domestic capital departments improved. From the perspective of development levels, changes in FIS_GVC_Profitability values exhibit a gradient convergence pattern. Developed regions had the highest initial values (average of 0.79 in 2010) and the fastest decline rates (dropping to 0.46 by 2019, a decrease of 42%). Some provinces, such as Shanghai, maintained high outward orientation (BC > 0.97), while Beijing (-50%) and Zhejiang (-55%) accelerated their shift toward domestic capital-driven development. In comparison, more developed and moderately developed regions declined at a slower pace. Underdeveloped provinces showed a more gradual decline from relatively high levels (dropping 40% from 0.55 to 0.33), but still recorded the highest FIS_GVC_Profitability values. Resource-rich provinces like Qinghai and Gansu (FIS_GVC_Profitability > 0.52) remained heavily dependent on foreign capital.
From a regional perspective, the eastern provinces led the decline, narrowing the overall gap in FIS_GVC_Profitability values across regions (with the range changing from 1.53 in 2010 to 1.77 in 2019). However, underdeveloped western provinces continued to highlight the uneven nature of regional upgrading momentum.
4.4 Analyzing regional differences and trends in the robustness of China’s FIS
Closeness Centrality (CC) reflects how closely an industrial sector is connected to all other sectors in the GPN. A higher CC indicates tighter agglomeration with upstream/downstream sectors and stronger resilience. It is calculated as the reciprocal of the sum of the shortest path distances from node i to all other nodes:
$C C(i)=\frac{N-1}{\sum_{j \neq i} d_{i j}}$
Where dij is the shortest path from node i to node j. A higher CC(i) means shorter average distances, implying efficient value flow and greater risk resistance.
To measure the robustness of FIS in each province, we designs two indicators based on proximity centrality, i.e., downstream value chain robustness (FIS_Downstream_Robustness) and upstream value chain robustness (FIS_Upstream_Robustness) of FIS, with the following formulas:
$F I S_{-} \text {Downstream_Robustness }(u)=\frac{\sum_{i \in \tau(u)} C C_{F}^{O U T}(i)}{\sum_{i \in \sigma(u)} C C_{D}^{O U T}(i)} $
$F I S \_ \text {Upstream_Robustness }(u)=\frac{\sum_{i \in \tau(u)} C C_{F}^{I N}(i)}{\sum_{i \in \sigma(u)} C C_{D}^{I N}(i)}$
Where: and are the out-degree proximity centrality of the FIS and DIS, respectively; and are the in-degree proximity centrality of FIS and DIS, respectively; τ(u) and σ(u) are the sequence number subsets of FIS and DIS of the province u, in the set of network nodes V, respectively. of the subset of sequence numbers.
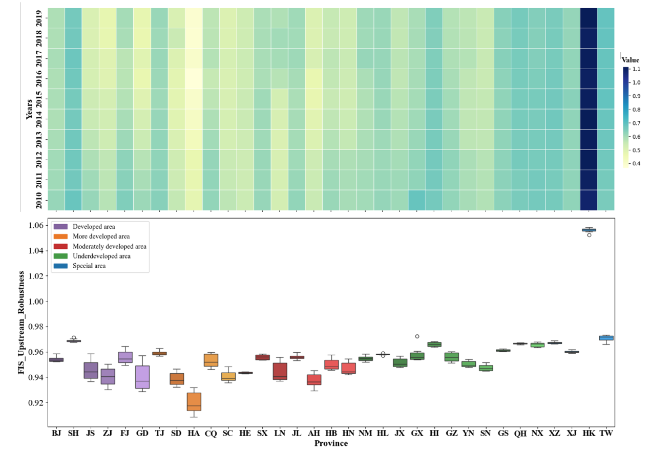
The robustness of DIS in GVC in each region of China shows significant regional differences and time evolution characteristics, and these changes are closely related to the level of regional economic development, the industry distribution of FFEs, and the macroeconomic background. FIS in developed eastern provinces such as Beijing and Shanghai benefit from high centrality within the GVC. In 2010, their FIS_Upstream_Robustness indices were 0.9586 and 0.9712 respectively, supporting strong upstream and downstream integration and effective risk-buffering mechanisms. However, ongoing domestic economic restructuring and the implementation of regional balancing strategies have led to a gradual shift in foreign capital distribution. Central and western provinces such as Yunnan and Chongqing have shown marked improvements in robustness indicators. For example, Yunnan’s FIS_Downstream_Robustness index rose steadily from 0.9607 in 2010 to 0.9623 in 2019. In Chongqing, the fluctuation range of FIS_Upstream_Robustness was 1.1 % age points narrower than that of the eastern regions, indicating its growing stability as a GVC node. At the same time, traditional industrial provinces in the East, such as Jiangsu and Zhejiang, experienced a 2.1 % decline in FIS_Upstream_Robustness over the decade, reflecting accelerated factor reallocation. This evolving pattern of regional interaction highlights the deepening of domestic economic circulation and provides structural support for constructing an open economy that integrates both domestic and international dynamics.
Figures 8 and 9 show the upstream and downstream robustness of FIS across provinces in China’s GVC participation. From 2010 to 2019, DFEs gained greater control over GVC networks, as reflected by national average declines in FIS_Upstream_Robustness (−0.006) and (FIS_Downstream_Robustness (−0.007). However, the rate of change varied significantly across regions. Eastern industrial provinces such as Jiangsu (FIS_Upstream_Robustness ↓2.18%) and Zhejiang (↓2.09%) showed the largest declines, indicating accelerated reallocation of production factors. In contrast, some central and western provinces [Yunnan (FIS_Downstream_Robustness ↑0.16%) and Chongqing (FIS_Upstream_Robustness fluctuation <1.1%)] demonstrated greater resilience.
Figure 8. Downstream Value Chain Robustness of FIS by Province in China. |
Figure 9. Upstream Value Chain Robustness of FIS by Province in China. |
From the perspective of development levels, in developed regions, both indicators showed overall declines and higher volatility (FIS_Upstream_Robustness average: 0.960 → 0.946; FIS_Downstream_Robustness average: 0.963 → 0.944). Moderately developed regions exhibited internal divergence, while provinces like Shandong experienced significant policy-driven increases (FIS_Downstream_Robustness ↑2.81%). Underdeveloped regions showed strong upstream stability (FIS_Upstream_Robustness: 0.961 → 0.956), with Qinghai and Gansu maintaining top national rankings. Among the special regions, Hong Kong (FIS_Downstream_Robustness ↑1.04%) and Taiwan Province of China (↑0.94%) further strengthened their foreign-invested dominance.
5 Conclusions and implications
This study examines the spatial transformation of FFEs in China’s GVC structure from 2010 to 2019. During this period, the overall influence, profitability, and network robustness of FFEs declined. However, the direction and pace of change varied across regions and development levels. This reflects a continued but uneven redistribution of foreign capital across the country.
In eastern and developed regions, the retreat of FFEs has become more apparent. While Shanghai has maintained a relatively high degree of openness, provinces such as Beijing, Zhejiang, and Guangdong have experienced a clear shift from foreign to domestic control. Central and moderately developed provinces have shown more diverse trends. Some provinces, including Shandong and Liaoning, experienced growth in foreign capital through industrial upgrading or policy support. Others followed patterns similar to developed regions. As a result, the central region has gradually taken on a transitional role in receiving industries relocating from the east. In western and less developed provinces, most GVC indicators remained relatively stable or declined only slightly. Although these regions still hold higher levels of foreign capital profitability and upstream robustness, their participation continues to rely heavily on low-end processing and resource-based activities. This suggests limited progress in functional upgrading despite sustained involvement in the GVC.
These findings lead to several important policy implications. In developed eastern regions, policies should focus on upgrading to higher value-added segments and improving the quality of openness. As foreign control declines, it is essential to strengthen the leadership of DFEs in areas such as R&D, design, and branding. At the same time, regions like Shanghai should improve alignment with international rules to attract knowledge-intensive foreign investment, such as R&D centers and regional headquarters. These efforts can turn the pressure of withdrawal into a driver for upgrading.
For central provinces serving as transitional zones, policy design needs to be more targeted and aligned with industrial chain needs. Drawing on the successful experiences of Chongqing and Liaoning, detailed industrial directories and incentive measures (such as targeted tax incentives and supply chain support funds) should be established to guide foreign investment toward smart manufacturing and services. In addition, a cross-provincial industrial transfer coordination platform should be established to avoid duplicate construction and unhealthy competition, integrating fragmented upgrades into regional cluster advantages.
For underdeveloped western regions, the key challenge is to break out of low-end lock-in while enhancing internal development capacity. Leveraging their upstream industrial strengths, these provinces should pursue deeper vertical integration in resource-based sectors such as rare earth processing. At the same time, tighter environmental regulations are needed to restrict entry of highly polluting and low value-added projects. Upgrading infrastructure and expanding the use of digital technologies would also help reduce logistics and information barriers. Such improvements are essential for fostering distinctive value chain nodes and enabling these regions to move from passive participation to more active roles in global production networks.
At the national level, stronger institutional coordination is essential. One priority is to enable technology spillovers from the eastern region to flow more effectively into central and western provinces. A “green channel” for sustainable industrial relocation could facilitate this process. Meanwhile, improving the business environment in central and western provinces is critical to address uneven absorptive capacity. Together, these efforts can help balance openness with security and promote coordinated regional development.
6 Limitations
This study has several limitations. First, the analysis is based on macro-level structural data. As a result, we offer only general policy suggestions and do not examine the design of specific policy tools.
Second, the dataset covers the period up to 2019. It does not account for recent environmental trade measures, such as those related to carbon emissions, which may have a significant impact on the behavior of FFEs.
Third, a comparison between China’s regional ownership dynamics and those of other major economies could deepen the analysis. However, such cross-country comparisons require harmonized data systems and fall outside the scope of this study.
Funding information
This work was supported by National Natural Science Foundation of China (72471007), Beijing Municipal Social Science Foundation Planning Project (23ZGB005), and Humanities and Social Science Foundation of Ministry of Education of the People's Republic of China (Grant No. 23YJAZH041).
Author contributions
Fangke Liu (Liufangke@emails.bjut.edu.cn): Data curation (Equal), Formal analysis (Equal), Methodology (Equal), Software (Equal), Writing - original draft (Supporting);
Lizhi Xing (itwasa@163.com): Conceptualization (Equal), Investigation (Equal), Supervision (Equal), Validation (Equal), Writing - original draft (Lead), Writing - review & editing (Equal).
Supplementary materials
Appendix A and Appendix B: Access at 10.57760/sciencedb.27762