


1 Introduction
The Spanish Foundation for Science and Technology (FECYT) plays a key role in implementing national open science policy. Since 2008, it has conducted the Assessment of the Editorial and Scientific Quality of Spanish Scientific Journals, a process that now includes open science criteria. This evaluation—both quantitative and qualitative—reflects FECYT’s commitment to enhancing editorial practices and promoting transparency and accessibility in research.
This paper aims to assess the implementation of open science policies in Spanish scientific journals, using indicators from FECYT’s most recent 2023 assessment to analyze compliance and integration of open science practices.
Previous studies conducted by universities have shown that the open science landscape in Spain is highly heterogeneous. One such study identified five groups of Spanish universities based on their open access (OA) policies: a first group with comprehensive policies, a second with strong but partial policies, a third in the process of implementation, a fourth with limited actions, and a fifth group with no open access measures in place (Abadal et al., 2013). An analysis of the OA output of Spanish public universities between 2011 and 2020 revealed that OA publications tend to be more visible and more frequently cited, particularly those disseminated through the Green and Gold models. Visibility and impact appear to be closely linked to funding availability and the preference for specific OA formats. The best predictors for the proportion of OA publications were the number of Gold documents, the impact of hybrid publications, and the presence of Bronze OA documents (De Filippo & Mañana-Rodríguez, 2022). Based on these findings, our first hypothesis (H1) is that considerable variability will be observed across the Spanish context; however, we anticipate that compliance with policies related to transparency and reuse will be higher than with other dimensions of openness and reproducibility.
This study also explores potential differences in the adoption of open science practices according to the type of publishing institution and thematic area. We hypothesise that the implementation of open science policies in Spanish scientific journals varies by disciplinary field and publisher type, and that this is shaped by normative, technological, and organisational factors (Banks et al., 2019; Schneider, 2022) (H2). Institutional journals, particularly those affiliated with universities, are expected to exhibit higher levels of compliance with basic transparency indicators, as they tend to align more closely with public and academic mandates regarding open access (De Filippo & Mañana-Rodríguez, 2022). In contrast, commercial journals, although often more innovative in technical terms, show lower levels of adoption of advanced open science practices such as open peer review or the publication of underlying research data (Melero et al., 2022).
Disciplinary differences are also relevant. Previous research has shown that fields such as the social sciences and humanities are more resistant to certain open science components—such as the use of preprints or open peer review—due to cultural attitudes, limited resources, and less well-developed regulatory frameworks (Abadal & Melero, 2022; Schneider, 2022). Finally, previous studies have shown that editorial differences are also evident in other areas, such as the implementation of gender policies, which also vary substantially depending on the type of publishing institution and thematic area (Coslado et al., 2023).
To address this general aim and the hypotheses set out above, this study proposes to gain an overall picture of Spanish editorial practices regarding open science, following these research objectives:
1. To analyse the transparency of Spanish scientific journals’ policies on content access and reuse.
2. To study the implementation of research data openness and reuse in editorial processes in the open science ecosystem.
3. To analyse these two dimensions in relation to the type of publishing institution and thematic area, as well as to identify potential differences between them.
Open science has gained increasing prominence in recent years by promoting accessible, reusable scientific knowledge to foster collaboration and interdisciplinary dialogue (UNESCO, 2021). It aims to remove financial, legal, and technical barriers that limit access to scientific output (Hallo et al., 2017). The movement began with early online journals such as Surfaces and Psycoloquy in 1991 (Melero & Abad García, 2008), ushering in the era of open access. Landmark initiatives like the 2002 Budapest Open Access Initiative (Budapest Open Access Initiative, n.d.), the Bethesda Statement (Bethesda Statement on Open Access Publishing, n.d.), and the 2003 Berlin Declaration (Berlin Declaration, n.d.) defined open access as free and unrestricted digital literature. The European Commission reinforced these ideals in 2007 by advocating open access to EU-funded research, followed by the 2012 San Francisco Declaration, which emphasized research quality over publication metrics (Zhang et al., 2017). UNESCO further solidified global commitment with its 2020 open science recommendations (UNESCO, 2021).
Building on these principles, Plan S, launched in 2018 by cOAlition S, mandated immediate open access to publicly funded research (Emery & Stone, 2021). However, it faced resistance due to clashes with traditional publishing models and concerns about quality and equity. In response, strategic updates promoted author rights retention, societal impact assessments, and improved editorial standards (cOAlition S, 2023). The open science agenda has since expanded to include open data, alternative metrics, and interoperable digital infrastructures (Galindo et al., 2019; Emery & Stone, 2021).
In line with the broader shift towards open science, the Transparency and Openness Promotion (TOP) Guidelines, developed by the Center for Open Science ① , offer a widely recognised framework to advance transparency and reproducibility in research. The 2025 update groups practices into three categories and introduces a three-level implementation model, allowing flexible adoption. The TOP Factor measures journals’ alignment with open science principles. With over 5,000 signatories, the guidelines play a key role in institutionalising open science.
In Spain, institutional adoption of open access policies has grown, though implementation varies (Abadal et al., 2013; De Filippo et al., 2023). The 2011 Science Law was the first national measure to mandate open access for publicly funded research. These early efforts paved the way for subsequent legislation, including the 2022 Science Act reform, the 2023 Organic Act on Universities (Spain, 2022, 2023), and the 2023 National Open Science Strategy (ENCA) (Ministerio de Ciencia e Innovación, 2023).
ENCA aims to strengthen R&D&I and facilitate knowledge transfer, citizen participation, and scientific leadership. It aligns with European open science policies by promoting civil society’s role in knowledge generation and enhancing public recognition of science (Raya Díez, 2023).
Spain’s involvement in international reform is further demonstrated through its active role in the Coalition for Advancing Research Assessment (CoARA), including the creation of a Spanish National Chapter in 2023 (Coalition for Advancing Research Assessment, 2023). This initiative, led by the National Agency for Quality Assessment and Accreditation (ANECA), the Conference of Rectors of Spanish Universities (CRUE), and the Spanish National Research Council (CSIC), seeks to enhance transparency, inclusivity, and excellence in research evaluation while supporting open science principles (CoARA, 2022).
While Spanish universities increasingly embrace open access, disparities remain in policy execution (Abadal et al., 2013; De Filippo & Mañana-Rodríguez, 2022). Open access boosts visibility and dissemination, potentially increasing research impact (Peraut, 2016; Ruiz, 2020). However, Spanish open access journals often face challenges in financial sustainability and editorial quality (Claudio-González & Villarroya, 2015; Fradkin & Mugnaini, 2024). Strategies such as controlled vocabularies and standardized procedures have been proposed to enhance editorial management and ensure quality (Peraut, 2016; Banzato & Rozemblum, 2019).
Institutional repositories also support open access by improving access and discoverability (Reyes et al., 2013), yet most policies focus narrowly on access, neglecting broader open science aspects like peer review transparency and data openness (Manzano-Patrón et al., 2021). Thus, while progress has been made, full integration of open science principles into editorial practices remains incomplete.
Editor and author perceptions significantly influence policy effectiveness. A study on Latin America revealed limited understanding of open access implications despite high levels of open-access publishing (Sánchez-Tarragó et al., 2016). In Spain, increasing interest among younger researchers suggests a promising shift toward open science (Bravo & Nicholas, 2021).
Within this context, the diamond open access model—free for both readers and authors, typically managed by academic institutions—is gaining traction in Spain. Supported by national and European initiatives, it represents a sustainable, equitable alternative in scholarly publishing (FECYT, 2024). According to the Union of Spanish University Presses (UNE) (2023), 84% of Spain’s open access journals follow this model. In the humanities, 76.3% of digital international humanities journals operate under diamond open access (Martínez Cantón, 2021). However, long-term sustainability remains a concern, as highlighted in the DIAMAS “D5.1 IPSP Sustainability Research Report,” which calls for stable funding and institutional backing (Brun et al., 2024).
2 Methodology
This study analyses the results found in the 2023 FECYT Assessment of the Editorial and Scientific Quality of Spanish Scientific Journals. To be eligible for evaluation by the FECYT (according to the regulations of the call itself), a journal must meet several criteria: be legally established in Spain, be an active scientific journal (i.e. currently publishing), have an ISSN, have at least five years of continuous publishing activity and be associated with any field of knowledge. According to the call, a ‘Spanish journal’ must be based and legally established in Spain. This designation is based on institutional and administrative location rather than language of publication. Publishing in Spanish is not a requirement, although many journals do so.
The journal assessment procedure will be described next. A total of eight assessments have been run, counting the 2023 edition. Journals apply voluntarily to participate. The process has two parts, a quantitative assessment and a qualitative assessment. The quantitative assessment examines mandatory indicators and indicators recommended with the objective of gradually introducing a series of directives and guidelines for journals to follow (FECYT, 2023). Working in parallel with this quantitative assessment, a panel of experts conducts a qualitative assessment of each publication’s scientific contents and scientific career. The journals that pass the process earn the FECYT Quality Seal, which is good for one year. When the year is up, certified journals are automatically re-examined for renewal, following the rules set for the latest assessment (Coslado et al., 2010; Sanz-Casado et al., 2023).
Altogether, the eight assessments have evaluated nearly 1,200 journals, of these, 627 (52.25%) are currently FECYT-certified ② . The subjects examined in this paper are the 254 journals that participated in the 2023 assessment hoping to earn the Quality Seal, and they represent approximately 20% of the total number of journals evaluated through FECYT’s assessment processes. This assessment includes a new dimension associated with open science. This assessment provides insight into the scientific publishing ecosystem in Spain, where institutional and university publishers play a pivotal role in shaping editorial policies. The evaluation underscores the importance of these journals, not only for advancing transparency and democratization of knowledge but also for enhancing Spain’s research visibility on an international level.
To reach the proposed objectives, several indicators have been selected. These indicators are grouped into two dimensions mentioned above: 1) transparency in policies on content access and reuse and 2) openness and reproducibility.
2.1 Description of the indicators used
2.1.1 Transparency in policies on content access and reuse
(1) Specify the licences under which contents are published.
Journals must clearly indicate the licences under which content is published, both on their websites and within each article. Common licences include CC-BY, which permits redistribution and adaptation with attribution (Canales & Melero, 2021; Cantrell & Wipperman, 2023). Alternatives like CC-BY-NC and CC-BY-SA allow authors to impose additional conditions such as non-commercial use or licence sharing (Huh, 2018).
(2) Make the ownership of the intellectual property rights to the published articles clear to the author(s).
(3) Allow the author(s) to deposit the final version accepted for publication in open access repositories.
(4) Post journals’ editorial policy on Sherpa Romeo.
(5) In open access journals, specify if there is an article-processing charge (APC).
(6) In open access journals, register in the Directory of Open Access Journals (DOAJ).
For open access journals, it is fundamental to register in the DOAJ. Not only does registration increase a journal’s visibility, but also being in the DOAJ is like having a quality seal, since applicants are accepted only if they comply with certain transparency criteria and good editorial practices (Hrynaszkiewicz et al., 2020; Thu-Mai et al., 2020). DOAJ registration fosters author trust in the journal and promotes the adoption of open access practices.
2.1.2 Openness and reproducibility
(1) Publish open access contents under licences that respect open access.
Publishing content under licences that respect open access gives users broad permission to use, share and adapt contents freely and legally, if they credit the original author (Jeong, 2020).
(2) Encourage authors to deposit supplementary materials in institutional repositories.
Journals should encourage authors to deposit supplementary data in repositories, ensuring reproducibility and fostering collaboration (Schiltz, 2018). This aligns closely with the principles outlined in the TOP Guidelines, which advocate for the adoption of editorial policies that enhance data sharing, materials availability, and other open science practices. By facilitating the connection between articles and their associated datasets, journals contribute to transparency and the reproducibility of scientific findings.
(3) Associate the articles the journal publishes with their materials, using unique, persistent identifiers.
Linking articles to datasets and supplementary materials via persistent identifiers ensures data traceability and transparency, critical for research integrity (Hübner, 2020).
Persistent identifiers play a pivotal role in achieving the standards set by the TOP Guidelines. By ensuring that research outputs are findable, accessible, and reusable across platforms, they support rigorous data sharing and enhance the reproducibility of scientific findings. Additionally, the TOP Guidelines’ emphasis on metadata quality and interoperability further strengthens this connection, allowing journals to align their editorial policies with the principles of openness.
(4) Allow preprint sharing.
Allowing preprints promotes early feedback, increases visibility, and encourages collaboration before peer-reviewed publication (Rej et al., 2019). This aligns with the Transparency and Openness the TOP Guidelines enhance the reproducibility and verification of scientific findings. In this context, enabling preprints not only broadens access to early scientific work but also supports the implementation levels (disclosure, sharing, and certification). These practices help create a more transparent and reproducible scientific ecosystem, consistent with the principles evaluated by the TOP Factor.
(5) Allow open peer review.
This practice involves carrying out the article evaluation process in a way that is transparent and accessible for the scientific community and the public in general. In open peer review, review reports and reviewer names are made public together with the reviewed article once the review process is completed. This openness promotes trust in the integrity of the peer review process and in the quality of the published research. By sharing review comments, the authors gain the opportunity to understand better their works’ strengths and weaknesses, and this leads to significant improvement in the quality and clarity of scientific articles (Wolfram et al., 2020).
Open peer review enables a wide range of interested persons to participate in the research assessment process (Bornmann & Daniel, 2010). This fosters a culture of collaboration and participation in the scientific community, where the opinions and comments of diverse experts can enhance the review process. It also provides an opportunity to learn from colleagues’ comments and suggestions. While authors improve their scientific communication and writing skills, reviewers can develop a deeper understanding of the standards of quality and ethics in research (Ford, 2013).
(6) Have a protocol for transferring metadata to open access repositories and content aggregators.
Metadata are structured information that describe and facilitate the identification, retrieval and use of digital resources (Greenberg, 2009). Establishing a clear, consistent protocol for metadata transfers benefits both content providers and end users. This is especially important in the present context, where the quantity of information available on-line is overwhelming and search precision is fundamental for finding relevant resources. The protocol has to be based on internationally recognised standards, to guarantee the quality and coherence of the metadata and ensure that they meet the technical and interoperability requirements set by the scientific community (Gill, 2008; Park & Tosaka, 2010).
In this context, the TOP Guidelines, reinforce the importance of such standards by encouraging journals to adopt policies that support reproducibility and data accessibility. Several of the TOP practices—such as data sharing, code availability, and study preregistration—require the use of rich, interoperable metadata to ensure that research outputs are findable, accessible, and reusable across platforms.
(7) Publicly post the authorised list of reviewers.
Publicising reviewer lists increases transparency, helps manage conflicts of interest, and promotes inclusion. It also acknowledges reviewers’ contributions and enhances community engagement (Bravo et al., 2022).
Table 1 shows the indicators used for each of the dimensions, their measurement method and compliance criteria.
Table 1. Dimensions, indicators, measurement and compliance criteria. |
| 1. Transparency in policies on content access and reuse. | ||
|---|---|---|
| Indicator | Measurement | Compliance |
| 1.1 Specify the licences under which contents are published | Public information about the journal (website, instructions for submitting manuscripts) | This has to be explicitly stated in the information on manuscript submission, the journal’s editorial standards, the good practice guide or some other public section of the journal. |
| 1.2 Make the intellectual property right ownership situation clear to the author(s) | Public information about the journal (review of recent issues or the journal’s table of contents). | |
| 1.3 Allow the author(s) to deposit the final version accepted for publication in institutional or subject-specific repositories | Public information about the journal (website, instructions for submitting manuscripts) | |
| 1.4 Post the editorial policy on Sherpa Romeo | Direct consultation at https://openpolicyfinder.jisc.ac.uk/ | Either it is at https://openpolicyfinder.jisc.ac.uk/ or it is not. |
| 1.5 In open access journals, state whether there is an article-processing charge | Public information about the journal (website, instructions for submitting manuscripts) | This recommendation has to be explicitly stated in the information on manuscript submission, the journal’s editorial standards, the good practice guide or some other public section of the journal. |
| 1.6 In open-access journals, register in DOAJ | Direct consultation at https://doaj.org/ | Either it is at https://doaj.org/ or it is not. |
| 2. Openness and reproducibility. | ||
| Indicator | Measurement | Compliance |
| 2.1 Publish open access contents under a CC-BY licence or a CC-BYNC, CC-BY-SA or CC-BY-NC-SA licence | Public information about the journal (website) or in articles | This has to be explicitly stated in the information on manuscript submission, the journal’s editorial standards, the good practice guide or some other public section of the journal, and within articles. |
| 2.2 Encourage the author(s) to deposit supplementary materials | Public information about the journal (website) | |
| 2.3 Associate published articles with their supplementary materials | ||
| 2.4 Allow preprint sharing | ||
| 2.5 Allow open peer review | ||
| 2.6 Have a protocol for transferring metadata to open access repositories and content aggregators | ||
| 2.7 Publicly post the authorised list of reviewers | ||
2.2 Information processing and analysis
The information obtained about the 254 journals evaluated in 2023 call is classified on the basis of these two variables for a greater level of detail:
1. Publisher type. Publishers are organised into the major institutional sectors that publish scientific journals, using the same classification as in previous studies (Sanz-Casado et al., 2021), namely:
a. Institutional publishers: These include government agencies and entities belonging to think tanks, institutes, the Spanish National Research Council and universities.
b. Academic associations/societies, professional societies and foundations.
c. Commercial publishers.
2. Subject area. Since 90% of the journals examined belong to the area of Social Sciences and Humanities, the 16-category classification established in Ranking de visibilidad e impacto de revistas científicas españolas de Humanidades y Ciencias Sociales con Sello de Calidad FECYT is adopted ③ . Because interdisciplinary journals are classified into more than one area when they apply for FECYT assessment, the sum of the journals in this classification system is greater than the total number of journals analysed.
To examine the relationship between the indicators and variables mentioned above, contingency tables have been prepared using the absolute frequencies of compliance for each indicator, and nonparametric statistical tests for variable association (chi-squared tests) have been performed. In the case of the “publisher type” variable, the three major publisher types (Institutional, Societies and Commercial) are used. For the subject areas, the 17 categories of the classification system are used. Testing reveals whether there is dependence between the indicators and the variables (dependence exists when the p-value is <0.05). Tables with Chi2 values and p-values are shown in Appendix.
3 Results
3.1 Transparency in policies on access to and reuse of contents.
Looking at compliance percentages for each indicator, Figure 1 shows that transparency indicators generally present better compliance rates, especially indicator 1.1 (specify the licences under which contents are published) and indicator 1.2 (make intellectual property right ownership clear to the author(s)); these two policies seem to be active practices in over 90% of the journals. Indicator 1.4 (post the editorial policy on Sherpa Romeo) is, on the other hand, the indicator with the worst compliance rate (37% of the journals).
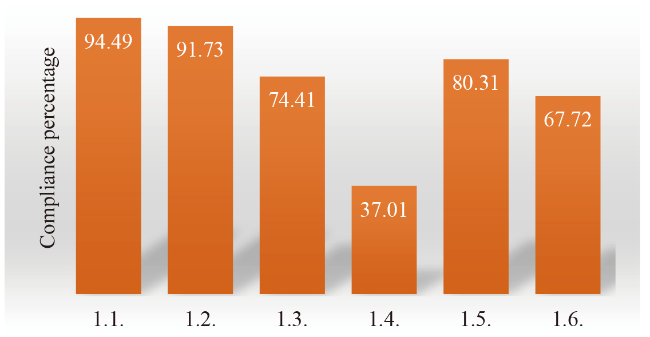
Figure 1. Indicators of transparency in policies on open access to and reuse of contents. |
Journal classification by publisher reveals that the vast majority (approximately 83%) are institutional publishers, mainly university presses. Table 2 presents the percentage of journals that comply with each indicator, disaggregated by institution type and including totals for the three major publisher groups. Institutional journals in general—and university journals in particular—show higher levels of compliance with the indicators. Among journals published by societies or associations, those linked to foundations appear more strongly committed to transparency indicators. However, statistical testing shows no significant association between the “institution type” variable and any of the indicators. Although results from certain institutions deviate considerably from the average, the small sample size in these cases prevents the test from yielding statistically significant results.
Table 2. Indicator compliance percentage by journal publisher type. |
| Institution type | Total | 1.1 | 1.1% | 1.2 | 1.2% | 1.3 | 1.3% | 1.4 | 1.4% | 1.5 | 1.5% | 1.6 | 1.6% |
|---|---|---|---|---|---|---|---|---|---|---|---|---|---|
| Institutional | 210 | 200 | 95.24 | 194 | 92.38 | 159 | 75.71 | 78 | 37.14 | 171 | 81.43 | 145 | 69.05 |
| Government agency | 16 | 13 | 81.25 | 13 | 81.25 | 9 | 56.25 | 3 | 18.75 | 12 | 75.00 | 9 | 56.25 |
| Research centre | 13 | 13 | 100 | 13 | 100 | 11 | 84.62 | 3 | 23.08 | 11 | 84.62 | 8 | 61.54 |
| National Research Council | 2 | 0 | 0.00 | 2 | 100 | 0 | 0.00 | 0 | 0.00 | 2 | 100 | 2 | 100 |
| University | 179 | 174 | 97.21 | 166 | 92.74 | 139 | 77.65 | 72 | 40.22 | 146 | 81.56 | 126 | 70.39 |
| Society/association, professional society | 33 | 30 | 90.91 | 29 | 87.88 | 23 | 69.70 | 13 | 39.39 | 26 | 78.79 | 22 | 66.67 |
| Association | 21 | 20 | 95.24 | 20 | 95.24 | 15 | 71.43 | 8 | 38.10 | 18 | 85.71 | 16 | 76.19 |
| Professional society | 2 | 2 | 100 | 0 | 0.00 | 1 | 50.00 | 1 | 50.00 | 2 | 100 | 2 | 100 |
| Foundation | 5 | 5 | 100 | 5 | 100 | 5 | 100 | 3 | 60.00 | 3 | 60.00 | 3 | 60.00 |
| Scientific society | 5 | 3 | 60.00 | 4 | 80.00 | 2 | 40.00 | 1 | 20.00 | 3 | 60.00 | 1 | 20.00 |
| Commercial publisher | 11 | 10 | 90.91 | 10 | 90.91 | 7 | 63.64 | 3 | 27.27 | 7 | 63.64 | 5 | 45.45 |
| Total | 254 | 240 | 94.49 | 233 | 91.73 | 189 | 74.41 | 94 | 37.01 | 204 | 80.31 | 172 | 67.72 |
Classification by subject area shows that Geography journals have high indicator compliance percentages, as do Natural Sciences, Literature and Fine Arts. Although behaviour patterns do not appear to differ considerably between subject areas, there are some indicators (like 1.1, 1.2 and 1.6) where statistical tests show an association between the variables and the subject area (Table 3).
Table 3. Indicator compliance percentage by journal subject area. |
| Subject area | Total | 1.1* | 1.1%* | 1.2* | 1.2*% | 1.3 | 1.3% | 1.4 | 1.4% | 1.5 | 1.5% | 1.6 | 1.6*% |
|---|---|---|---|---|---|---|---|---|---|---|---|---|---|
| Archaeology, Anthropology and Ethnography | 18 | 15 | 83.33 | 13 | 72.22 | 12 | 66.67 | 4 | 22.22 | 13 | 72.22 | 9 | 50.00 |
| Fine Arts | 19 | 28 | 65.55 | 27 | 93.10 | 26 | 89.66 | 13 | 44.83 | 22 | 75.86 | 22 | 75.86 |
| Biomedical Sciences | 11 | 9 | 81.82 | 11 | 100 | 8 | 72.73 | 3 | 27.27 | 10 | 90.91 | 7 | 63.64 |
| Education Sciences | 34 | 34 | 100 | 30 | 88.24 | 25 | 73.53 | 18 | 52.94 | 29 | 85.29 | 23 | 67.65 |
| Natural Sciences | 6 | 6 | 100 | 5 | 83.33 | 4 | 66.67 | 3 | 50.00 | 6 | 100 | 5 | 83.33 |
| Legal Sciences | 31 | 27 | 87.10 | 30 | 96.77 | 22 | 70.97 | 4 | 12.90 | 18 | 58.06 | 12 | 38.71 |
| Political Sciences and Sociology | 31 | 30 | 96.77 | 31 | 100 | 23 | 74.19 | 13 | 41.94 | 26 | 83.87 | 25 | 80.65 |
| Communication, Information and Scientific Documentation | 21 | 21 | 100 | 19 | 90.48 | 17 | 80.95 | 6 | 28.57 | 18 | 85.71 | 18 | 85.71 |
| Economics | 16 | 16 | 100 | 15 | 93.75 | 11 | 68.75 | 8 | 50.00 | 13 | 81.25 | 13 | 81.25 |
| Philosophy | 15 | 14 | 93.33 | 15 | 100 | 11 | 73.33 | 6 | 40.00 | 12 | 80.00 | 10 | 66.67 |
| Geography | 8 | 8 | 100 | 8 | 100 | 5 | 62.50 | 5 | 32.50 | 7 | 87.50 | 8 | 100 |
| History | 41 | 39 | 95.12 | 34 | 82.93 | 25 | 60.98 | 12 | 29.27 | 30 | 73.17 | 25 | 60.98 |
| Engineering and Architecture | 15 | 14 | 93.33 | 11 | 73.33 | 8 | 53.33 | 9 | 60.00 | 14 | 93.33 | 13 | 86.67 |
| Linguistics | 32 | 32 | 100 | 31 | 96.88 | 26 | 81.25 | 11 | 34.38 | 27 | 84.38 | 23 | 71.88 |
| Literature | 34 | 34 | 100 | 34 | 100 | 28 | 82.35 | 13 | 38.24 | 28 | 82.35 | 25 | 73.53 |
| Psychology | 12 | 10 | 83.33 | 11 | 91.97 | 9 | 75.00 | 5 | 41.67 | 12 | 100 | 7 | 58.33 |
| Total | 354 | 337 | 95.20 | 325 | 91.81 | 260 | 73.45 | 133 | 37.57 | 285 | 80.51 | 245 | 69.21 |
Note: The sum of journals by area is greater than 254, because there are journals classified into more than one subject area. An asterisk (*) marks the indicators where there is a significant association between variables (p-value<0.05). |
3.2 Openness and reproducibility
The most widespread openness indicator is indicator 2.1 (publish open access contents), with a compliance rate of nearly 94%. However, other indicators, like 2.2 (encourage authors to deposit supplementary materials), 2.3 (associate articles with their supplementary materials), 2.5 (allow open peer review) and 2.6 (have a metadata transfer protocol) display a very low application rate amongst Spanish journals, especially the open peer review indicator, which is applied at 0.38% of journals (Figure 2).
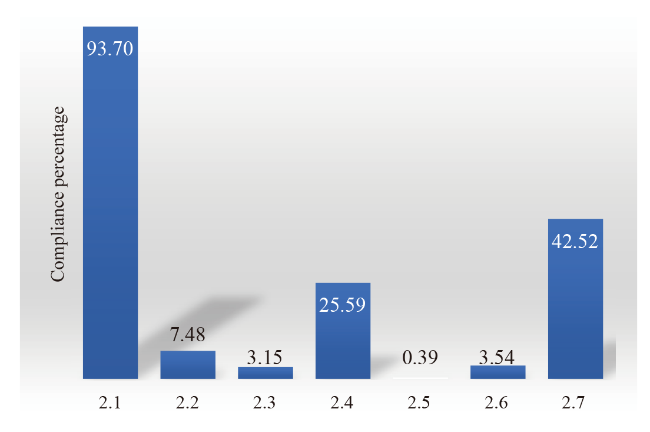
Figure 2. Openness and reproducibility indicators. |
Table 4 shows that compliance with indicator 2.1 (publish open access contents) is high in institutional journals. The rate is somewhat lower in journals published by societies/associations, especially journals printed by professional societies (although there are only two such journals). Commercial journals have lower rates of observance of this indicator also. However, indicator 2.6 (have a metadata transfer protocol) presents a much higher compliance rate in commercial journals than in other types of publications.
Table 4. Indicator compliance percentage by journal publisher type. |
| Institution type | Total | 2.1* | 2.1*% | 2.2 | 2.2% | 2.3 | 2.3% | 2.4 | 2.4% | 2.5 | 2.5% | 2.6* | 2.6*% | 2.7 | 2.7% |
|---|---|---|---|---|---|---|---|---|---|---|---|---|---|---|---|
| Institutional | 210 | 200 | 95.24 | 5 | 2.38 | 8 | 3.81 | 53 | 25.24 | 1 | 0.48 | 7 | 3.33 | 93 | 44.29 |
| Government agency | 16 | 14 | 87.50 | 2 | 12.50 | 1 | 6.25 | 2 | 12.50 | 0 | 0.00 | 1 | 6.25 | 7 | 43.75 |
| Research centre | 13 | 12 | 92.31 | 3 | 23.08 | 3 | 23.08 | 5 | 38.46 | 0 | 0.00 | 1 | 7.69 | 4 | 30.77 |
| National Research Council | 2 | 2 | 100 | 0 | 0.00 | 0 | 0.00 | 0 | 0.00 | 0 | 0.00 | 0 | 0.00 | 0 | 0.00 |
| University | 179 | 172 | 96.09 | 0 | 0.00 | 4 | 2.23 | 46 | 25.70 | 1 | 0.56 | 5 | 2.79 | 82 | 45.81 |
| Society/association, professional society | 33 | 30 | 90.91 | 13 | 39.39 | 0 | 0.00 | 9 | 27.27 | 0 | 0.00 | 0 | 0.00 | 9 | 27.27 |
| Association | 21 | 20 | 95.24 | 3 | 14.29 | 0 | 0.00 | 7 | 33.33 | 0 | 0.00 | 0 | 0.00 | 6 | 28.57 |
| Professional society | 2 | 1 | 50.00 | 0 | 0.00 | 0 | 0.00 | 1 | 50.00 | 0 | 0.00 | 0 | 0.00 | 0 | 0.00 |
| Foundation | 5 | 5 | 100 | 0 | 0.00 | 0 | 0.00 | 1 | 20.00 | 0 | 0.00 | 0 | 0.00 | 3 | 60.00 |
| Scientific society | 5 | 4 | 80.00 | 10 | 0.00 | 0 | 0.00 | 0 | 0.00 | 0 | 0.00 | 0 | 0.00 | 0 | 0.00 |
| Commercial publisher | 11 | 8 | 72.73 | 1 | 9.09 | 0 | 0.00 | 3 | 27.27 | 0 | 0.00 | 2 | 18.18 | 6 | 54.55 |
| Total | 254 | 238 | 93.70 | 19 | 7.48 | 8 | 3.15 | 65 | 25.59 | 1 | 0.39 | 9 | 3.54 | 108 | 42.52 |
An asterisk (*) marks the indicators where there is a significant association between variables (p-value<0.05). |
Statistical testing shows that there is an association between the variables and institution type for indicators 2.1 and 2.6 (Table 4).
Looking at journals by subject area, it is found that journals on Communication, Information and Scientific Documentation display the highest indicator compliance percentages. Journals on Fine Arts, Education Science and Biomedical Sciences are also strongly compliant. Statistical testing shows that there is an association between the variables and the subject area only for indicator 2.6 (have a metadata transfer protocol), which seems especially important for journals about Communication and Natural Sciences (Table 5).
Table 5. Indicator compliance percentage by journal subject area. |
| Subject area | Total | 2.1 | 2.1% | 2.2 | 2.2% | 2.3 | 2.3% | 2.4 | 2.4% | 2.5 | 2.5% | 2.6* | 2.6*% | 2.7 | 2.7% |
|---|---|---|---|---|---|---|---|---|---|---|---|---|---|---|---|
| Archaeology, Anthropology and Ethnography | 18 | 16 | 88.89 | 2 | 11.11 | 1 | 5.56 | 5 | 27.78 | 0 | 0.00 | 1 | 5.56 | 3 | 16.67 |
| Fine Arts | 19 | 28 | 96.55 | 2 | 6.90 | 1 | 3.45 | 9 | 31.03 | 0 | 0.00 | 0 | 0.00 | 17 | 58.62 |
| Biomedical Sciences | 11 | 9 | 81.82 | 2 | 18.18 | 0 | 0.00 | 5 | 45.45 | 0 | 0.00 | 1 | 9.09 | 4 | 36.36 |
| Education Sciences | 34 | 33 | 97.06 | 3 | 8.82 | 1 | 2.94 | 11 | 32.35 | 0 | 0.00 | 1 | 2.94 | 17 | 50.00 |
| Natural Sciences | 6 | 6 | 100 | 0 | 0.00 | 0 | 0.00 | 0 | 0.00 | 0 | 0.00 | 1 | 16.67 | 2 | 33.33 |
| Legal Sciences | 31 | 26 | 83.87 | 1 | 3.23 | 1 | 3.23 | 8 | 25.81 | 0 | 0.00 | 0 | 0.00 | 10 | 32.26 |
| Political Sciences and Sociology | 31 | 31 | 100 | 1 | 3.23 | 0 | 0.00 | 6 | 19.35 | 0 | 0.00 | 0 | 0.00 | 10 | 32.26 |
| Communication, Information and Scientific Documentation | 21 | 21 | 100 | 3 | 14.29 | 2 | 9.52 | 8 | 38.10 | 0 | 0.00 | 4 | 19.05 | 11 | 52.38 |
| Economics | 16 | 16 | 100 | 3 | 18.75 | 1 | 6.25 | 3 | 18.75 | 0 | 0.00 | 1 | 6.25 | 7 | 43.75 |
| Philosophy | 15 | 13 | 86.67 | 1 | 6.67 | 1 | 6.67 | 3 | 20.00 | 0 | 0.00 | 1 | 6.67 | 7 | 46.67 |
| Geography | 8 | 8 | 100 | 0 | 0.00 | 0 | 0.00 | 3 | 37.50 | 0 | 0.00 | 0 | 0.00 | 3 | 37.50 |
| History | 41 | 37 | 90.24 | 3 | 7.32 | 3 | 7.32 | 8 | 19.51 | 1 | 2.44 | 3 | 7.32 | 22 | 53.66 |
| Engineering and Architecture | 15 | 15 | 100 | 0 | 0.00 | 0 | 0.00 | 3 | 20.00 | 0 | 0.00 | 0 | 0.00 | 6 | 40.00 |
| Linguistics | 32 | 29 | 90.63 | 2 | 6.25 | 0 | 0.00 | 8 | 25.00 | 0 | 0.00 | 0 | 0.00 | 13 | 40.63 |
| Literature | 34 | 33 | 97.06 | 3 | 8.82 | 0 | 0.00 | 8 | 23.53 | 0 | 0.00 | 0 | 0.00 | 15 | 44.12 |
| Psychology | 12 | 11 | 91.67 | 1 | 8.33 | 0 | 0.00 | 5 | 41.67 | 0 | 0.00 | 0 | 0.00 | 4 | 33.33 |
| Total | 354 | 332 | 93.79 | 27 | 7.63 | 11 | 3.11 | 93 | 26.27 | 1 | 0.28 | 13 | 3.67 | 151 | 42.66 |
An asterisk (*) marks the indicators where there is a significant association between variables (p-value <0.05) |
3.3 Overall view of open science in the Spanish context
Following on the separate analyses of the two dimensions of the study, the dimensions can now be addressed jointly to gain an overall view of what open science is like in Spain.
Figure 3 shows that half the journals (47.64%) satisfy seven or more indicators, and under 15% of the journals satisfy fewer than five indicators. Overall, these are positive results.
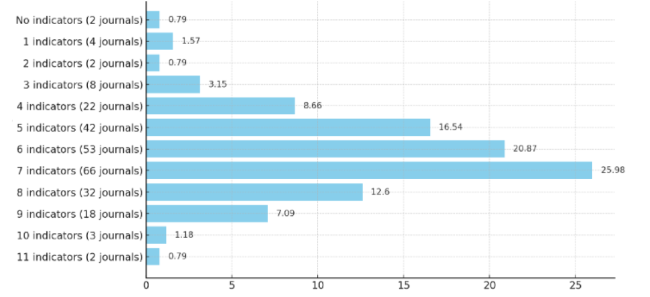
Figure 3. Percentage of journals that comply with a given number of indicators (n=254). |
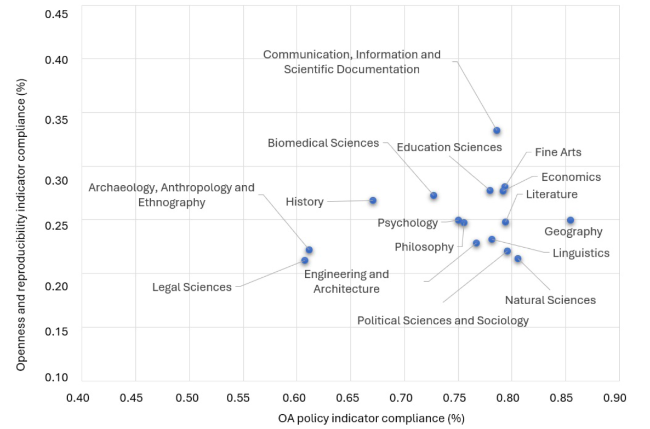
Figures 4 and 5 present the journals’ indicator compliance percentages in both dimensions, classified by entity type and subject area. The journals published by universities, associations, foundations, think tanks and institutes are highly compliant, while the National Research Council’s journals display a very low overall compliance rate. Furthermore, the results by entity type are less scattered than the results by subject area. The subject areas with the best results are Communication, Information and Scientific Documentation, Education Sciences, Fine Arts, Economics, Literature and Geography. At the other end of the scale, the poorest results belong to the Archaeology, Anthropology and Ethnography journals and the Legal Sciences journals.
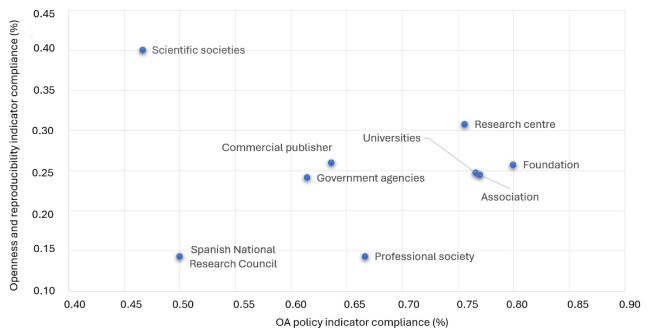
Figure 4. Percentage of indicators satisfied by journals of each publisher type in the two dimensions. |
Figure 5. Percentage of indicators satisfied by journals in each subject area in the two dimensions. |
4 Discussion and conclusions
This study offers a broad overview of the current landscape of open science implementation in Spanish scientific journals. It reveals a mixed picture, where notable progress coexists with persistent challenges. Open science has become a foundational framework for democratising knowledge and promoting interdisciplinary collaboration. In Spain, regulatory initiatives—such as the National Strategy for Open Science (ENCA)—have significantly driven its adoption. However, findings from this study could be that, while many journals have embraced open access practices, other essential aspects of open science, including open peer review and repository integration, remain underdeveloped. This partial implementation appears to be more a response to regulatory compliance than a reflection of deep structural or cultural change in scholarly publishing.
This analysis reveals a strong commitment among Spanish scientific journals to fundamental transparency practices in open access policies across both dimensions of the study. Notably, 94.49% of journals specify open access licences, and 91.73% clearly state the ownership of intellectual property rights—figures that align with previous studies based on publisher surveys (Abadal et al., 2023). These numbers place Spain ahead of countries such as Norway and Finland, where open access rates range between 64% and 70% (Sanz-Casado et al., 2021). However, the scope of open science extends beyond access to content, encompassing data openness, reproducibility, and inclusive participation—dimensions that require sustained investment in infrastructure, training, and editorial processes. The results suggest that such investments remain limited in the Spanish context.
While the indicators employed in this study provide a comprehensive overview of the current state of open science implementation, they also expose key areas of weakness. The adoption of more advanced practices—such as open peer review (0.39%), linking articles to supplementary materials (3.15%), and the implementation of metadata transfer protocols (3.54%)—remains notably low. These practices are essential for enhancing transparency and reproducibility in research, yet appear to lack the institutional support and incentives needed for their widespread uptake.
Moreover, the results highlight a clear gap between compliance with transparency-related indicators and those associated with openness. While basic practices such as licence specification are widely adopted, other elements—such as data sharing and preprint policies—remain relatively uncommon. These trends are consistent with findings from the Dulcinea directory, where only 2% of journals reported having open peer review systems, 15% permitted preprint archiving, and 16% had data availability policies (Abadal et al., 2023).
The analysis by institutional type and thematic area further illustrates the uneven implementation of open science practices. In the dimension of transparency in content access and reuse, no significant differences were observed across institutional types, suggesting a generalised adherence to open access policies. However, thematic differences were found in areas such as licence specification, clarity of intellectual property rights, and DOAJ registration, reflecting the influence of discipline-specific publishing norms. In the dimension of research data openness and reuse, institutional type was significantly associated with more advanced practices, including encouraging the deposit of supplementary materials, using open licences, and implementing metadata transfer protocols. Thematic variation was more limited and primarily observed in the latter indicator.
Although Spanish journals have made notable progress in adopting basic open access policies, the uptake of more advanced open science practices remains limited and uneven. This suggests a pattern of compliance driven primarily by regulatory demands rather than a deeper cultural shift in scholarly publishing, underscoring the need for greater institutional investment and support. One illustrative case is open peer review, a key component of open science (Ross-Hellauer, 2017), aimed at enhancing transparency and inclusiveness. Yet, only 2% of journals studied by Melero et al. (2022) had adopted this model, and just 16% had data availability policies. Barriers such as citation concerns and the dominance of double-blind review—particularly in the social sciences and humanities—continue to impede adoption (Abadal & Melero, 2022). While this study does not evaluate open peer review as a model, its inclusion serves to assess the extent to which Spanish journals incorporate open science practices.
Differences between types of publishers and subject areas are also notable. Most Spanish scientific journals are institutionally affiliated, typically with universities. This contrasts with countries like Finland, where journals are largely published by academic societies, or Norway, where commercial publishers dominate (Sanz-Casado et al., 2021). Our findings show that institutional journals lead in compliance with transparency indicators—particularly licence and copyright disclosure—likely due to greater alignment with regulatory frameworks and awareness of open science principles. However, these journals struggle with more advanced practices like open peer review and data linking.
The journals published by societies and associations show strong compliance with established indicators such as open access publication, though their uptake of newer practices related to openness and reproducibility is inconsistent. Foundation-backed journals perform relatively well on technical indicators like metadata sharing. Commercial publishers display mixed performance. They excel in technical implementation—such as metadata-sharing protocols and management tools—but may prioritise financial sustainability over full adherence to open science values.
According to this classification, institutional journals benefit from an organisational structure and resource infrastructure that favour compliance with open science policies, but they often lack the necessary incentives to implement more-advanced practices. Furthermore, commercial publishers are often well-positioned for innovation in certain areas, though their overall commitment to open science is uneven. Journals from societies and associations occupy a middle ground, with their performance largely dependent on the mission and resources of their parent organisations.
When the results are analysed by subject areas, differentiated patterns come to light. Journals in Natural Sciences and Geography display high compliance with transparency indicators—particularly licence disclosure and copyright clarity—demonstrating a strong commitment to open access. However, their adoption of openness and reproducibility practices, such as open peer review, remains limited.
Journals in Biomedical Sciences and the Arts show better engagement with open access but face challenges with metadata-sharing protocols. In contrast, Social Sciences and Humanities journals exhibit uneven compliance: while transparency indicators are generally met, practices related to reproducibility and supplementary material sharing are less frequently implemented. This may reflect the traditionally conservative and less digitised nature of these disciplines.
The strong focus on open access transparency likely reflects compliance with national legislation, such as Article 37 of the 2011 Spanish Science Act. In contrast, the limited uptake of openness and reproducibility indicators may be attributed to their more recent inclusion in legal frameworks.
This study reveals that, although Spanish scientific journals have made progress in essential aspects of open science, like licence and copyright transparency, their implementation of more-advanced practices remains limited. In this sense, other research shows that, although different collectives (like researchers, librarians and journal editors) perceive clear benefits in the implementation of open science, they are aware that it entails a number of challenges that have to be addressed, like the systemic competition of the big publishing houses and the sustainability of journals that choose to use diamond open access (Abadal et al., 2023).
The conclusions of this study suggest several lines of action:
- Training programmes could be developed for editors and authors to publicise the benefits of including open science elements like open peer review, supplementary data linking and depositing in repositories.
- Journals could be offered incentives for adopting the principles of open science, through the promotion of collaboration between institutions and publishers that facilitate agreements to work on sustainable models of open access sharing infrastructure, or through the creation of common standards that enable greater interoperability and dissemination of scientific knowledge.
- Any initiatives ought to be tailored to the particular needs of each subject area, to foster a more-inclusive, fairer focus that guarantees that all disciplines benefit from open science.
In short, advancing toward a more-open, more-transparent, more-reproducible scientific ecosystem requires a combination of political will, adequate resources and a cultural shift in editorial practices. This study provides a solid foundation for guiding future strategies in this direction.
Acknowledgements
The authors would like to acknowledge Pilar Rico and Virginia de Pablo from FECYT and the 2023 FECYT Scientific Journal Assessment Committee. The authors would also like to acknowledge funding from the Spanish Ministry of Science, Innovation and Universities for project PID2023-149340OB-I00, “Ciencia abierta y ciencia ciudadana para una sociedad más sostenible e inclusiva: aportaciones del Sistema Universitario Español”.
Author contributions
María Ángeles Coslado (mangeles.coslado@fecyt.es): Conceptualization (Equal), Data curation (Equal), Formal analysis (Equal), Funding acquisition (Equal), Investigation (Equal), Methodology (Equal), Project administration (Equal), Writing - original draft (Equal), Writing - review & editing (Equal);
Daniela De Filippo (daniela.defilippo@cchs.csic.es): Conceptualization (Equal), Data curation (Equal), Formal analysis (Equal), Funding acquisition (Equal), Investigation (Equal), Methodology (Equal), Project administration (Equal), Writing - original draft (Equal), Writing - review & editing (Equal);
Elías Sanz-Casado (elias@bib.uc3m.es): Conceptualization (Equal), Data curation (Equal), Formal analysis (Equal), Funding acquisition (Equal), Investigation (Equal), Methodology (Equal), Project administration (Equal), Writing - original draft (Equal), Writing - review & editing (Equal).
Supplementary materials
Appendix is access at 10.57760/sciencedb.27766