

1 Introduction
Publicly listed companies play a crucial role in the market economy, as their financial health directly affects economic stability. However, the frequent occurrence of financial fraud among Chinese firms has raised significant concerns (Sun et al., 2017; Wu & Du, 2022). Traditional financial fraud detection methods struggle to keep up with the increasing complexity of market data, presenting challenges for regulators.
Machine learning (ML) offers high predictive accuracy and the ability to adapt to various data types; however, its black-box nature hinders practical adoption (Ashtiaini & Raahemi, 2021; Fukas et al., 2022). While much of the research emphasizes enhancing model performance, the interpretability of predictors has received less attention. Moreover, integrating non-financial data, such as corporate annual reports, financial news, and stock commentaries, with structured financial metrics is an emerging area, particularly in leveraging semantic features derived from textual data.
In this study, we aimed to fill existing gaps by using large Language Models (LLMs) and interpretable machine learning. We applied a generative AI model to extract features from the companies’ annual reports and combined them with financial indicators to create a fraud detection framework. This approach uncovers the links between disclosed information and fraudulent behavior, offering new insights for big financial data applications.
2 Literature review
2.1 Indicators for corporate financial fraud detection
Prior research has established a comprehensive indicator system for corporate financial fraud detection. Early studies focused on financial metrics, including profitability, solvency, growth capability, operational efficiency, and cash flow performance (Ashtiaini & Raahemi, 2021; Kirkos et al., 2007). However, as market complexity and the sophistication of fraud increased, reliance solely on financial indicators became inadequate for identifying risks. Subsequent research expanded the scope to include non-financial factors, such as corporate governance attributes—like firm size, board structure, and executive characteristics—to assess the quality of internal controls (Qian & Luo, 2015; Xiong & Zhang, 2016). Notably, Liu et al. (2022) identified the shareholding ratio of major shareholders as a significant early warning signal for fraud in China market.
As the primary medium for corporate disclosure, annual reports serve as a critical resource for assessing financial risks and have gained prominence in fraud detection research. Recent studies indicate that fraudulent firms often employ a dual-dimensional fraud strategy, manipulating financial data and textual content in reports. For instance, Tan and Wang (2022) found that high-risk firms tend to use excessively optimistic language to conceal violations, while Wang et al. (2018) demonstrated a significant negative correlation between firm performance and report readability, suggesting that management may obscure financial issues through complex text. Zhang et al. (2024) further validated the predictive power of readability, showing that incorporating multi-level readability vectors improved model performance by 26.33% in the F1-score.
Beyond tone and readability, researchers have analyzed the substantive content of annual reports. Brown et al. (2020) and Craja et al. (2020) extracted direct fraud signals from textual disclosures, whereas Wu and Du (2022) leveraged LSTM-based models to achieve 94.98% prediction accuracy using features derived from the Management Discussion & Analysis (MD&A) section. Bhattacharya and Mickovic (2024) fine-tuned BERT for SEC 10-K reports, outperforming traditional models. Liu et al. (2025) further integrated latent semantic features with accounting data, confirming both the standalone predictive value of text and the advantages of multi-dimensional data fusion.
2.2 Financial fraud prediction methods
Current corporate financial fraud prediction methods primarily fall into statistical models, machine learning, and deep learning. Logistic regression (LR), as a classical statistical approach, provides both predictive capability and interpretability, though its linearity assumption constrains its ability to capture complex nonlinear relationships. ML methods, conversely, excel in modeling intricate patterns. Hajek and Henriques (2017) demonstrated the superior performance of ensemble tree learning models (e.g., Random Forest, XGBoost, LightGBM) in fraud detection. Ali et al. (2023) achieved 96.05% accuracy through XGBoost optimization, while Zhao and Bai (2022) confirmed the advantages of hybrid models combining LR with XGBoost. Yadav (2017) employed deep learning for unstructured data analysis, developing an optimized Deep Neural Network (DNN) model using text feature engineering techniques (e.g., Count Vectorizer, TF-IDF, Word2Vec) that attained 95% accuracy. However, two major challenges remain unresolved. First, the black-box nature of complex models prioritizes performance over interpretability, hindering practical deployment due to opaque decision-making processes. Second, ensemble learning algorithms predominantly depend on structured financial data (Ali et al., 2023), with limited exploration of unstructured textual features from the annual reports (Liu et al., 2025).
Recent Natural Language Processing (NLP) advances have enabled novel fraud prediction approaches through deep learning-based text analysis. In semantic feature extraction, Wu and Du (2022) utilized word embedding techniques to construct text vectors from MD&A sections in Chinese corporate annual reports, predicting fraud via a deep learning (DL) framework. Craja et al. (2020) employed hierarchical attention networks to extract semantic features while incorporating tonal analysis for risk assessment. For pre-trained language models, Bhattacharya and Mickovic (2024) fine-tuned BERT on MD&A texts from 10-K reports, improving accounting fraud detection by 15% and 12% over traditional text and quantitative models, respectively, demonstrating the promise of LLMs. Regarding interpretability, Wang et al. (2022) proposed a multimodal fraud prediction model integrating textual data and financial indicators, using attention mechanisms to elucidate the contribution of different data types to fraud risk.
Collectively, these studies overcome the limitations of traditional financial metrics by extracting semantic features and sentiment signals from textual data, thereby enriching the feature space and advancing fraud prediction methodologies.
2.3 Critical review
In summary, research on financial fraud prediction is advancing toward multimodal fusion, enhanced interpretability, and domain-adaptive modeling. Despite progress, new challenges persist with the proliferation of data and technological advancements. First, studies on multimodal data fusion remain limited, with insufficient exploration of feature clustering effects. Second, the black-box nature of ML models restricts practical application, as current research prioritizes accuracy over analyzing the mechanisms of predictive factors. Third, lengthy annual reports hinder comprehensive semantic feature extraction, with existing methods relying on truncation or localized features, failing to leverage full-text content. To address these gaps in the study, we integrate large language models, multimodal fusion, and interpretable machine learning to enhance prediction accuracy while identifying key fraud risk indicators. Our approach aligns with mainstream deep learning trends and tackles long-text semantic modeling and model interpretability challenges, offering methodological innovations for next-generation fraud detection systems.
3 Research design
3.1 Research framework
In the study, we developed a corporate fraud prediction model merging multimodal data, including financial metrics, governance structures, and annual reports. Structured financial and governance data are supplemented with textual features extracted from the annual reports using LLMs to enhance predictive performance through multimodal fusion. The framework is designed to quantify feature impacts via interpretable machine learning methods, thereby elucidating model decision-making mechanisms to support regulatory decision-making.
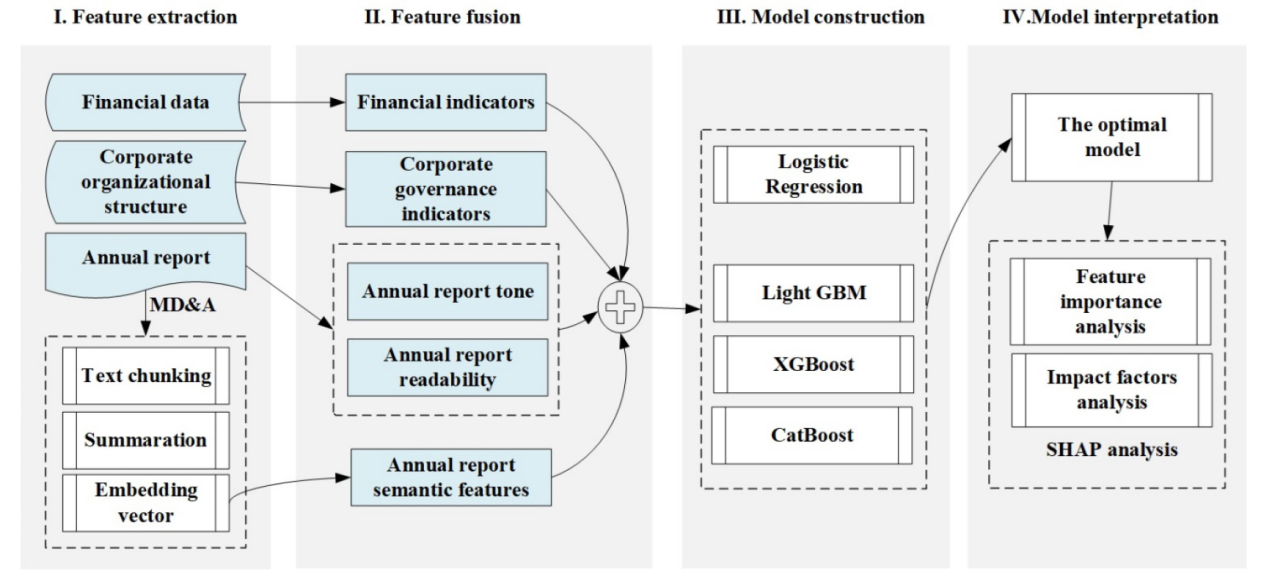
The workflow comprises four phases (Fig. 1). Phase I involves feature extraction: Financial and governance indicators are sourced from the China Stock Market & Accounting Research (CSMAR) ① database, while the annual reports are parsed via LLMs to derive features, including tone, readability, and semantic. Phase II-III focuses on multimodal feature fusion and model optimization. Ensemble tree models (LightGBM, XGBoost, CatBoost) are employed for training, hyperparameter tuning, and feature selection to identify the optimal predictive model. Phase IV utilizes SHAP analysis (Shapley, 1953) to interpret feature importance, analyze risk correlations, and validate experimental outcomes.
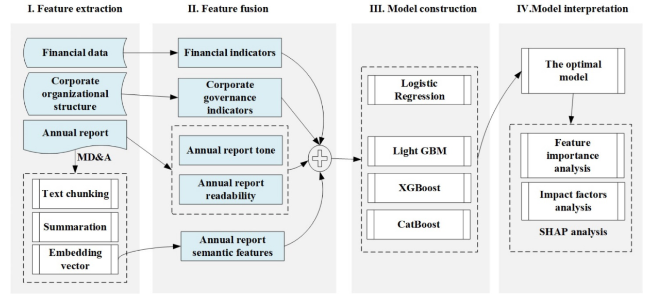
Figure 1. Research framework for financial fraud detection. |
3.2 Annual report feature extraction
3.2.1 Semantic features
We utilized the Doubao LLMs from ByteDance’s Volcano Ark platform to develop a semantic feature extraction framework for processing the full text of annual reports. The framework comprises four sequential steps (Fig. 2): text chunking, chunk summarization, full-text summarization, and embedding vector generation.
Figure 2. Annual report semantic feature extraction framework. |
Given the typical length of annual reports (exceeding 30,000 characters for MD&A in our corpus), the original text is first segmented into 1,024-character chunks to preserve contextual semantics. Each chunk is processed via the Doubao-pro-32k_v241215 model to generate localized summaries (prompt templates detailed in Table 1). These chunk summaries are then joined and input into the same model to produce a consolidated full-text summary, which distills the key content of the MD&A with logical coherence and linguistic fluency. Finally, semantic embeddings are derived from the full-text summary using the Doubao-embedding_v240715 model. Table 1 specifies the LLM configurations and prompt engineering strategies for the summarization and embedding task.
Table 1. Semantic feature extraction based on the Doubao LLMs. |
| LLM | Prompt | Input | Output |
|---|---|---|---|
| Doubao-pro-32k_v241215 General Model | You are an outstanding natural language processing assistant. Please summarize the input text, ensuring that no critical information is lost or misrepresented. The summary should be fluent, logically clear, and complete and not exceed 256 characters. | Chunked text from MA&A (Original text) | Chunked text summary |
| Doubao-pro-32k _v241215 General Model | You are an outstanding natural language processing assistant. Please summarize the input text, ensuring that no critical information is lost or misrepresented. The summary should be fluent, logically clear, and complete and not exceed 1024 characters. | Joined summaries of chunked text | Full-text summary |
| Doubao-embedding _v240715 Embedding Vector Model | None | Full-text summary | Embedding Vector |
3.2.2 Tone of the annual report
Textual sentiment features, defined as tone, are quantified through two indicators: full-text tone and MD&A-specific tone. Both metrics are sourced from the Annual Report Sentiment Database from the Chinese Research Data Services platform (CNRDS) ② . Following Zeng et al. (2018), the tone values provided by the database are computed using Equation (1), where POSword and NEGword represent the counts of positive and negative words, respectively, identified using the Loughran-McDonald (LM) Financial Sentiment Dictionary, adapted for Chinese-English financial contexts. Generally, a higher tone score indicates more optimistic management.
$\text { Tone }=\frac{\text { POSword }- \text { NEGword }}{\text { POSword }+ \text { NEGword }}$
3.2.3 Text readability
In evaluating information, text readability often reflects its complexity. Drawing from financial research (Wang et al., 2018), we propose five readability metrics:
1 Text length (Size) and Long sentence ratio (Ls). Extended text length and frequent long sentences reduce readability. Following established practices (Wang et al., 2018), Size (total character count) and Ls (proportion of sentences exceeding the average sentence length) serve as baseline readability indicators.
2 Financial term Density (Finance_density) and Obscure word density (Obscure_density). Readability correlates negatively with specialized terminology and uncommon vocabulary (Wang et al., 2018). To quantify this relationship: Finance_density measures the frequency of accounting/financial terms (e.g., 减值 impairment, 资本化 capitalization, 损益 profit and loss) per 100 characters; Obscure_density calculates the occurrence of rare characters (e.g., 棘, 淤) per 100 characters, based on the Modern Chinese Sub-Common Character List (1988). Higher values for both metrics indicate greater information complexity.
3 Transition word density (Transition_density). Transition word density refers to the frequency of transitional phrases, such as 然而 (however), 虽然 (although), and 尽管 (despite), which can increase syntactic complexity and hinder comprehension. Unlike English, which follows a more linear structure, Chinese often uses indirect expressions that can complicate interpretation. We introduce the metric of Transition_density, defined as the number of adversative conjunctions (e.g., 但是 but, 然而 however, 尽管 despite) per 100 characters. Higher values of this metric indicate reduced readability.
3.3 Research models
3.3.1 Ensemble tree-based ML algorithms
The study employed four algorithms—LR, XGBoost, LightGBM, and CatBoost—to construct corporate financial fraud detection models. LR is the baseline method due to its simplicity and strong interpretability, making it widely adopted in existing research. However, it exhibits limitations in addressing complex nonlinear problems. This study evaluates the performance of gradient-boosted decision tree (GBDT) algorithms in financial prediction tasks. According to the theoretical framework proposed by Chen and Guestrin (2016), GBDT minimizes loss functions by integrating weak learners through iterative optimization. Prior studies demonstrated that tree-based ensemble methods outperform deep neural networks in predicting structured tabular data (Lundberg et al., 2020). These advantages primarily manifest in three aspects: (1) enhanced modeling capability for nonlinear relationships and complex feature interactions, (2) improved robustness during training, and (3) superior adaptability in parameter sensitivity, computational efficiency, and missing value handling. The three GBDT variants selected in this study exhibit distinct characteristics: XGBoost enhances generalization and computational efficiency through regularization terms and parallel computing techniques; LightGBM reduces model error via histogram-based algorithms and leaf-wise growth strategies; CatBoost excels in handling categorical features while maintaining high precision and stability.
3.3.2 Interpretable ML with SHAP
The study utilizes ensemble tree algorithms to build fraud detection models and systematically applies SHAP to analyze feature importance and impact mechanisms in fraud identification. Rooted in Shapley value theory from game theory (Shapley, 1953), SHAP decomposes model predictions into weighted contributions from input features, thereby enhancing the interpretability of complex machine learning models. Under the SHAP framework, the prediction output yi for a given sample xi can be expressed as a linear combination of all feature contributions, as shown in Equation (2):
$y_{i}=y_{b a s e}+\sum_{j=1}^{M} f\left(x_{i j}\right)$
Here, ybase represents the global mean of the target variable (baseline value), xij denotes the j-th feature of sample xi, and f(xij) corresponds to the SHAP value of the feature, reflecting its marginal contribution to the prediction. A positive SHAP value indicates a promotive effect on fraud risk, while a negative value suggests an inhibitory effect. By quantifying these directional impacts, SHAP elucidates the model’s decision logic. As illustrated in Fig.3, the baseline value ybase serves as the initial reference (e.g., average predicted probability). Arrows depict deviations from this baseline, e.g. feature xi1 exerts a positive contribution (f(xi1) >0), elevating the prediction above the baseline, while xi3 exhibits a negative contribution, reducing the prediction. The final prediction results from the algebraic sum of all feature contributions. SHAP provides post-hoc explanations applicable to various machine learning algorithms, particularly excelling in interpreting nonlinear decision processes of tree-based ensemble models.
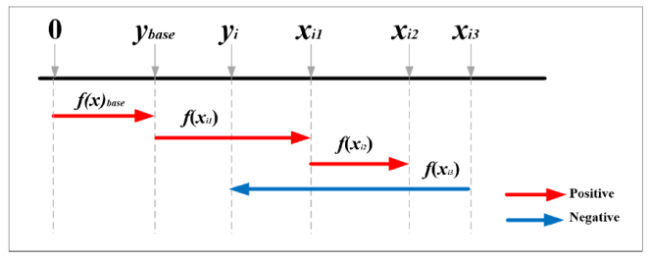
Figure 3. SHAP feature attribution diagram. |
This study’s target variable is corporate fraud risk, and three predictors are financial indicators, corporate governance features, and annual report disclosures. SHAP analysis quantifies the marginal contributions of predictors to fraud risk, identifies early-warning indicators significantly associated with fraudulent behavior, and deepens understanding of fraud mechanisms.
3.3.3 Large language models
For annual report analysis, this study employs the Doubao LLMs developed by the ByteDance Volcano Ark team ③ . Two core components are utilized: the general-purpose model (Doubao-pro-32k_v241215) and the text embedding model (Doubao-embedding_v241215). Doubao-pro-32k_v241215 generates outlines of annual report content. Optimized on the transformer architecture, it supports a context window of up to 32,000 Chinese characters, making it particularly suitable for processing lengthy texts like corporate annual reports. On the Large Language Model Evaluation Benchmark released by the Beijing Academy of Artificial Intelligence (BAAI), Doubao-pro-32k ranks first in comprehensive performance among global open-source and commercial closed-source models ④ . Through API integration, the AI-generated model successfully processed 5,304 listed companies’ MD&A sections, generating 1,024-word summaries per MD&A on average to distill critical corporate disclosures.
For feature extraction, the text embedding model Doubao-embedding _v241215 is deployed. Trained via a contrastive learning framework, it supports semantic vector representations up to 4,096 dimensions. We systematically tested four embedding dimensions (1,024, 512, 256, and 128) to obtain the best performance. The 256-dimensional representations were selected as the final features based on the validation set AUC metrics.
4 Experiments and results
4.1 Sample construction
We utilize regulatory violation records of listed companies obtained from the CSMAR database, which comprehensively covers announcements related to violations, reports from media outlets designated by the China Securities Regulatory Commission, and official notices issued by regulatory authorities on companies listed on the Shanghai and Shenzhen stock exchanges since 1994. We filtered the raw data to identify firms with confirmed violations and categorized these violations based on detailed behavioral descriptions (see Table A1 in Appendix). The analysis shows that regulatory violations are typically diverse, with most offending companies involved in multiple infractions. These violations predominantly fall into seven categories, such as delayed disclosure, false statements, and significant omissions. To align with the research focus on information disclosure—specifically regarding financial indicators and annual reports—and in accordance with the standards set by the Chinese Institute of Certified Public Accountants as well as relevant academic literature (Li et al., 2023; Zhao & Zhang, 2022), we further refine its sample by excluding cases of delayed disclosure and guarantee breaches. Consequently, only companies exhibiting fabricated profits, inflated assets, false statements, significant omissions, or misleading disclosures are classified as fraud samples. These five categories most accurately capture instances of distorted and misleading corporate information disclosure and are thus considered representative features of corporate fraud.
Furthermore, due to the distinct business models and elevated financial risk profiles of financial institutions, these firms were excluded from the analysis. As a result, the final sample consists of 1,226 companies identified as having committed financial fraud, encompassing a total of 2,652 violation records.
The control group (non-fraudulent companies) was derived from CNRDS’s ESG-R database, leveraging governance (G) metrics—particularly risk management, reporting quality, and disclosure transparency—as reliable fraud predictors (Yu et al., 2020). Environmental, Social, and Governance (ESG) ratings for all A-share firms since 2007 provided systematic screening criteria. Non-fraud firms were matched 1:1 with fraud counterparts by: (1) Year-industry alignment to control macroeconomic and sectoral biases; (2) Pristine compliance histories (zero violations during 2015-2020); (3) Exclusion of ST (special treatment) firms to eliminate accounting red flags. As a result, we obtained 2,652 rigorously matched control samples.
4.2 Feature variables
(1) Financial indicators
We utilize 19 financial metrics grouped into five categories: solvency, profitability, growth potential, operational efficiency, and cash flow adequacy (Table 2). Solvency quantifies debt default risks, profitability assesses earnings performance, growth potential reflects economic expansion trends, operational efficiency measures asset utilization rates, and cash flow adequacy evaluates liquidity management. Anomalies in these metrics—including volatility in profitability, abrupt operational efficiency shifts, or cash flow discrepancies—provide critical fraud indicators.
Table 2. Financial Indicators (19 Items). |
| Indicator Type | Indicator Variable | Variable Definition and Operation |
|---|---|---|
| Solvency | Aslbrt | Asset Liability Ratio; Total Liabilities / Total Assets |
| Curtrt | Flow Rate Ratio; Total Liability Ratio / Total Flow Asset | |
| Qikrt | Quick Ratio; (Current Assets - Inventory) / Current Liabilities | |
| Equrt | Equity Ratio; Total Liabilities /Total Shareholders’ Equity | |
| Pmcptdbrt | Long-term Debt Ratio; Total Non-flowing Debt / (Total Shareholders’ Equity +Total Non-flowing Liabilities) | |
| Profitability | Roe_1 | Return on Equity (ROE); Net Profit / Total Shareholders’ Equity |
| Salnpm | Net Profit margin, Net Profit / Revenue | |
| Salgm | Gross Profit Margin, Gross Profit / Revenue | |
| Salpm | Profit Margin, Profit / Revenue | |
| Growth Potential | Atrt | Total Assets Growth Rate; (Current Period Adjusted Figure - Prior Year Same Period Adjusted Figure)/ Prior Year Same Period Adjusted Figure for ABS |
| Opicrt | Operating Revenue Growth Rate, (Current Period Adjusted Figure - Prior Year Same Period Adjusted Figure)/ Prior Year Same Period Adjusted Figure for ABS | |
| Oirt | Operating Profit Growth Rate, (Current Period Adjusted Figure - Prior Year Same Period Adjusted Figure)/ Prior Year Same Period Adjusted Figure for ABS | |
| Operational Efficiency | Actrcbto | Accounts Receivable Turnover, Revenue /((Beginning Net Accounts Receivable + Ending Net Accounts Receivable)/2) |
| Fxastto | Fixed Asset Turnover, Total Revenue /((Beginning Fixed Assets + Ending Fixed Assets)/2) | |
| Totastto | Total Asset Turnover, Total Revenue /((Beginning Total Assets + Ending Total Assets)/2) | |
| Actpayto | Accounts Payable Turnover, Cost of Goods Sold (COGS) /((Beginning Accounts Payable + Ending Accounts Payable)/2) | |
| Dash Flow Adequacy | Opncf_rev | Net operating cash flow / Total Revenue |
| Opncfrt | Percentage of net cash flow from operating activities; Net cash flow from operating activities /(Net cash flow from operating activities + Net cash flow from investing activities + Net cash flow from financing activities) | |
| Csopindex | Cash flow to sales ratio, Net cash flow from operating activities / Cash from operations |
(2) Corporate governance indicators
Corporate governance indicators encompass ownership structure and internal executive characteristics (Table 3). Ownership structure focuses on the shareholding patterns of major shareholders. Notably, the concentration of the top five shareholders is a pivotal metric for identifying financial fraud in Chinese listed firms (Qian & Luo, 2015), while dominant ownership by the largest shareholder can effectively deter misconduct (Chen et al., 2005) by reinforcing shareholder oversight. Internal executive metrics include six indicators related to executive duality and shareholding proportions.
Table 3. Corporate Governance Indicators (11 Items). |
| Indicator Type | Indicator Variable | Variable Definition and Value |
|---|---|---|
| Ownership Structure | ShrHolder1 | First Largest Shareholder Ownership Ratio |
| ShrHolder3 | Sum of Ownership Ratios of Top Three Shareholders | |
| ShrHolder5 | Sum of Ownership Ratios of Top Five Shareholders | |
| ShrHolder10 | Sum of Ownership Ratios of Top Ten Shareholders | |
| StOwRt | State-Owned Share Ratio | |
| Internal Executive Characteristics | Cmceo_Dum | Whether serving as both Chairman and CEO (1=Yes, 0=No) |
| Cmgm_Dum | Whether serving as both Chairman and General Manager (1=Yes, 0=No) | |
| MShrRat | Management Ownership Ratio: Percentage of company shares held by management | |
| BShrRat | Board of Directors Ownership Ratio: Percentage of company shares held by all board members | |
| SShrRat | Supervisory Board Ownership Ratio: Percentage of company shares held by all supervisory board members | |
| InDrcRat | Proportion of Independent Directors: Ratio of independent directors to the total number of directors |
(3) Annual report features
Following the methodology found in Section 3.2, this study analyzes the semantic content, tone, and readability of the MD&A section of the annual report (Table 4).
Table 4. Annual report feature indicators. |
| Indicator Type | Indicator Variable | Variable Definition |
|---|---|---|
| Tone | LM_tone | Tone value of the full annual report, calculated based on the LM dictionary. |
| MDA_tone | Tone value of the annual report’s MD&A section, calculated based on the LM dictionary. | |
| Semantic Features | f1 f2 … fn | Semantic feature vector extracted from the MD&A (n-dimensional). |
| Readability | Size | Character count of the annual report’s MD&A section |
| Ls | Proportion of long sentences | |
| Finance_density | Density of financial terms: the number of financial and accounting terms per hundred characters | |
| Obscure_density | Density of rare words: the number of less frequently used Chinese words per hundred characters | |
| Transition_density | Density of adversative conjunctions: the number of Chinese adversative conjunctions per hundred characters |
4.3 Experimental design
This study employs a three-phase experimental framework to systematically evaluate the performance of a multimodal feature-based fraud prediction model.
Experiment 1: Semantic Feature Extraction and Dimensionality Optimization
Following the methodology in Section 3.2.1, we first generate executive summaries from the MD&A sections of annual reports. These summaries are subsequently encoded into dense vector representations using LLMs to capture latent semantic features. To identify the optimal embedding dimensionality, we implement a multilayer perceptron (MLP) classifier with ReLU activation and Adam optimization, comparing performance across 1024-, 512-, 256-, and 128-imensional embeddings. Model evaluation employs 5-fold cross-validation, with accuracy serving as the primary metric. The optimal dimensionality is selected based on cross-validation performance for subsequent modeling.
Experiment 2: Multimodal Feature Fusion Modeling
The integration encompasses three heterogeneous feature categories: (1) quantitative financial indicators, (2) corporate governance variables, and (3) semantic/tone/linguistic features derived from annual reports. Predictive modeling employs RL and three ensemble tree algorithms, with hyperparameters optimized through grid search. Model evaluation adopts 5-fold cross-validation, incorporating accuracy, F1score, and area under the ROC curve (AUC) as metrics. Feature subset contributions are quantified via ablation studies to determine the optimal feature combination.
Experiment 3: Model Interpretability Analysis
The optimized model undergoes SHAP-based interpretability analysis, where SHAP value computations systematically quantify how financial, governance, and textual features influence fraud probability estimates.
4.4 Experimental results
4.4.1 Semantic feature extraction based on LLM
Following the processing pipeline illustrated in Fig. 3, we analyzed 5,304 annual reports. A representative example includes the MD&A section of Zangge Holdings’ 2019 annual report (Stock Code: 000408), where Doubao LLM condensed the original 15,659-character text into a 469-character semantic summary. This resulted in a 96.6% compression rate, while preserving critical fraud-related signals (Table 5). Importantly, this demonstrates the framework’s capacity to not just condense data, but to extract actionable insights from voluminous unstructured data, enhancing its practical value.
Table 5. Sample summaries of corporate annual reports. |
| Chinese | English |
|---|---|
| 藏格控股 2019 年年度报告显示, 管理层围绕年度目标努力基本完成任务。当年钾肥生产 108.29 万吨, 营收 20.18 亿元, 净利润 3.08 亿元, 业绩下降因产品销量、价格、产量及成本、存货跌价等因素。 报告期主要工作包括推进电池级碳酸锂项目投产、改造技术工艺降成本、坚持创新发展获补助资金。多项财务数据有变动, 如营业收入合计同比减 24.70%, 销售、管理、财务、研发费用有不同变化。 研发投入大幅增长, 现金流方面各活动现金流量有升降。非主营业务投资收益为负, 还涉及资产减值、营业外收支等。资产及负债有比重增减, 获取重大股权投资, 收购西藏巨龙铜业 37%股权, 本期投资亏损 1.68 亿元。 募集资金使用有进展, 曾自筹资金投入募投项目, 2019 年募投项目结项节余补流。公司积累了经验和技术储备, 目前面临钾肥价格、新业务开拓、环保等风险, 将采取相应措施应对。还存在股份质押、业绩补偿股份回购注销风险, 补偿义务人正积极处置。 未来公司将在稳步发展氯化钾基础上开发高附加值产品, 利用老卤生产新能源材料, 开发锂系列产品, 加强技术和人才储备等。2019 年多次通过电话沟通方式接待个人咨询, 内容涉及公司多个方面情况, 多数未提供书面报告。 | The 2019 annual report of Zangge Holdings indicates that the management team largely accomplished its annual objectives. Potassium fertilizer production reached 1.0829 million tons, with revenue of 2.018 billion yuan and net profit of 308 million yuan. The decline in performance was attributed to factors such as product sales volume, price, production volume, costs, and inventory depreciation. Key initiatives during the reporting period included advancing the commissioning of the battery-grade lithium carbonate project, improving technical processes to reduce costs, and securing subsidy funds through innovation-driven development. Several financial metrics showed changes, such as a 24.70% year-on-year decrease in total operating revenue, with variations in sales, management, financial, and R&D expenses. R&D investment increased significantly, while cash flows from various activities fluctuated. Non-core business investment returns were negative, and the report also covered asset impairments, non-operating income, and expenses. Assets and liabilities experienced shifts in proportions, with significant equity investments, including the acquisition of a 37% stake in Xizang Julong Copper for a loss of 168 million yuan during the period. Progress was made in the use of raised funds, with self-raised capital allocated to fundraising projects. In 2019, surplus funds from completed fundraising projects were redirected to working capital. The company has accumulated experience and technical reserves but faces risks such as potassium fertilizer price fluctuations, new business expansion, and environmental challenges, for which corresponding measures will be implemented. Risks related to share pledges, performance compensation share repurchases, and cancellations remain, with obligors actively addressing them. Moving forward, the company will focus on developing high-value-added products based on stable potassium chloride production, utilizing brine for new energy materials, expanding lithium-based products, and strengthening technical and talent reserves. In 2019, the company responded to numerous individual inquiries via phone consultations, covering various aspects of the company, most of which did not result in written reports. |
(Company: Zangge Holdings; Year: 2019; Stock Code: 000408) |
The AI-generated summary effectively distilled the MD&A content, organizing key themes such as revenue, cash flow, investments, and future outlooks. For example, the summary highlighted critical financial data: “…with revenue of 2.018 billion yuan and net profit of 308 million yuan. The decline in performance was attributed to factors such as product sales volume, price, production volume, costs, and inventory depreciation.” Notably, these financial irregularities—declining performance, asset impairment, and investment losses—are strongly associated with elevated financial risk. This case was later confirmed by the China Securities Regulatory Commission (CSRC) as involving financial fraud, validating the predictive efficacy of the extracted features.
In subsequent experiments, we employed text embeddings generated by a large language model (LLM) to train a multilayer perceptron (MLP) classifier for detecting corporate financial fraud. Embeddings with four different dimensions (1024, 512, 256, and 128) were evaluated. As shown in Table 6, the 256-dimensional embeddings achieved the best performance, yielding an accuracy of 0.742, an F1 score of 0.733, and an AUC of 0.817. While theoretically, higher-dimensional embeddings such as the 1024-dimension may offer greater representational power, our results suggest that they are more prone to overfitting, leading to diminished performance.
Table 6. Performance comparison of financial fraud prediction models with multi-dimensional embeddings. |
| Semantic features | Dimension | Accuracy | Precision | Recall | F1 | AUC |
|---|---|---|---|---|---|---|
| Embedding vectors | 1024 | 0.732 | 0.715 | 0.693 | 0.704 | 0.811 |
| 512 | 0.732 | 0.706 | 0.714 | 0.710 | 0.805 | |
| 256 | 0.742 | 0.713 | 0.733 | 0.733 | 0.817 | |
| 128 | 0.695 | 0.656 | 0.705 | 0.679 | 0.762 |
Note: The MLP architecture in the experiment comprises an input layer matching embedding dimensions, two hidden layers progressively reducing to 128 and 64 dimensions, and a binary fraud classification output. ReLU activations between layers enhance nonlinear modeling, enabling effective capture of complex data patterns. |
To further assess model effectiveness, we included three widely-used open-source Chinese text embedding models—Text2Vec-based-Chinese, Embedding-V1, and BGE-large-zh—alongside our chosen model, and applied all four to the fraud prediction task. As presented in Table 7, the commercial embedding model from Volcano Engine consistently outperformed the open-source alternatives on our dataset. Notably, it also overcomes the 512-token sequence length limitation inherent to conventional BERT models, thus better capturing the semantics of longer texts.
Table 7. Experimental results of word embedding models (Input Dimension 256). |
| Embedding model | Introduction | Accuracy | AUC | F1 |
|---|---|---|---|---|
| Doubao-embedding _v240715 ⑤ | A high-performance text embedding model developed by ByteDance’s Volcano Engine, part of the Doubao large model ecosystem, specializing in generating high-quality semantic vectors. | 0.742 | 0.817 | 0.733 |
| Embedding-V1 ⑥ | Baidu’s general-purpose text embedding model, incorporating the company’s NLP expertise. It supports Chinese and multilingual tasks, generating high-dimensional dense vectors (1024 dimensions). | 0.738 | 0.812 | 0.715 |
| BGE-large-zh ⑦ | An open-source Chinese text embedding model from Beijing Academy of Artificial Intelligence (BAAI). Fine-tuned on RoBERTa-large architecture, it delivers excellent performance on Chinese text. | 0.739 | 0.802 | 0.709 |
| Text2Vec-base-chinese ⑧ | A classic open-source Chinese text embedding model based on transformer architecture, providing static contextual embeddings. | 0.609 | 0.642 | 0.577 |
Based on these findings, we ultimately selected the 256-dimensional Doubao-embedding_v240715 model to represent the semantics of annual reports. This choice strikes an optimal balance between effectiveness and efficiency, and is particularly advantageous for the subsequent construction of ensemble tree models.
4.4.2 Financial fraud detection using multimodal data fusion
We constructed fraud detection models using four ML models: LR as the baseline classifier and three gradient-boosted tree methods—LightGBM, XGBoost, and CatBoost. The input features comprised 36 structured variables across four categories: financial metrics (19), corporate governance indicators (11), annual report tones (2), and readability metrics (4). Model training employed grid search with 5-fold cross-validation for hyperparameter optimization, evaluated using accuracy, AUC, and F1 score.
The experimental results (Table 8) reveal that the ensemble tree algorithms outperformed the baseline LR across all metrics, with AUC scores exceeding 0.85. Among them, XGBoost exhibited the highest performance, improving AUC by 12.1%, accuracy by 10.7%, and F1 score by 11.0% compared to LR. The superior performance of ensemble trees likely stems from their ability to capture nonlinear relationships among high-dimensional features and their inherent feature importance ranking, which automatically identifies key predictors. These findings align with the prior research in financial fraud detection, further validating the advantages of ensemble learning for complex financial classification tasks.
Table 8. Comparative performance of ML algorithms in fraud setection task. |
| ML Algorithms | AUC | Accuracy | F1 |
|---|---|---|---|
| LR | 0.750 | 0.685 | 0.679 |
| LightGBM | 0.868 | 0.791 | 0.787 |
| XGBoost | 0.871 | 0.792 | 0.789 |
| CatBoost | 0.852 | 0.776 | 0.773 |
Note: Parameter settings for the models are detailed in Table A2 in Appendix. |
To investigate the contribution of individual feature categories, we further conducted an ablation study using XGBoost (the top-performing model). Starting with financial metrics as the baseline, we incrementally incorporated textual features derived from the annual report—tone (2 features), readability(4 features), and semantic (256-dimensional embedding vector)—to assess their predictive impact. The results are presented in Tables 9 and 10.
Table 9. Impact of textural features: Ablation analysis. |
| Features | AUC | ∆AUC | Accuracy | ∆Accuracy | F1 | ∆F1 |
|---|---|---|---|---|---|---|
| Financial | 0.820 | - | 0.740 | - | 0.694 | - |
| Financial+Tone | 0.828 | +0.8% | 0.749 | +0. 9% | 0.727 | +3.3% |
| Financial+Tone+Readability | 0.841 | +1.3% | 0.766 | +1.7% | 0.745 | +1.8% |
| Financial+Tone+Readability+Semantics | 0.880 | +3.9% | 0.798 | +3.2% | 0.780 | +3.5% |
Table 10. Ablation analysis on multi-feature fusion. |
| Features | AUC | ∆AUC | Accuracy | ∆Accuracy | F1 | ∆F1 |
|---|---|---|---|---|---|---|
| Financial | 0.820 | - | 0.740 | - | 0.694 | - |
| Financial + Textual | 0.880 | +6.0% | 0.798 | +5.8% | 0.780 | +8.6% |
| Financial + Textual + Corporate governance | 0.894 | +1.4% | 0.812 | +1.4% | 0.796 | +1.6% |
Table 9 demonstrates significant performance variations across feature combinations in the financial fraud prediction model. The baseline model using financial features achieved an AUC of 0.820, an accuracy of 0.740, and an F1 of 0.694. Tones enhanced performance, increasing AUC and F1 by 0.8% and 3.3%, validating sentiment’s role in fraud detection. Readability metrics improved AUC by 1.3%, underscoring text clarity’s discriminative value, while semantic features (high-dimensional embeddings from summaries) showed the greatest gain with a 3.9% AUC increase, reflecting their capacity to capture latent nuances. Integrating financial indicators with multidimensional textual features (tone, readability, semantics) produced a clear additive effect, leveraging annual reports’ informational richness to boost predictive accuracy and model robustness substantially.
The results (Table 10) revealed that multi-feature fusion significantly enhanced model performance. Using only financial features, the model achieved AUC, accuracy, and F1 of 0.820, 0.740, and 0.694, respectively. Incorporating textual features improved these metrics by 6.0%, 5.8%, and 8.6%. Further adding corporate governance features optimized performance (AUC = 0.894, accuracy = 0.812, F1 = 0.796). Although corporate governance features contributed modestly, their integration with textual features enhanced model robustness, suggesting they capture risk signals beyond annual reports. Thus, multi-feature fusion leverages complementary effects to substantially improve discriminative power.
4.4.3 Feature importance analysis
Based on SHAP analysis, this study systematically evaluated the feature-importance of the optimal XGBoost model (AUC = 0.894, accuracy = 0.812). As illustrated in Fig. 4, financial indicators demonstrate the strongest predictive power among the 296 features. Within the top 10% of important features (Top30), financial indicators accounted for 10 entries. Specifically, the accounts receivable turnover ratio (Actrcbto, reflecting operational efficiency), return on equity (Roe_1, indicating profitability), and operating profit growth rate (Oirt, representing growth capacity) ranked 1st, 2nd, and 4th in the ranking list, highlighting the dominance of financial indicators in fraud prediction.
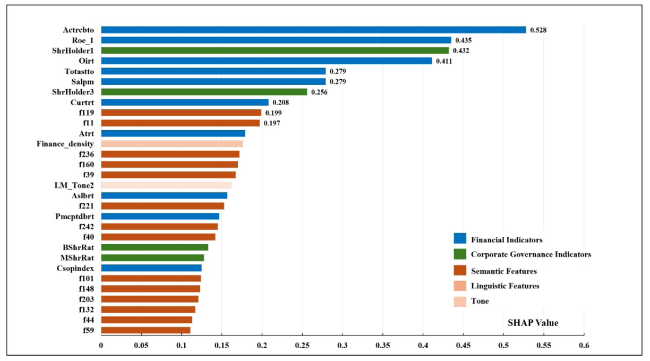
Figure 4. Feature importance analysis (Top 10% Features). |
Although fewer (4 entries within the top 10%), corporate governance metrics also exhibit notable predictive significance. Shareholding proportions of major shareholders (ShrHolder1 and ShrHolder3) ranked 3rd and 7th, while the management shareholding ratio (BShrRat) ranked 22nd, suggesting that ownership concentration and interest alignment mechanisms in governance structures significantly influence fraud risk. Textual features constitute the majority of Top30 features (16 entries), with 14 semantic features demonstrating predictive value. The f119, the highest-ranked one, placed 9th. Finance_density and LM_tone2, ranked 12th and 16th, revealing risk signals embedded in report readability and narrative tone.
The feature importance distribution indicates that while structured financial data remains central to fraud detection, textual features also provide critical supplementary information. Financial metrics capture operational anomalies, governance features reflect institutional incentives for fraud, and textual features extract risk signals from management disclosures. The synergistic integration of multidimensional features offers novel insights for developing more accurate financial fraud early-warning systems.
4.4.4 Feature impact mechanism analysis
SHAP analysis (Fig. 5) quantitatively elucidated the relationships between features and fraud risk. The beeswarm plot (Fig. 5) revealed predominantly negative associations between key features and fraud risk. For financial indicators, lower values of operational efficiency metrics (e.g., accounts receivable turnover ratio [Actrcbto] and total asset turnover ratio [Totastto]) correlated with higher risk (SHAP value > 0, blue dots area), while higher profitability metrics (e.g., return on equity [Roe_1]) concentrated in low-risk regions (SHAP value < 0, red dots area). In corporate governance, higher shareholding concentrations among major shareholders (ShrHolder1, ShrHolder3) exhibited significant risk-mitigating effects (SHAP value < 0, blue dots area). In comparison, textual features demonstrated that positive tone (LM_tone2) and higher financial terminology density (Finance_density)in management narratives correlated with reduced fraud risk. Among 14 semantic features, 9 showed risk-suppressing effects (SHAP > 0, red dots area), while 5 exhibited risk-enhancing effects (SHAP value >0, blue dots area).
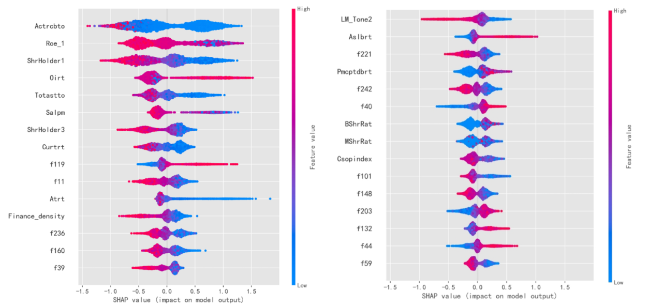
Figure 5. The relationship between Top10% important features and corporate fraud risk (Beeswarm plot). |
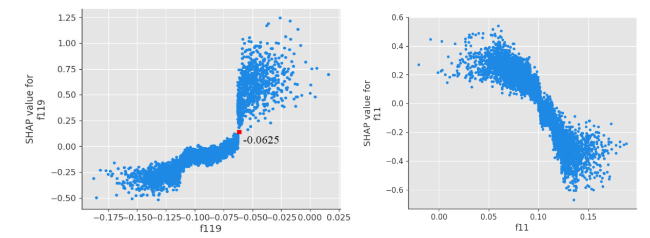
The scatter plot (Fig. 6) further reveals distinct correlation patterns among key semantic features: f119 values exceeding the -0.0625 threshold demonstrate nonlinear risk amplification, while elevated f11 levels exhibit proportional risk mitigation. These results substantiate the operational dynamics of multimodal features in fraud prediction mechanisms.
Figure 6. Relationship between annual report semantic features (f119, f11) and corporate fraud risk. |
5 Discussion
5.1 The findings
This study advances financial fraud prediction through systematic investigations of four core challenges: long-text semantic parsing, multimodal data fusion, predictive modeling, and risk feature interpretation. We find:
(1) LLM models effectively resolve long-text modeling. Using the LLM-based framework, we distilled lengthy annual reports into semantic summaries (length ≤1,024). These summaries achieved the AUC score of 0.817 in fraud detection, confirming the capacity of LLM-based AI models to extract discriminative signals from textual financial reports.
(2) Gradient-boosted tree algorithms outperformed conventional models, with AUC scores exceeding 0.850—significantly higher than the LR model (0.750). The result validates their superiority in modeling nonlinear financial relationships, aligning with prior studies (Ali et al., 2023; Hajek & Henriques, 2017; Zhao & Bai, 2022).
(3) Multimodal fusion elevated detection performance, improving AUC score by 7.4% over financial indicator-only models. Financial metrics remained foundational, while corporate governance and textual features derived from annual reports provided complementary predictive signals, demonstrating the advantages of heterogeneous data fusion.
(4) SHAP analysis elucidated multidimensional feature-risk correlations. Financial metrics still served as critical early-warning signals. Low values in operational efficiency (e.g., the accounts receivable turnover), profitability (e.g., return on equity), and growth metrics (e.g., operating profit growth rate) are strongly associated with elevated fraud risk, suggesting financial distress may incentivize fraudulent behavior. Corporate governance features exhibited dual regulatory effects. High ownership concentration (ShrHolder1 & ShrHolder3) suppressed fraud through shareholder oversight mechanisms, while excessive management ownership (BShrRat) increased risk due to incentive misalignment, aligning with Wang et al.’s (2018) agency conflict theory. The most significant finding is the patterns hidden in annual reports. For instance, the critical semantic feature f119 demonstrated a threshold effect, with values exceeding -0.0625 triggering exponential risk escalation (Fig. 6), potentially indicating targeted narrative manipulation. The negative correlation between the density of financial terms and fraud risk contradicts text complexity theories but supports our information dilution hypothesis that fraudulent firms may obscure critical details through simplified language. Additionally, sentiment analysis identified a “tone anchoring effect”: positive narratives (LM_Tone2) correlated with lower fraud risk (SHAP value = -0.18), while neutral/negative tones signaled elevated risk. These findings collectively suggest that annual reports encode behavioral traces of managerial intent. Strategic adjustments in content organization, linguistic complexity, and emotional tone may reflect concealment strategies, providing incremental predictive value beyond quantitative data.
5.2 Sensitivity to sample composition
In practical scenarios, the number of fraudulent companies is significantly lower than that of legitimate ones, presenting a considerable sample imbalance challenge in corporate fraud detection. Therefore, it is essential to implement appropriate strategies to mitigate the adverse effects of this imbalance on model performance. In this study, we analyzed a dataset containing 17,365 original instances, including 9,860 fraud cases, resulting in a fraud-to-non-fraud ratio of approximately 1:2. During the preliminary phase, we experimented with varying class ratios from 1:2 to 1:20 to assess model performance under different degrees of imbalance (see Table A3 in Appendix for details). Results showed that severe class imbalance significantly reduced model performance (e.g., AUC of 0.586 at a 1:20 ratio), while increasing the proportion of fraud samples greatly enhanced accuracy (e.g., AUC of 0.770 at a 1:2 ratio), highlighting the necessity of sufficient fraud cases for robust training. Consequently, in the main experiments, we employed an under-sampling strategy to equalize the number of fraudulent and non-fraudulent samples. This approach not only enhanced fraud detection performance but also provided a solid basis for subsequent SHAP analysis. While under-sampling is a straightforward and effective method suitable for the needs of this study, it has inherent limitations, such as the risk of underfitting and information loss. Future research could benefit from exploring additional techniques to address sample imbalance, including oversampling, ensemble learning, and cost-sensitive learning methods.
5.3 Limitations and future works
The limitations of this study inform three critical directions for subsequent research.
(1) Interpretability of semantic features: While semantic vector extraction techniques effectively capture early-warning signals of fraud in annual reports, the current model lacks an explanatory framework for interpreting critical semantic features. Future research will prioritize developing interpretable mapping mechanisms for semantic vectors and establishing correlation models between feature dimensions and actual report content to assist regulators in precisely identifying risk indicators.
(2) Granular fraud-type differentiation: Existing works primarily focus on binary fraud detection, failing to distinguish specific violation types such as disclosure inaccuracies and false documentation. Subsequent studies propose implementing multi-label classification frameworks to develop fine-grained detection models, thereby enhancing the targeting precision of regulatory investigations.
(3) Comparative validation of model efficacy: In the study, we employ generative AI models for semantic modeling of long texts, and the experimental results demonstrate clear technical advantages of this approach. As the research focuses on multimodal data integration and fraud prediction, and is constrained by computational resources and time costs, a systematic comparison of summarization performance among different LLMs has not yet been conducted. Selection of LLMs should be aligned with specific business requirements, as both commercial and open-source models present unique strengths and weaknesses. Future research will involve comprehensive experiments to quantitatively assess and compare the performance of various LLM models in practical applications.
Advancing these research priorities will systematically strengthen regulatory applications through three synergistic mechanisms. Enhanced interpretability of semantic features will improve decision-making transparency by clarifying connections between analytical outputs and textual evidence. Granular fraud-type differentiation will empower targeted audit procedures by precisely identifying specific violation patterns. Concurrently, rigorous comparative evaluations of modeling techniques will establish empirical foundations for optimal methodology selection. These coordinated advancements will collectively propel the evolution of intelligent regulatory systems, fostering robust capital market governance through adaptive analytical capabilities that address evolving financial risks.
6 Conclusion and implications
This study systematically validates the technical advantages of ensemble tree algorithms in financial fraud detection and advances multimodal data modeling research. By integrating the Doubao LLMs, we innovatively developed a three-stage feature extraction framework (“chunking-summarization-embedding,” see Fig. 1), enabling efficient distillation of lengthy annual reports and establishing a quantitative system comprising 256-dimensional semantic indicators. Through a deep fusion of textual semantic vectors with structured enterprise data in feature space, we created a collaborative analytical paradigm for multi-source heterogeneous data. Empirical findings demonstrate that: (1) Semantic features extracted solely by the LLMs achieve significant predictive power (AUC = 0.817); (2)The multimodal detection framework elevates model performance to 0.894 (AUC), representing a 19.3% improvement over traditional unimodal approaches; (3) SHAP value analysis confirms the informational value of annual reports, revealing critical fraud detection clues through linguistic patterns, tonal characteristics, and content attributes.
The research delivers dual value. The interpretable feature system technically supports regulatory agencies in developing intelligent auditing systems to enhance annual report scrutiny efficiency while reducing error rates. Theoretically, the proposed “language-psychology-behavior” tripartite analytical model offers stakeholders novel perspectives for deciphering managerial decision-making motivations. Notably, the developed semantic-enhanced evaluation model provides a quantitative tool for assessing listed companies’ information disclosure quality and enables practical implementation through its derivative real-time monitoring system. This advancement significantly strengthens capital market risk early-warning capabilities, offering actionable insights for securities regulation.
Funding information
The study was supported by the 2021 Guangdong Province (China) Science and Technology Plan Project “Research and Application of Key Technologies for Multi-level Knowledge Retrieval Based on Big Data Intelligence” (Project No. 2021B0101420004) and the 2022 commissioned project “Cross-border E-commerce Taxation and Related Research” from the State Taxation Administration Guangdong Provincial Taxation Bureau, China.
Acknowledgements
We thank the project leaders for their support during the research and acknowledge Mr. Zong-zhou Zheng’s contributions to data collection and dataset construction.
Author contributions
Hui Nie(issnh@mail.sysu.edu.cn): Formal analysis (Equal), Methodology (Equal), Project administration (Equal), Supervision (Lead), Writing - original draft (Equal), Writing - review & editing (Equal);
Zhao-hui Long (lnslzh@mail.sysu.edu.cn): Conceptualization (Equal), Funding acquisition (Equal), Investigation (Equal), Resources (Equal), Supervision (Supporting);
Ze-jun Fang (fangzj3@mail2.sysu.edu.cn): Data curation (Equal), Formal analysis (Supporting), Validation (Equal);
Lu-qiong Gao (gaolq5@mail2.sysu.edu.cn): Formal analysis (Supporting), Validation (Equal), Visualization (Equal).
Data availability statement
The associated data for this paper (DOI: 10.57760/sciencedb.23769) can be accessed in the Science Data Bank database (https://www.scidb.cn/en/s/3M7Zby).
Appendix
Table A1. Corporate fraud type frequency and incidence statistics. |
| Violation Type | Description | Count | Frequency |
|---|---|---|---|
| Delayed disclosure | Failure to disclose material information within the prescribed timeframe, violating the timely disclosure requirements under securities regulations. | 72 | 16% |
| False statement | Intentional misrepresentation or falsification of financial statements, reports, or other disclosures, including misleading statements that distort the true financial condition or operational performance of the company. | 57 | 13% |
| Significant omissions | Deliberate or negligent failure to disclose material information that could significantly impact investors’ decisions, thereby violating the principle of completeness in disclosure. | 51 | 11% |
| Inflated assets | Misstating the value or existence of assets in financial statements, including overstating asset values or recording non-existent assets. | 28 | 6% |
| Fabricated profits | Artificially inflating or fabricating profits through improper accounting practices, such as recognizing revenue prematurely or manipulating expense records. | 9 | 2% |
| Guarantee breaches | Referring to a listed company or its affiliates providing guarantees in violation of regulations or beyond authorized limits, harming the interests of the company and investors. | 8 | 2% |
| Misleading disclosures | Providing inaccurate, incomplete, or misleading information in disclosures, whether in financial reports, announcements, or other regulatory filings, which misleads investors or regulators. | 5 | 1% |
| Others | - | 78 | 17% |
Table A2. The ML models’ configuration for fraud detection. |
| Algorithms | Parameters | Value | Meaning |
|---|---|---|---|
| Logistic Regression | C | 100 | The reciprocal of regularization strength |
| max_iter | 300 | The maximum number of iterations for solver convergence. | |
| penalty | ‘l1’ | The type of regularization; ‘l1’ denotes L1 regularization. | |
| solver | ‘liblinear’ | The algorithm | |
| tol | 1.00E-06 | The error tolerance for the stopping criterion. | |
| XGBoost | subsample | 0.899 | The sample proportion per tree during training |
| n_estimators | 449 | The boosting tree count | |
| min_child_weight | 4 | The minimum child node weight fraction | |
| max_depth | 9 | The tree’s maximum depth | |
| learning_rate | 0.1 | The learning rate | |
| gamma | 0.000278 | The minimum loss reduction for node splits | |
| colsample_bytree | 0.6 | The feature proportion per tree during construction | |
| LightGBM | colsample_bytree | 0.6 | Feature proportion per tree |
| max_depth | 6 | Maximum tree depth | |
| min_child_samples | 9 | Minimum child node samples | |
| n_estimators | 280 | Number of boosting trees | |
| num_leaves | 40 | Maximum leaf nodes | |
| random_state | 0 | Random seed for reproducibility | |
| reg_alpha | 0.01 | L1 regularization coefficient | |
| reg_lambda | 0.001 | L2 regularization coefficient | |
| subsample | 0.8 | Sample proportion per tree | |
| CatBoost | subsample | 0.8 | The proportion of samples for training each tree |
| min_data_in_leaf | 1 | Minimum samples per leaf node | |
| l2_leaf_reg | 0.01 | L2 regularization coefficient | |
| learning_rate | 0.1 | Learning rate for step size control | |
| iterations | 280 | Number of boosting trees | |
| depth | 6 | Maximum tree depth | |
| colsample_bylevel | 0.8 | Feature proportion per level | |
| border_count | 40 | Number of bins for numerical features |
Table A3. Model performance under imbalanced data. |
| Fraud to Non-Fraud Sample Ratio | Accuracy | AUC | F1 | Precision | Recall |
|---|---|---|---|---|---|
| 1:1 | 0.742 | 0.817 | 0.713 | 0.713 | 0.733 |
| 1:2 | 0.732 | 0.770 | 0.568 | 0.564 | 0.571 |
| 1:5 | 0.856 | 0.755 | 0.470 | 0.511 | 0.430 |
| 1:10 | 0.819 | 0.613 | 0.222 | 0.273 | 0.188 |
| 1:20 | 0.946 | 0.586 | 0.167 | 0.273 | 0.120 |
Note: The model is an MLP Classifier with 256-dimensional annual report semantic vectors as input features.