


1 Introduction
2 Policy background, literature review, and hypothesis development
2.1 Policy background
2.2 Literature review
2.2.1 Literature related to the economic impact of open government data
2.2.2 Literature related to corporate investment
2.3 Hypothesis development
2.3.1 Open government data and corporate investment
2.3.2 The influencing mechanism of open government data on corporate investment
3 Research design
3.1 Data source and sample selection
Table 1. Sample description. |
| Panel A: Sample selection process. | |||||
|---|---|---|---|---|---|
| Initial observations of all Chinese A-share listed firms from 2007 to 2022 | 49,194 | ||||
| Less: observations pertaining to the financial industry | (1,071) | ||||
| Less: observations designated as ST, *ST, and PT firms | (1,933) | ||||
| Less: observations with firms temporarily suspended | (5) | ||||
| Less: observations with missing information on control variables | (14,901) | ||||
| Available observations | 31,284 | ||||
| Unique firms | 3,355 | ||||
| Panel B: Distribution by year. | |||||
| Year | Freq. | Percent(%) | Open | Cum.(%) | |
| 0 | 1 | ||||
| 2007 | 1,004 | 0 | 1,004 | 0 | 0.00 |
| 2008 | 1,065 | 3.4 | 1,065 | 0 | 0.00 |
| 2009 | 1,171 | 3.74 | 1,171 | 0 | 0.00 |
| 2010 | 1,233 | 3.94 | 1,233 | 0 | 0.00 |
| 2011 | 1,349 | 4.31 | 1,349 | 0 | 0.00 |
| 2012 | 1,674 | 5.35 | 1,369 | 305 | 18.22 |
| 2013 | 1,958 | 6.26 | 1,603 | 355 | 18.13 |
| 2014 | 2,037 | 6.51 | 1,653 | 384 | 18.85 |
| 2015 | 1,950 | 6.23 | 1,498 | 452 | 23.18 |
| 2016 | 2,012 | 6.43 | 1,303 | 709 | 35.24 |
| 2017 | 2,200 | 7.03 | 1,335 | 865 | 39.32 |
| 2018 | 2,342 | 7.49 | 1,038 | 1,304 | 55.68 |
| 2019 | 2,839 | 9.07 | 939 | 1,900 | 66.92 |
| 2020 | 2,809 | 8.98 | 589 | 2,220 | 79.03 |
| 2021 | 2,953 | 9.44 | 454 | 2,499 | 84.63 |
| 2022 | 2,688 | 8.59 | 340 | 2,348 | 87.35 |
| Total | 31,284 | 100 | 17,943 | 13,341 | 42.64 |
Note: This table presents the sample selection process and sample distribution. Panel A presents the sample selection process. Panel B presents the distribution of the sample by year. |
3.2 Variable definition
3.2.1 Dependent variable
3.2.2 Independent variable
3.2.3 Control variables
Table 2. Variable definitions. |
| Property of variable | Variable name | Variable symbol | Variable description |
|---|---|---|---|
| Dependent variable | corporate investment | Invest | (cash expended on the acquisition and construction of fixed assets, intangible assets, and other long-term assets - the net cash received from the disposal of fixed assets, intangible assets, and other long-term assets) / by the total assets at the beginning of the period. |
| Independent variable | Open government data | Open | Whether the city where the enterprise is located has a government data open platform |
| Control variables | Firm size | Size | The natural logarithm of total assets |
| Debt-to-asset ratio | Lev | Total liabilities/total assets | |
| Return on total assets | Roa | Net profit/total assets | |
| Operating cash flow | Cfo | Net cash flow from operating activities/total assets | |
| Age of the company | Age | The natural logarithm of listing year +1 | |
| Company growth | Growth | Revenue growth rate | |
| Equity balance degree | Balance | Shareholding ratio of the 2nd to 5th largest shareholders/shareholding ratio of the first largest shareholders | |
| independent director ratio | Independent | Number of independent directors/Number of directors | |
| Board size | Board | the natural logarithm of (number of directors + 1) | |
| Two duties in one | Dual | Whether the chairman and the If the It takes the value of 1 if chairman and the general manager are the same person, and 0 if it is not. | |
| economic development level | Lngdp | Natural logarithm of per capita GDP in cities | |
| Government revenue | lnfinance | Natural logarithm of local fiscal budget revenue |
3.3 Model design
3.4 Descriptive statistics
Table 3. Descriptive statistics. |
| Variable | N | Mean | P25 | Median | P75 | Min | SD | Max |
|---|---|---|---|---|---|---|---|---|
| Invest | 31,284 | 0.0541 | 0.0123 | 0.0343 | 0.0734 | -0.0259 | 0.0634 | 0.362 |
| Open | 31,284 | 0.426 | 0 | 0 | 1 | 0 | 0.495 | 1 |
| Size | 31,284 | 22.27 | 21.36 | 22.09 | 23.03 | 19.17 | 1.312 | 26.11 |
| Lev | 31,284 | 0.452 | 0.294 | 0.450 | 0.605 | 0.0529 | 0.203 | 0.899 |
| Roe | 31,284 | 0.0481 | 0.0234 | 0.0650 | 0.113 | -0.870 | 0.158 | 0.364 |
| Cfo | 31,284 | 0.0463 | 0.0070 | 0.0453 | 0.0869 | -0.177 | 0.0713 | 0.260 |
| Age | 31,284 | 2.335 | 1.792 | 2.398 | 2.890 | 1.099 | 0.638 | 3.367 |
| Growth | 31,284 | 0.165 | -0.0343 | 0.103 | 0.266 | -0.585 | 0.414 | 2.499 |
| Balance | 31,284 | 0.697 | 0.224 | 0.524 | 1.011 | 0.0269 | 0.601 | 2.784 |
| Independ | 31,284 | 0.374 | 0.333 | 0.333 | 0.429 | 0.300 | 0.0532 | 0.571 |
| Board | 31,284 | 2.251 | 2.079 | 2.303 | 2.303 | 1.792 | 0.181 | 2.773 |
| Dual | 31,284 | 0.246 | 0 | 0 | 0 | 0 | 0.431 | 1 |
| lngdp | 31,284 | 8.878 | 8.049 | 8.969 | 9.839 | 6.005 | 1.174 | 10.67 |
| lnfinance | 31,284 | 16.16 | 15.23 | 16.07 | 17.21 | 13.42 | 1.249 | 18.25 |
4 Empirical results and analysis
4.1 Benchmark regression analysis
Table 4. The impact of the establishment of government data open platforms on corporate investment. |
| Variable | (1) | (2) | (3) | (4) |
|---|---|---|---|---|
| Invest | Invest | Invest | Invest | |
| Open | 0.0028** | 0.0032** | 0.0032*** | 0.0030*** |
| (2.02) | (2.43) | (3.41) | (3.19) | |
| Size | 0.0126*** | 0.0126*** | 0.0128*** | |
| (10.84) | (6.30) | (5.82) | ||
| Lev | 0.0028 | 0.0036 | 0.0036 | |
| (0.58) | (0.71) | (0.63) | ||
| Roe | 0.0231*** | 0.0236*** | 0.0237*** | |
| (9.39) | (5.68) | (5.68) | ||
| Cfo | -0.0027 | -0.0035 | -0.0033 | |
| (-0.49) | (-0.41) | (-0.39) | ||
| Age | -0.0412*** | -0.0412*** | -0.0420*** | |
| (-15.06) | (-9.34) | (-9.39) | ||
| Growth | 0.0214*** | 0.0214*** | 0.0212*** | |
| (15.60) | (6.16) | (6.17) | ||
| Balance | 0.0018 | 0.0017 | 0.0020 | |
| (1.16) | (1.43) | (1.54) | ||
| Independ | -0.0189 | -0.0186* | -0.0179 | |
| (-1.48) | (-1.86) | (-1.65) | ||
| Board | -0.0029 | -0.0032 | -0.0028 | |
| (-0.58) | (-0.94) | (-0.76) | ||
| Dual | 0.0029** | 0.0029* | 0.0029* | |
| (2.16) | (1.83) | (1.76) | ||
| lngdp | 0.0070 | 0.0069 | 0.0090 | |
| (1.51) | (1.53) | (1.49) | ||
| lnfinance | -0.0076* | -0.0072 | -0.0021 | |
| (-1.95) | (-1.50) | (-0.47) | ||
| Cons | 0.0529*** | -0.0681 | -0.0720 | -0.1761*** |
| (89.95) | (-1.47) | (-1.55) | (-4.06) | |
| Firm Fixed Effects | YES | YES | YES | YES |
| Year Fixed Effects | YES | YES | YES | YES |
| Industry Fixed Effects | NO | NO | YES | YES |
| City Fixed Effects | NO | NO | NO | YES |
| Observations | 31,284 | 31,284 | 31,284 | 31,284 |
| Adj. R2 | 0.3715 | 0.4196 | 0.4207 | 0.4215 |
Note: This table presents the regression results for the impact of open government data on corporate investment. Column (1) presents the results of the univariate regression analysis. Column (2) reports the regression results with all control variables added. Column (3) incorporates industry trend controls, in addition to the comprehensive variable regression analysis. Column (4) incorporates regional trend controls in addition to a comprehensive variable regression analysis. ***, **, and * denote significance at the 1%, 5%, and 10% levels, respectively. |
Table 5. The regression results after clustering at the firm, regional, and industry levels. |
| Variable | (1) | (2) | (3) | (4) | (5) |
|---|---|---|---|---|---|
| Invest | Invest | Invest | Invest | Invest | |
| Open | 0.0030** | 0.0030** | 0.0030** | 0.0030*** | 0.0030*** |
| (2.14) | (2.43) | (2.23) | (3.25) | (3.44) | |
| Size | 0.0128*** | 0.0128*** | 0.0128*** | 0.0128*** | 0.0128*** |
| (8.83) | (10.74) | (8.69) | (5.56) | (5.89) | |
| Lev | 0.0036 | 0.0036 | 0.0036 | 0.0036 | 0.0036 |
| (0.63) | (0.67) | (0.59) | (0.57) | (0.60) | |
| Roe | 0.0237*** | 0.0237*** | 0.0237*** | 0.0237*** | 0.0237*** |
| (7.36) | (7.55) | (6.20) | (4.81) | (5.09) | |
| Cfo | -0.0033 | -0.0033 | -0.0033 | -0.0033 | -0.0033 |
| (-0.58) | (-0.54) | (-0.52) | (-0.35) | (-0.37) | |
| Age | -0.0420*** | -0.0420*** | -0.0420*** | -0.0420*** | -0.0420*** |
| (-11.17) | (-12.90) | (-9.92) | (-8.70) | (-9.20) | |
| Growth | 0.0212*** | 0.0212*** | 0.0212*** | 0.0212*** | 0.0212*** |
| (13.75) | (10.21) | (9.51) | (5.51) | (5.83) | |
| Balance | 0.0020 | 0.0020 | 0.0020 | 0.0020 | 0.0020* |
| (1.22) | (1.41) | (1.29) | (1.67) | (1.78) | |
| Independ | -0.0179 | -0.0179 | -0.0179 | -0.0179 | -0.0179 |
| (-1.36) | (-1.29) | (-1.25) | (-1.41) | (-1.49) | |
| Board | -0.0028 | -0.0028 | -0.0028 | -0.0028 | -0.0028 |
| (-0.53) | (-0.47) | (-0.47) | (-0.60) | (-0.63) | |
| Dual | 0.0029* | 0.0029** | 0.0029** | 0.0029 | 0.0029* |
| (2.12) | (2.35) | (2.33) | (1.72) | (1.82) | |
| Lngdp | 0.0090 | 0.0090* | 0.0090 | 0.0090 | 0.0090 |
| (1.68) | (1.70) | (1.70) | (1.42) | (1.50) | |
| lnfinance | -0.0021 | -0.0021 | -0.0021 | -0.0021 | -0.0021 |
| (-0.49) | (-0.62) | (-0.59) | (-0.51) | (-0.53) | |
| Cons | -0.1761** | -0.1761*** | -0.1761*** | -0.1761*** | -0.1761*** |
| (-2.84) | (-3.27) | (-3.08) | (-5.06) | (-5.35) | |
| Firm Fixed Effects | Yes | Yes | Yes | Yes | Yes |
| Year Fixed Effects | Yes | Yes | Yes | Yes | Yes |
| Industry Fixed Effects | Yes | Yes | Yes | Yes | Yes |
| City Fixed Effects | Yes | Yes | Yes | Yes | Yes |
| Firm and year cluster | Yes | ||||
| City cluster | Yes | ||||
| City and year cluster | Yes | ||||
| City and industry cluster | Yes | ||||
| City,firm and industry cluster | Yes | ||||
| Observations | 31,284 | 31,284 | 31,284 | 31,284 | 31,284 |
| Adj. R2 | 0.4215 | 0.4215 | 0.4215 | 0.4215 | 0.4215 |
Note: This table presents the regression results after clustering at the firm, regional, and industrial levels. Column (1) pertains to clustering at both the firm and temporal levels, Column (2) pertains to clustering at the city level, Column (3) pertains to clustering at both the city and temporal levels, Column (4) pertains to clustering at both the city and industrial levels, and Column (5) pertains to clustering at the city, firm, and industrial levels. |
4.2 Robustness checks
4.2.1 Parallel trend test
Table 6. Parallel trend test. |
| Variable | (1) | (2) | (3) |
|---|---|---|---|
| Invest | Invest | Invest | |
| EventN13 | -0.0090 | -0.0083 | -0.0090 |
| (-1.23) | (-1.46) | (-1.63) | |
| EventN12 | -0.0063 | -0.0053 | -0.0063 |
| (-1.18) | (-1.07) | (-1.31) | |
| EventN11 | -0.0044 | -0.0041 | -0.0044 |
| (-0.67) | (-1.04) | (-1.17) | |
| EventN10 | -0.0059 | -0.0055 | -0.0059 |
| (-0.95) | (-1.45) | (-1.62) | |
| EventN9 | -0.0013 | -0.0010 | -0.0013 |
| (-0.28) | (-0.26) | (-0.35) | |
| EventN8 | -0.0002 | 0.0003 | -0.0002 |
| (-0.05) | (0.11) | (-0.06) | |
| EventN7 | -0.0032 | -0.0026 | -0.0032 |
| (-0.95) | (-0.89) | (-1.14) | |
| EventN6 | -0.0038 | -0.0035 | -0.0038 |
| (-1.61) | (-1.46) | (-1.64) | |
| EventN5 | -0.0022 | -0.0020 | -0.0022 |
| (-0.95) | (-0.97) | (-1.11) | |
| EventN4 | -0.0021 | -0.0021 | -0.0021 |
| (-0.89) | (-1.06) | (-1.09) | |
| EventN3 | 0.0013 | 0.0015 | 0.0013 |
| (0.71) | (0.80) | (0.68) | |
| EventN2 | 0.0014 | 0.0013 | 0.0014 |
| (0.84) | (0.92) | (0.98) | |
| Event0 | 0.0028** | 0.0026** | 0.0028** |
| (2.43) | (2.35) | (2.54) | |
| EventP1 | 0.0031** | 0.0030** | 0.0031** |
| (2.25) | (2.02) | (2.19) | |
| EventP2 | 0.0044** | 0.0043** | 0.0044** |
| (2.37) | (2.36) | (2.53) | |
| EventP3 | 0.0044* | 0.0040* | 0.0044* |
| (1.89) | (1.67) | (1.87) | |
| EventP4 | 0.0052* | 0.0050 | 0.0052* |
| (1.86) | (1.64) | (1.70) | |
| EventP5 | 0.0061* | 0.0052* | 0.0061** |
| (1.86) | (1.93) | (2.26) | |
| EventP6 | 0.0066* | 0.0059* | 0.0066** |
| (1.81) | (1.83) | (2.05) | |
| EventP7 | 0.0068 | 0.0067** | 0.0068** |
| (1.46) | (2.28) | (2.43) | |
| EventP8 | 0.0087 | 0.0086** | 0.0087** |
| (1.59) | (2.38) | (2.34) | |
| EventP9 | 0.0060 | 0.0056 | 0.0060 |
| (1.09) | (1.16) | (1.33) | |
| EventP10 | 0.0081 | 0.0077* | 0.0081** |
| (1.44) | (1.85) | (2.10) | |
| Size | 0.0070*** | 0.0069*** | 0.0070*** |
| (7.29) | (11.40) | (10.89) | |
| Lev | 0.0123** | -0.0014 | 0.0123*** |
| (2.13) | (-0.32) | (2.87) | |
| Roe | 0.0226*** | 0.0167*** | 0.0226*** |
| (3.95) | (5.39) | (7.25) | |
| Cfo | 0.0640*** | 0.0956*** | 0.0640*** |
| (7.24) | (13.35) | (9.90) | |
| Age | -0.0226*** | -0.0239*** | -0.0226*** |
| (-8.03) | (-18.81) | (-17.42) | |
| Growth | 0.0249*** | 0.0244*** | 0.0249*** |
| (5.36) | (12.62) | (13.66) | |
| Balance | 0.0012 | 0.0007 | 0.0012 |
| (1.38) | (0.66) | (1.14) | |
| Independ | -0.0035 | -0.0063 | -0.0035 |
| (-0.28) | (-0.45) | (-0.27) | |
| Board | -0.0036 | 0.0029 | -0.0036 |
| (-0.74) | (0.61) | (-0.87) | |
| Dual | 0.0037** | 0.0042*** | 0.0037*** |
| (2.23) | (2.99) | (2.97) | |
| lngdp | 0.0072 | 0.0055 | 0.0072 |
| (1.05) | (0.96) | (1.30) | |
| lnfinance | -0.0012 | -0.0004 | -0.0012 |
| (-0.25) | (-0.09) | (-0.30) | |
| Cons | -0.1022** | -0.1014* | -0.1022* |
| (-2.71) | (-1.90) | (-1.96) | |
| Firm Fixed Effects | YES | YES | YES |
| Year Fixed Effects | YES | YES | YES |
| Industry Fixed Effects | NO | YES | YES |
| City Fixed Effects | NO | NO | YES |
| Observations | 31,064 | 31,064 | 31,064 |
| Adj. R2 | 0.2191 | 0.1778 | 0.2191 |
Note: This table presents the regression results of the parallel trend test. Column (1) presents the results without considering industry fixed effects and city fixed effects. Column (2) presents the results with consideration of industry fixed effects and without consideration of city fixed effects. Column (3) presents the results with consideration of industry fixed effects and city fixed effects. ***, **, and * denote significance at the 1%, 5%, and 10% levels, respectively. |

Figure 1. Parallel trend test. This figure plots the parallel trend test based on the results from Column 3 of Table 5. |
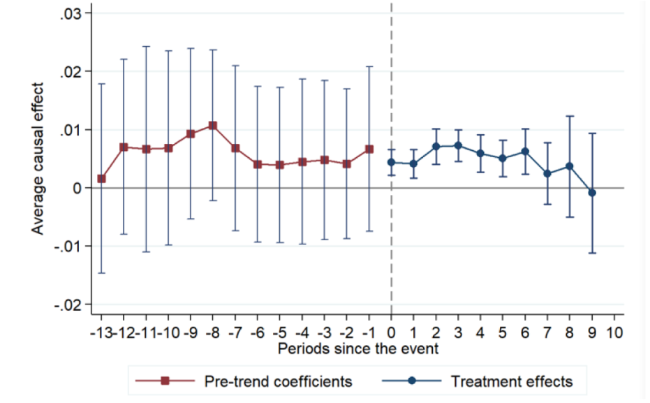
Figure 2. Parallel trend test with consideration of heterogeneous treatment effects. |
4.2.2 Placebo test

Figure 3. Placebo test. |
4.2.3 Propensity score matching method and entropy balance matching method
Table 7. Results of propensity score matching method and entropy balance matching method. |
| Variable | (1) | (2) | (3) | (4) |
|---|---|---|---|---|
| Nearest neighbor matching (1:1) | Radius matching | Kernel matching | Entropy balance matching | |
| Open | 0.0032** | 0.0032*** | 0.0032*** | 0.0020* |
| (2.57) | (3.45) | (3.40) | (1.75) | |
| Size | 0.0129*** | 0.0125*** | 0.0125*** | 0.0108*** |
| (6.28) | (6.54) | (6.54) | (4.11) | |
| Lev | 0.0003 | 0.0031 | 0.0031 | 0.0088 |
| (0.07) | (0.63) | (0.63) | (1.54) | |
| Roe | 0.0200*** | 0.0234*** | 0.0234*** | 0.0226*** |
| (4.57) | (5.55) | (5.58) | (5.47) | |
| Cfo | -0.0027 | -0.0026 | -0.0026 | -0.0019 |
| (-0.35) | (-0.31) | (-0.31) | (-0.18) | |
| Age | -0.0434*** | -0.0412*** | -0.0411*** | -0.0355*** |
| (-10.42) | (-9.40) | (-9.35) | (-6.80) | |
| Growth | 0.0209*** | 0.0210*** | 0.0210*** | 0.0173*** |
| (5.99) | (6.06) | (6.06) | (3.77) | |
| Balance | 0.0010 | 0.0016 | 0.0016 | 0.0033 |
| (0.65) | (1.40) | (1.38) | (1.38) | |
| Independ | -0.0151 | -0.0177* | -0.0181* | -0.0031 |
| (-1.50) | (-1.86) | (-1.90) | (-0.20) | |
| Board | -0.0021 | -0.0031 | -0.0032 | -0.0064 |
| (-0.54) | (-0.87) | (-0.89) | (-1.43) | |
| Dual | 0.0021 | 0.0030* | 0.0029* | 0.0013 |
| (1.13) | (1.97) | (1.95) | (1.12) | |
| lngdp | 0.0072 | 0.0075 | 0.0075 | -0.0068 |
| (1.40) | (1.52) | (1.52) | (-0.87) | |
| lnfinance | -0.0083 | -0.0079 | -0.0078 | -0.0004 |
| (-1.65) | (-1.53) | (-1.54) | (-0.05) | |
| Cons | -0.0607 | -0.0654 | -0.0651 | -0.0344 |
| (-1.43) | (-1.36) | (-1.36) | (-0.58) | |
| Firm Fixed Effects | YES | YES | YES | YES |
| Year Fixed Effects | YES | YES | YES | YES |
| Industry Fixed Effects | YES | YES | YES | YES |
| City Fixed Effects | YES | YES | YES | YES |
| Observations | 26,661 | 31,021 | 31,063 | 31,284 |
| Adj. R2 | 0.4299 | 0.4222 | 0.4224 | 0.5301 |
Note: This table presents the regression results of propensity score matching method and entropy balance matching method. Column (1) presents the results of nearest neighbor matching with 1:1. Column (2) presents the results of radius matching. Column (3) presents the results of kernel matching. Column (4) presents the results of entropy balance matching. ***, **, and * denote significance at the 1%, 5%, and 10% levels, respectively. |
4.2.4 Alternative measures of corporate investment
Table 8. The regression results with alternative measures of corporate investment. |
| Variable | (1) | (2) | (3) |
|---|---|---|---|
| Invest2 | Invest3 | Invest4 | |
| Open | 0.0017** | 0.0027*** | 0.0019*** |
| (2.63) | (2.87) | (3.04) | |
| Size | 0.0054*** | 0.0115*** | 0.0068*** |
| (3.93) | (5.76) | (4.44) | |
| Lev | 0.0047 | 0.0068 | 0.0014 |
| (1.07) | (1.07) | (0.36) | |
| Roe | 0.0156*** | 0.0257*** | 0.0146*** |
| (4.83) | (5.67) | (4.92) | |
| Cfo | 0.0056 | -0.0088 | 0.0102* |
| (0.96) | (-0.99) | (1.89) | |
| Age | -0.0305*** | -0.0398*** | -0.0328*** |
| (-8.82) | (-8.57) | (-9.93) | |
| Growth | 0.0019*** | 0.0217*** | 0.0021*** |
| (3.98) | (6.19) | (4.17) | |
| Balance | 0.0006 | 0.0022* | 0.0005 |
| (0.63) | (1.83) | (0.47) | |
| Independ | -0.0048 | -0.0146 | -0.0078 |
| (-0.65) | (-1.30) | (-1.12) | |
| Board | -0.0001 | -0.0032 | 0.0002 |
| (-0.03) | (-0.83) | (0.10) | |
| Dual | 0.0016 | 0.0027 | 0.0018 |
| (1.47) | (1.59) | (1.69) | |
| lngdp | 0.0058** | 0.0061 | 0.0054** |
| (2.30) | (1.39) | (2.21) | |
| lnfinance | 0.0032 | 0.0030 | 0.0026 |
| (1.15) | (0.73) | (0.98) | |
| Cons | -0.1074** | -0.2074*** | -0.1225** |
| (-2.14) | (-2.88) | (-2.33) | |
| Firm Fixed Effects | YES | YES | YES |
| Year Fixed Effects | YES | YES | YES |
| Industry Fixed Effects | YES | YES | YES |
| City Fixed Effects | YES | YES | YES |
| Observations | 31,284 | 31,284 | 31,284 |
| Adj. R2 | 0.4553 | 0.4264 | 0.4456 |
Note: This table presents the regression results with alternative measures of corporate investment. Column (1) displays the results for the scenario in which corporate investment is quantified as the ratio of cash expended by a company for the acquisition and construction of fixed assets, intangible assets, and other long-term assets to total assets at the end of the period. Column (2) displays the results for the scenario in which corporate investment is quantified as the ratio of cash expended by a company for the acquisition and construction of fixed assets, intangible assets, and other long-term assets to total assets at the beginning of the period. Column (3) displays the results for the scenario in which corporate investment is quantified as the quotient obtained by dividing the difference between the cash expenditures for the acquisition and construction of fixed assets, intangible assets, and other long-term assets, and the net cash inflows from the disposal of these assets by the total assets at the end of the reporting period. ***, **, and * denote significance at the 1%, 5%, and 10% levels, respectively. |
4.2.5 The impact of provincial government data open platform
Table 9. Impact of provincial government data open platform. |
| Variable | (1) | (2) | (3) |
|---|---|---|---|
| Invest | Invest | Invest | |
| Open | 0.0030** | 0.0027* | 0.0043*** |
| (2.30) | (1.82) | (4.38) | |
| Size | 0.0128*** | 0.0140*** | 0.0128*** |
| (10.91) | (5.66) | (5.83) | |
| Lev | 0.0036 | 0.0020 | 0.0034 |
| (0.74) | (0.33) | (0.60) | |
| Roe | 0.0237*** | 0.0259*** | 0.0237*** |
| (9.80) | (6.27) | (5.64) | |
| Cfo | -0.0033 | -0.0065 | -0.0034 |
| (-0.60) | (-0.74) | (-0.40) | |
| Age | -0.0420*** | -0.0432*** | -0.0421*** |
| (-15.30) | (-8.49) | (-9.41) | |
| Growth | 0.0212*** | 0.0241*** | 0.0212*** |
| (15.49) | (8.56) | (6.17) | |
| Balance | 0.0020 | 0.0016 | 0.0021 |
| (1.32) | (1.08) | (1.56) | |
| Independ | -0.0179 | -0.0258* | -0.0177 |
| (-1.39) | (-1.95) | (-1.63) | |
| Board | -0.0028 | -0.0051 | -0.0029 |
| (-0.54) | (-1.26) | (-0.80) | |
| Dual | 0.0029** | 0.0033* | 0.0029* |
| (2.15) | (1.83) | (1.76) | |
| lngdp | 0.0090* | 0.0098 | 0.0084 |
| (1.69) | (1.51) | (1.41) | |
| lnfinance | -0.0021 | -0.0020 | -0.0023 |
| (-0.50) | (-0.39) | (-0.51) | |
| Cons | -0.1761*** | -0.1959*** | -0.1685*** |
| (-2.91) | (-4.63) | (-3.82) | |
| Firm Fixed Effects | YES | YES | YES |
| Year Fixed Effects | YES | YES | YES |
| Industry Fixed Effects | YES | YES | YES |
| City Fixed Effects | YES | YES | NO |
| Province Fixed Effects | YES | NO | YES |
| Observations | 31,284 | 24,416 | 31,284 |
| Adj. R2 | 0.4215 | 0.4119 | 0.4216 |
Note: This table presents the regression results on Impact of provincial government data open platform. Column (1) presents the findings with consideration of province fixed effects. Column (2) presents the findings for the scenario wherein municipalities directly under the central government were excluded from the analysis. Column (3) presents the findings for the scenario wherein the establishment of a provincial public data platform was taken as a quasi-natural experiment. ***, **, and * denote significance at the 1%, 5%, and 10% levels, respectively. |
4.2.6 The impact of other contemporaneous policies
Table 10. The impact of other contemporaneous policies. |
| Variable | (1) | (2) | (3) | (4) |
|---|---|---|---|---|
| Invest | Invest | Invest | Invest | |
| Open | 0.0028** | 0.0031*** | 0.0030*** | 0.0026** |
| (2.83) | (3.24) | (3.04) | (2.70) | |
| Size | 0.0127*** | 0.0127*** | 0.0127*** | 0.0127*** |
| (5.71) | (5.66) | (5.65) | (5.66) | |
| Lev | 0.0038 | 0.0038 | 0.0034 | 0.0034 |
| (0.65) | (0.63) | (0.57) | (0.57) | |
| Roe | 0.0237*** | 0.0236*** | 0.0235*** | 0.0237*** |
| (5.76) | (5.73) | (5.68) | (5.74) | |
| Cfo | -0.0024 | -0.0025 | -0.0024 | -0.0023 |
| (-0.28) | (-0.31) | (-0.29) | (-0.27) | |
| Age | -0.0419*** | -0.0420*** | -0.0415*** | -0.0415*** |
| (-9.12) | (-9.11) | (-8.88) | (-8.85) | |
| Growth | 0.0211*** | 0.0211*** | 0.0211*** | 0.0211*** |
| (6.07) | (6.10) | (6.11) | (6.09) | |
| Balance | 0.0019 | 0.0019 | 0.0019 | 0.0019 |
| (1.39) | (1.41) | (1.39) | (1.38) | |
| Independ | -0.0188 | -0.0191 | -0.0193 | -0.0192 |
| (-1.60) | (-1.64) | (-1.67) | (-1.64) | |
| Board | -0.0026 | -0.0027 | -0.0029 | -0.0027 |
| (-0.66) | (-0.72) | (-0.76) | (-0.70) | |
| Dual | 0.0029* | 0.0030* | 0.0029* | 0.0029* |
| (1.85) | (1.89) | (1.85) | (1.82) | |
| lngdp | 0.0092 | 0.0095 | 0.0093 | 0.0091 |
| (1.16) | (1.18) | (1.19) | (1.16) | |
| lnfinance | -0.0019 | -0.0018 | -0.0012 | -0.0014 |
| (-0.40) | (-0.37) | (-0.26) | (-0.30) | |
| Kdzgdid | 0.0039** | 0.0036** | ||
| (2.30) | (2.15) | |||
| Datadid | 0.0005 | 0.0002 | ||
| (0.29) | (0.11) | |||
| Zmqdid | 0.0048** | 0.0043* | ||
| (2.34) | (2.02) | |||
| Cons | -0.1810*** | -0.1826*** | -0.1950*** | -0.1922*** |
| (-4.34) | (-4.34) | (-4.54) | (-4.46) | |
| Firm Fixed Effects | Yes | Yes | Yes | Yes |
| Year Fixed Effects | Yes | Yes | Yes | Yes |
| Industry Fixed Effects | Yes | Yes | Yes | Yes |
| City Fixed Effects | Yes | Yes | Yes | Yes |
| Observations | 31,098 | 31,098 | 31,098 | 31,098 |
| Adj. R2 | 0.4228 | 0.4226 | 0.4228 | 0.4229 |
Note: This table presents the impact of other contemporaneous policies. Column (1) illustrates the results after accounting for the Broadband China Pilot Policy. Column (2) demonstrates the findings after controlling for the National Big Data Comprehensive Experimental Zone Policy. Column (3) depicts the outcomes after considering the Free Trade Zone Policy. Column (4) presents the results after simultaneously controlling for all three policies. ***, **, and * denote significance at the 1%, 5%, and 10% levels, respectively. |
5 The underlying mechanism and heterogeneity analysis
5.1 The impact of open government data on overall financing constraint
Table 11. The impact of open government data on overall financing constraint. |
| Variable | Invest |
|---|---|
| Open | 0.0046*** |
| (4.25) | |
| Open×Cfo | -0.0330*** |
| (-4.12) | |
| Size | 0.0129*** |
| (5.81) | |
| Lev | 0.0033 |
| (0.57) | |
| Roe | 0.0239*** |
| (5.75) | |
| Cfo | 0.0091 |
| (0.95) | |
| Age | -0.0419*** |
| (-9.39) | |
| Growth | 0.0212*** |
| (6.17) | |
| Balance | 0.0020 |
| (1.54) | |
| Independ | -0.0175 |
| (-1.62) | |
| Board | -0.0027 |
| (-0.74) | |
| Dual | 0.0028* |
| (1.75) | |
| lngdp | 0.0090 |
| (1.49) | |
| lnfinance | -0.0021 |
| (-0.47) | |
| Cons | -0.1790*** |
| (-4.13) | |
| Firm Fixed Effects | YES |
| Year Fixed Effects | YES |
| Industry Fixed Effects | YES |
| City Fixed Effects | YES |
| Observations | 31,284 |
| Adj. R2 | 0.4217 |
Note: This table presents the regression results of the impact of open government data on overall financing constraints. ***, **, and * denote significance at the 1%, 5%, and 10% levels, respectively. |
Table 12. The impact of open government data on overall financing constraint with KZ index. |
| Variable | Invest |
|---|---|
| Open×KZ | 0.0018*** |
| (5.11) | |
| KZ | -0.0049*** |
| (-8.29) | |
| Open | 0.0004 |
| (0.38) | |
| Size | 0.0106*** |
| (5.01) | |
| Lev | 0.0298*** |
| (4.73) | |
| Roe | 0.0222*** |
| (5.50) | |
| Cfo | -0.0505*** |
| (-4.02) | |
| Age | -0.0367*** |
| (-7.63) | |
| Growth | 0.0204*** |
| (6.24) | |
| Balance | 0.0021 |
| (1.59) | |
| Independ | -0.0190* |
| (-1.84) | |
| Board | -0.0032 |
| (-0.87) | |
| Dual | 0.0028 |
| (1.63) | |
| lngdp | 0.0102 |
| (1.72) | |
| lnfinance | -0.0023 |
| (-0.53) | |
| Cons | -0.1463*** |
| (-3.40) | |
| Firm Fixed Effects | YES |
| Year Fixed Effects | YES |
| Industry Fixed Effects | YES |
| City Fixed Effects | YES |
| Observations | 30,775 |
| Adj. R2 | 0.4269 |
Note: This table presents the regression results of the impact of open government data on overall financing constraints by employing the KZ index as a metric for the degree of financing constraints. ***, **, and * denote significance at the 1%, 5%, and 10% levels, respectively. |
5.2 The impact of open government data on financing cost and financing scale
5.2.1 The impact of open government data on financing cost
Table 13. The impact of open government data on financing cost and financing scale. |
| Variable | (1) | (2) | (3) | (4) |
|---|---|---|---|---|
| OutFin | Invest | Loan | Invest | |
| Open | -0.0006** | 0.0027*** | 0.0025* | 0.0029*** |
| (-2.34) | (2.88) | (1.93) | (3.05) | |
| OutFin | -0.6592*** | |||
| (-7.88) | ||||
| Loan | 0.0490*** | |||
| (5.11) | ||||
| Size | -0.0002 | 0.0126*** | 0.0101*** | 0.0123*** |
| (-1.31) | (5.56) | (11.29) | (5.81) | |
| Lev | 0.0063*** | 0.0078 | 0.4269*** | -0.0174** |
| (8.71) | (1.27) | (112.49) | (-2.62) | |
| Roe | -0.0052*** | 0.0203*** | 0.0043 | 0.0235*** |
| (-10.34) | (4.91) | (1.51) | (5.68) | |
| Cfo | 0.0076*** | 0.0016 | -0.1947*** | 0.0063 |
| (9.04) | (0.18) | (-31.19) | (0.79) | |
| Age | 0.0002 | -0.0418*** | 0.0064*** | -0.0423*** |
| (0.45) | (-9.69) | (2.76) | (-9.36) | |
| Growth | -0.0008*** | 0.0206*** | -0.0048*** | 0.0214*** |
| (-6.78) | (6.21) | (-5.09) | (5.99) | |
| Balance | 0.0009*** | 0.0025* | -0.0054*** | 0.0023* |
| (3.60) | (1.97) | (-4.41) | (1.76) | |
| Independ | -0.0010 | -0.0188* | -0.0210* | -0.0168 |
| (-0.50) | (-1.75) | (-1.74) | (-1.56) | |
| Board | -0.0005 | -0.0031 | -0.0096** | -0.0023 |
| (-0.63) | (-0.86) | (-2.17) | (-0.62) | |
| Dual | 0.0001 | 0.0029* | -0.0028** | 0.0030* |
| (0.23) | (1.81) | (-2.15) | (1.85) | |
| lngdp | -0.0027*** | 0.0067 | 0.0013 | 0.0090 |
| (-3.20) | (1.09) | (0.30) | (1.54) | |
| lnfinance | 0.0018*** | -0.0018 | -0.0049 | -0.0019 |
| (2.73) | (-0.42) | (-1.37) | (-0.43) | |
| Cons | 0.0058 | -0.1527*** | -0.1759*** | -0.1674*** |
| (0.82) | (-3.54) | (-3.63) | (-4.01) | |
| Firm Fixed Effects | YES | YES | YES | YES |
| Year Fixed Effects | YES | YES | YES | YES |
| Industry Fixed Effects | YES | YES | YES | YES |
| City Fixed Effects | YES | YES | YES | YES |
| Observations | 31,284 | 31,284 | 31,284 | 31,284 |
| Adj. R2 | 0.6732 | 0.4261 | 0.7926 | 0.4237 |
Note: This table presents the regression results for the impact of open government data on financing cost and financing scale. Column (1) presents the findings for the scenario wherein the relationship between the mechanism variable (OutFin) and the independent variable (Open) is examined. Column (2) presents the findings for the scenario wherein the relationship between corporate investment levels and mechanism variables (OutFin) is examined. Column (3) presents the findings for the scenario wherein the relationship between the mechanism variable (Loan) and the independent variable (Open) is examined. Column (4) presents the findings for the scenario wherein the relationship between the corporate investment levels and mechanism variables (Loan) is examined. ***, **, and * denote significance at the 1%, 5%, and 10% levels, respectively. |
5.2.2 The impact of open government data on financing scale
5.3 Heterogeneity analysis
5.3.1 State-owned enterprises VS Non-state-owned enterprises
Table 14. The regression outcomes derived from the heterogeneity analysis. |
| Variable | (1) | (2) | (3) | (4) | (5) | (6) | (7) | (8) |
|---|---|---|---|---|---|---|---|---|
| Non-SOEs | SOEs | High-Tech | Non-High-Tech | EU_low | EU_high | Eastern | Central-western | |
| Invest | Invest | Invest | Invest | Invest | Invest | Invest | Invest | |
| Open | 0.0001 | 0.0056*** | 0.0024** | 0.0037 | 0.0015 | 0.0032* | 0.0023** | 0.0016 |
| (0.11) | (2.98) | (2.59) | (1.59) | (0.72) | (1.79) | (2.22) | (0.63) | |
| Size | 0.0140*** | 0.0106*** | 0.0165*** | 0.0071** | 0.0150*** | 0.0116*** | 0.0132*** | 0.0121*** |
| (5.77) | (4.30) | (14.47) | (2.75) | (4.02) | (7.19) | (5.28) | (5.56) | |
| Lev | 0.0102 | 0.0015 | 0.0070 | 0.0072 | -0.0020 | 0.0066 | 0.0090 | -0.0057 |
| (1.72) | (0.12) | (0.90) | (0.75) | (-0.16) | (1.40) | (1.33) | (-0.77) | |
| Roe | 0.0216*** | 0.0282*** | 0.0246** | 0.0229*** | 0.0299*** | 0.0195*** | 0.0212*** | 0.0298*** |
| (4.49) | (4.32) | (3.98) | (3.20) | (4.24) | (5.00) | (5.19) | (5.56) | |
| Cfo | -0.0069 | -0.0073 | -0.0102 | 0.0040 | 0.0048 | -0.0085 | -0.0045 | 0.0002 |
| (-0.80) | (-0.68) | (-1.26) | (0.34) | (0.57) | (-0.72) | (-0.55) | (0.02) | |
| Age | -0.0473*** | -0.0394*** | -0.0408*** | -0.0457*** | -0.0448*** | -0.0446*** | -0.0455*** | -0.0356*** |
| (-8.28) | (-5.81) | (-8.71) | (-6.34) | (-8.74) | (-9.05) | (-10.75) | (-4.06) | |
| Growth | 0.0178*** | 0.0246*** | 0.0252*** | 0.0164*** | 0.0162*** | 0.0227*** | 0.0174*** | 0.0277*** |
| (5.95) | (5.33) | (11.82) | (3.65) | (4.50) | (6.90) | (4.72) | (9.11) | |
| Balance | 0.0010 | 0.0035* | -0.0002 | 0.0043 | 0.0031 | 0.0016 | 0.0017 | 0.0023 |
| (0.63) | (1.95) | (-0.12) | (1.63) | (1.41) | (1.00) | (1.14) | (0.95) | |
| Independ | -0.0230* | -0.0262 | -0.0108 | -0.0324 | -0.0410* | -0.0097 | -0.0092 | -0.0431** |
| (-2.06) | (-1.61) | (-1.86) | (-1.34) | (-2.09) | (-0.75) | (-0.71) | (-2.31) | |
| Board | -0.0072 | -0.0029 | -0.0015 | -0.0020 | -0.0000 | -0.0024 | -0.0042 | -0.0012 |
| (-1.51) | (-0.46) | (-0.35) | (-0.27) | (-0.01) | (-0.46) | (-0.73) | (-0.19) | |
| Dual | 0.0021 | 0.0015 | 0.0015 | 0.0036 | 0.0055** | 0.0011 | 0.0042** | -0.0016 |
| (1.17) | (0.72) | (0.93) | (1.66) | (2.66) | (0.45) | (2.72) | (-0.51) | |
| lngdp | 0.0115 | 0.0151** | 0.0078 | 0.0128 | 0.0091 | 0.0104** | 0.0171** | 0.0061 |
| (1.30) | (2.16) | (0.97) | (1.36) | (0.55) | (2.22) | (2.18) | (0.75) | |
| lnfinance | -0.0055 | -0.0049 | -0.0032 | -0.0057 | 0.0033 | -0.0057 | -0.0041 | -0.0020 |
| (-0.80) | (-1.14) | (-0.50) | (-1.06) | (0.49) | (-1.30) | (-0.65) | (-0.33) | |
| Cons | -0.1503* | -0.1361* | -0.2355*** | -0.0160 | -0.2953** | -0.1046** | -0.2271*** | -0.1303 |
| (-2.01) | (-2.04) | (-5.89) | (-0.32) | (-2.68) | (-2.43) | (-3.40) | (-1.72) | |
| Firm Fixed Effects | YES | YES | YES | YES | YES | YES | YES | YES |
| Year Fixed Effects | YES | YES | YES | YES | YES | YES | YES | YES |
| Industry Fixed Effects | YES | YES | YES | YES | YES | YES | YES | YES |
| City Fixed Effects | YES | YES | YES | YES | YES | YES | YES | YES |
| Observations | 17,364 | 13,227 | 18,980 | 12,266 | 10,871 | 19,952 | 21,520 | 9,745 |
| Adj. R2 | 0.4501 | 0.3947 | 0.4389 | 0.4179 | 0.4175 | 0.4444 | 0.4516 | 0.3726 |
| Empirical p-value | 0.000 | 0.001 | 0.060 | 0.008 | ||||
Note: This table delineates the regression outcomes derived from the heterogeneity analysis. Column (1) specifically illustrates the results pertaining to the sample of non-state-owned enterprises (Non-SOEs). Column (2) specifically illustrates the results pertaining to the sample of state-owned enterprises (SOEs). Column (3) specifically illustrates the results pertaining to the sample of high-tech enterprises. Column (4) specifically illustrates the results pertaining to the sample of non-high-tech enterprises. Column (5) specifically illustrates the results pertaining to the sample of low uncertainty groups. Column (6) specifically illustrates the results pertaining to the sample of high uncertainty groups. Column (7) specifically illustrates the results pertaining to the sample of eastern enterprises. Column (8) specifically illustrates the results pertaining to the sample of central and western enterprises. ***, **, and * denote significance at the 1%, 5%, and 10% levels, respectively. |
5.3.2 High-tech enterprise VS Non-high-tech enterprise
5.3.3 The impact of macroeconomic uncertainty
5.3.4 The impact of location heterogeneity
6 Additional tests
6.1 The quality of government data openness and corporate investment
Table 15. The impact of the quality of government data openness on corporate investment. |
| Variable | (1) | (2) | (3) | (4) |
|---|---|---|---|---|
| Invest | Invest | Invest | Invest | |
| Lnquality | 0.0029*** | |||
| (3.33) | ||||
| Lndata | 0.0024*** | |||
| (3.62) | ||||
| Lnplat | 0.0036*** | |||
| (2.93) | ||||
| Lnpolicy | 0.0025*** | |||
| (3.40) | ||||
| size | 0.0066*** | 0.0066*** | 0.0066*** | 0.0069*** |
| (8.87) | (8.85) | (8.92) | (9.12) | |
| lev | 0.0183*** | 0.0183*** | 0.0177** | 0.0166*** |
| (2.85) | (2.87) | (2.72) | (3.01) | |
| roe | 0.0210*** | 0.0211*** | 0.0211*** | 0.0205*** |
| (7.22) | (7.37) | (7.10) | (7.73) | |
| cf | 0.0536*** | 0.0538*** | 0.0530*** | 0.0481*** |
| (4.67) | (4.66) | (4.50) | (4.52) | |
| age | -0.0232*** | -0.0233*** | -0.0231*** | -0.0232*** |
| (-18.66) | (-18.87) | (-18.14) | (-17.65) | |
| growth | 0.0254*** | 0.0253*** | 0.0256*** | 0.0275*** |
| (9.59) | (9.61) | (9.28) | (9.46) | |
| sharesbalance | -0.0011 | -0.0011 | -0.0011 | -0.0011 |
| (-1.22) | (-1.21) | (-1.20) | (-1.09) | |
| independ | 0.0083 | 0.0080 | 0.0090 | 0.0127 |
| (0.58) | (0.56) | (0.62) | (0.82) | |
| board | -0.0062 | -0.0064 | -0.0062 | -0.0065 |
| (-1.63) | (-1.68) | (-1.57) | (-1.59) | |
| dual | 0.0045** | 0.0045** | 0.0046** | 0.0042* |
| (2.15) | (2.16) | (2.08) | (1.71) | |
| lngdp | 0.0053 | 0.0054 | 0.0045 | 0.0049 |
| (1.69) | (1.66) | (1.45) | (1.52) | |
| lnfinance | -0.0068** | -0.0067** | -0.0061** | -0.0062** |
| (-2.54) | (-2.43) | (-2.37) | (-2.31) | |
| _cons | 0.0018 | 0.0049 | -0.0017 | -0.0052 |
| (0.07) | (0.18) | (-0.07) | (-0.18) | |
| Firm Fixed Effects | YES | YES | YES | YES |
| Year Fixed Effects | YES | YES | YES | YES |
| Industry Fixed Effects | YES | YES | YES | YES |
| City Fixed Effects | YES | YES | YES | YES |
| Observations | 11,145 | 11,145 | 10,937 | 10,123 |
| Adj. R2 | 0.2040 | 0.2036 | 0.2041 | 0.2066 |
Note: This table presents the impact of the quality of government data openness on enterprise investment. Column (1) pertains to the assessment of the overall quality of government data openness (Lnquality); Column (2) pertains to the evaluation of the quality of open data (Lndata); Column (3) pertains to the evaluation of the quality of platform construction (Lnplat); and Column (4) pertains to the evaluation of the strength of policy support (Lnpolicy). |
6.2 The impact of open government data on corporate investment efficiency
Table 16. The impact of government data opening on corporate investment efficiency. |
| Variable | (1) | (2) | (3) | (4) |
|---|---|---|---|---|
| Invest | Invest | Invest | Invest | |
| Open*Tobin’s Q | 0.0026*** | 0.0024*** | 0.0024*** | 0.0022*** |
| (3.48) | (3.76) | (3.63) | (3.67) | |
| Tobin’s Q | -0.0011 | 0.0014** | 0.0014** | 0.0013** |
| (-1.47) | (2.45) | (2.48) | (2.30) | |
| Open | -0.0022 | -0.0016 | -0.0015 | -0.0015 |
| (-0.96) | (-1.02) | (-0.94) | (-0.86) | |
| Size | 0.0140*** | 0.0140*** | 0.0142*** | |
| (7.90) | (7.55) | (6.89) | ||
| Lev | 0.0019 | 0.0027 | 0.0028 | |
| (0.36) | (0.55) | (0.49) | ||
| Roe | 0.0218*** | 0.0222*** | 0.0224*** | |
| (5.25) | (5.47) | (5.49) | ||
| Cfo | -0.0043 | -0.0051 | -0.0048 | |
| (-0.50) | (-0.61) | (-0.58) | ||
| Age | -0.0430*** | -0.0430*** | -0.0437*** | |
| (-9.31) | (-9.48) | (-9.48) | ||
| Growth | 0.0211*** | 0.0211*** | 0.0209*** | |
| (6.12) | (6.15) | (6.15) | ||
| Balance | 0.0016 | 0.0016 | 0.0019 | |
| (1.36) | (1.31) | (1.41) | ||
| Independ | -0.0204* | -0.0201* | -0.0193* | |
| (-1.98) | (-1.97) | (-1.76) | ||
| Board | -0.0032 | -0.0034 | -0.0030 | |
| (-0.91) | (-1.00) | (-0.80) | ||
| Dual | 0.0030* | 0.0030* | 0.0030* | |
| (1.80) | (1.85) | (1.78) | ||
| lngdp | 0.0068 | 0.0067 | 0.0087 | |
| (1.54) | (1.49) | (1.46) | ||
| lnfinance | -0.0077 | -0.0073 | -0.0023 | |
| (-1.68) | (-1.55) | (-0.52) | ||
| _cons | 0.0550*** | -0.0933** | -0.0973* | -0.1973*** |
| (30.40) | (-2.11) | (-2.09) | (-4.68) | |
| Firm Fixed Effects | YES | YES | YES | YES |
| Year Fixed Effects | YES | YES | YES | YES |
| Industry Fixed Effects | NO | NO | YES | YES |
| City Fixed Effects | NO | NO | NO | YES |
| Observations | 31,284 | 31,284 | 31,284 | 31,284 |
| Adj. R2 | 0.3743 | 0.4210 | 0.4221 | 0.4227 |
Note: This table presents the regression results for the impact of government data opening on corporate investment efficiency. Column (1) presents the results of the regression analysis without the control variables. Column (2) reports the regression results with all control variables added. Column (3) incorporates industry trend controls, in addition to the comprehensive variable regression analysis. Column (4) incorporates regional trend controls in addition to a comprehensive variable regression analysis. ***, **, and * denote significance at the 1%, 5%, and 10% levels, respectively. |