


1 Introduction
Academic mobility serves as a key mechanism for the diffusion of knowledge, experience, skills, and professional networks (Peng et al., 2023; Sugimoto et al., 2017). By facilitating the exchange of ideas, academic mobility contributes positively to national research systems, thereby supporting broader social and economic development (Fernández-Zubieta et al., 2016). At the individual level, it provides scholars with access to advanced scientific infrastructure and fosters collaboration with diverse colleagues. These collaborations often lead to joint publications, enhancing academic visibility and increasing research output (Liu & Hu, 2022; Robinson-Garcia et al., 2019).
Mobility is widely recognised as essential for scientific career advancement and improved research performance, as it opens up diverse career trajectories and professional growth opportunities (Fortunato et al., 2018). Liu and Hu (2022) highlight that academic mobility not only facilitates new collaborations but also sustains existing ones. Mobile scholars tend to expand their networks while integrating prior connections into new institutional environments (Azoulay et al., 2010). Empirical evidence shows that academic mobility, whether international or national—positively impacts individual research productivity and citation impact (Crespi et al., 2007; Liu & Hu, 2022; Robinson-Garcia et al., 2019).
Patterns of academic mobility and research productivity are shaped by global trends, national and institutional policies, disciplinary cultures, and the personal goals of individual scholars (Fernández-Zubieta et al., 2016). A prominent global trend over recent decades has been the growing influence of global university rankings. These rankings heavily rely on metrics derived from Scopus- and Web of Science-indexed publications (Sasvári & Urbanovics, 2022) and have influenced national research policies—particularly in non-Western countries with limited traditions of publishing in these journals—to prioritise international publications (Cernat & Teixeira da Silva, 2025; Hladchenko & Moed, 2021; Korytkowski & Kulczycki, 2019; Kuzhabekova & Ruby, 2018; Moldashev & Tleuov, 2022).
Ukraine followed this trajectory. Before 1991, and for years afterward, research assessment in Ukraine focused primarily on publications in local, Ukrainian-language journals, rendering Ukrainian research largely invisible to the broader European scientific community. However, aiming to enhance the global standing of Ukrainian universities, the Ministry of Education and Science of Ukraine began reforming publication policies in 2013, requiring publications in Scopus- and WoS-indexed journals. This reform initially emphasised Ukrainian journals indexed in these databases, as well as international journals (Ministry of Education and Science, Youth and Sport of Ukraine, 2012).
Ukraine’s scientific and higher education systems have retained strong Soviet legacies. As a former Soviet republic, Ukraine inherited a division between research institutes—organised under the National Academy of Sciences of Ukraine (NASU)—and mainly teaching-oriented higher education institutions. In contrast, other post-Soviet countries, such as the Baltic states, which joined the European Union, integrated their academy institutes into university systems, thereby modernising their academic landscapes more substantially (Parliament of the Republic of Lithuania, 2009; Parliament of the Republic of Latvia, 1995).
This study pursues two main objectives. First, it examines mobility flows among Ukrainian researchers across the NASU, universities, and foreign institutions. Second, it investigates the relationships between research assessment policies, academic mobility, research productivity, and scholarly impact. Since international publication requirements were introduced in 2013, this study uses two distinct cohorts to assess policy effects over time. The first cohort included researchers who published their first article between 2005 and 2013 (N=7,689), and the second cohort included researchers who published their first article between 2014 and 2023 (N=19,151). These two cohorts allow for a comparative analysis across nearly equal timeframes, bracketing the year 2013, when the first policy reforms took effect. Publication data were extracted from the Dimensions database, which includes not only Scopus- and WoS-indexed publications but also other internationally recognised journals. This broader inclusion provides a more comprehensive view of the scholarly outputs and mobility patterns of Ukrainian researchers.
2 Academic mobility and productivity, as measured by scientometric approach
Major bibliometric databases (e.g. Web of Science, Scopus, Dimensions) provide detailed information about authors and their institutional affiliations, making it possible to trace mobility events (Robinson-Garcia et al., 2019). Most studies on academic mobility examine its impact on research productivity, typically measured in terms of the number of publications and citation impact (Halevi et al., 2016; Verginer & Riccaboni, 2021). These studies assessed the effects of both national (Fernández-Zubieta et al., 2016) and international mobility (Robinson-Garcia et al., 2019; Shen et al., 2022).
Regarding national mobility, Payumo et al. (2018) argued that mobile scholars tend to produce higher-impact publications than their non-mobile counterparts. This finding aligns with those of Halevi et al. (2016) and Aksnes et al. (2013), who showed that mobility between two or three institutions within a single country can enhance both the volume and citation rate of publications. However, Bolli and Schläpfer (2015) emphasise that the effects of mobility on research performance depend significantly on the researchers’ individual characteristics and the prestige of the institutions involved.
Deville et al. (2014) found that moving from elite to lower-ranked institutions is generally associated with a modest decline in performance, while transitioning into elite institutions does not necessarily lead to performance gains. Similarly, Allison and Long (1990) reported that moving to more prestigious institutions tend to result in increased publication and citation rates. Such upward mobility offers direct benefits: more research time, better infrastructure, greater funding opportunities, and enhanced academic reputation, all of which can improve future grant success. Furthermore, being embedded in a high-quality academic environment facilitates performance through direct collaboration and privileged access to well-established social networks.
Fernández-Zubieta et al. (2016) suggest that mobility to more prestigious departments has a weak but positive effect on research productivity, although it does not significantly influence citation impact. In contrast, downward mobility tends to reduce productivity. They also highlight that all types of job mobility, regardless of direction, are associated with short-term performance declines due to adjustment costs. However, these declines often do not recover in the long term for those who experience downward mobility. These findings are supported by Abramo et al., (2022), who found that over half of nationally mobile academics experience a decline in performance following their transfer.
The effect of national mobility on research performance also varies depending on the academic field, as well as the frequency and duration of mobility (Franzoni et al., 2014). Importantly, some studies emphasise that scientific productivity may also serve as a predictor of academic mobility. According to Abramo et al. (2022), two key perspectives exist: universities may actively recruit highly productive researchers to gain a competitive edge and institutions with strong research profiles may enhance the performance of newly hired staff. However, their study found that high research productivity was not a strong predictor of national mobility. In fact, national mobility is more common among academics without an established high scientific profile, as their more productive peers are more likely to engage in international mobility.
Internationally mobile scholars tend to be more productive and publish more than their non-mobile peers (Ganguli, 2011), although the effect may be modest (Aksnes et al., 2013). At the same time, higher productivity may be a cause rather than a consequence of international mobility, as more productive researchers are more likely to secure international opportunities (Hunter et al., 2009).
International mobility is also associated with a greater citation impact (Dubois et al., 2014; Finocchi et al., 2023; Franzoni et al., 2014; OECD, 2015). Mobile scholars can experience up to a 17% increase in citations compared to their non-mobile counterparts, a boost attributed to greater diversity in co-authorship and research topics following relocation (Gu et al., 2024; Petersen, 2018). Overall, the scientific impact of mobile scholars is approximately 20% higher than that of non-mobile scholars (OECD, 2013). They are also more likely to publish in high-prestige journals (Aykac, 2021).
3 Science in Ukraine
Ukraine was a former Soviet state that gained independence in 1991. However, powerful actors from the Soviet period managed to retain their influence in independent Ukraine (Åslund, 2001; Kudeila, 2012; Riabchuk, 2009), thereby preserving the Soviet model of higher education and science (Josephson & Egorov, 1997). One characteristic element of the Soviet model was the division between the research institutes of the National Academy of Sciences of Ukraine (NASU) and teaching-oriented universities. After 1991, next to the NASU, sectoral academies of sciences were established: agrarian, medical, law, art, and pedagogical academies (President of Ukraine, 1992, 1993).
NASU was established in 1918 to support the project of nation-building (Polonska-Vasylenko, 1955). However, as in 1919, Bolsheviks occupied Ukraine, and the academy - originally intended to foster Ukrainian nation building-was converted into an institution aimed at promoting Soviet ideology. After 1991, the pre-existing hierarchical governance structure of the academy was preserved as well as Soviet-style administrators who had long ties with the communist party leadership (Josephson & Egorov, 1997). In 1991, 47,000 researchers were affiliated with NASU, which decreased to 13, 883 by 2023 (NASU, 2023). NASU consists of research institutes. Physics and engineering dominate NASU over other disciplines in terms of the number of researchers and research institutes (Josephson & Egorov, 1997).
As regards higher education institutions, in the early 1990s, the government relabeled most of them into universities. They were authorized to conduct research (Parliament of Ukraine, 2002, 2014), but they did not receive either research infrastructure or the required funding. In 2014, the maximum number of teaching hours decreased from 900 to 600 per year. This aimed to increase the time for research (Ministry of Education and Science of Ukraine, 2016). Ukrainian academics with temporary employment need to renew their contracts every year or once every three years. The decision on contract renewal depends on their performance in previous years.
After 1991, research assessment policies in Ukraine considered articles only in Ukrainian journals. In 2012, the Ministry of Education and Science, Youth and Sport of Ukraine, introduced publications in international journals and Scopus- and WoS-indexed Ukrainian journals among the publication requirements for doctoral degrees (Ministry of Education and Science, Youth and Sport of Ukraine, 2012). The publication requirements were enforced in September 2013. One article in an international journal and four articles in Ukrainian professional journals became obligatory for a PhD degree, and four international articles and sixteen articles in Ukrainian professional journals became obligatory for a second-level doctoral degree (Ministry of Education and Science, Youth and Sport of Ukraine, 2012). Until 2015, the requirements for promotion to associate professors and professors in Ukraine included publishing textbooks approved by the education ministry and articles in Ukrainian professional journals. In 2015, new qualification standards were approved and came into force in 2016. According to these updated requirements, candidates for promotion to associate professors (docent) must hold a PhD, have at least five years of work experience in the field, publish at least one article in a journal indexed in Scopus or Web of Science, possess an international certificate confirming English language proficiency at level B2, and participate in a study visit, conference, or symposium held in an OECD or European Union country (Cabinet of Ministers of Ukraine, 2015). For promotion to a professor, candidates must have a second-level doctoral degree, ten years of experience, two international articles, and fulfill the same international engagement and language criteria. In both cases, the B2 certificate may be substituted with ten articles in Scopus- or WoS-indexed journals.
Articles published in both Ukrainian journals and those indexed in Scopus and Web of Science were incorporated into the requirements for study program licensing (Cabinet of Ministers of Ukraine, 2015) and the criteria for research assessment of higher education institutions (Cabinet of Ministers of Ukraine, 2017). In 2019, the government further emphasised international publications by including them in the evaluation criteria for research projects competing for state funding (Cabinet of Ministers of Ukraine, 2019). The relevant information is summarized in Table 1.
Table 1. Summary of requirements for (international) publications in Ukrainian research assessment policies. |
| Policy | Publication requirements |
|---|---|
| Doctoral degrees (2013) | Publications in Ukrainian Scopus- and WoS-indexed journals or in international journals Since 2020 publications in any Scopus- and WoS-indexed journals Since September 2021 for the Doctor of Sciences and since September 2020 for PhD, the number of articles needed for their obtention can be reduced by publishing in Q1-Q3 journals |
| Licensing (2015) | At least five articles published during last five years in Ukrainian journals, in journals indexed in databases including Scopus and WoS |
| Requirements for scientific titles of associate professor and professor (2015) | Article(s) in Scopus- and WoS indexed journals |
| Research assessment of higher education institutions (2017) | Articles in journals indexed in international databases (the legislation does not clarify the names of databases) |
| Funding of research projects (2019) | Publications in Scopus- and WoS-indexed journals |
| Performance-based funding (2019) | Indicator of international recognition is defined based on the positions in international university rankings including QS Ranking. Research assessment by QS rankings takes the form of citations per faculty indicator. It takes data from Scopus |
High-quality research and higher education depend on sufficient funding, both to attract skilled professionals through adequate remuneration and to provide access to essential infrastructure. In Ukraine, chronic underfunding and inefficient allocation of resources in science and higher education have long constrained their development of science and education. However, the situation has deteriorated sharply since 2022, following Russo-Ukrainian war. Since then, the focus of everyday life for many Ukrainians, including scholars, has shifted to survival.
According to the Cabinet of Ministers of Ukraine (2024), 1,518 scholars joined the armed forces and tragically, 70 lost their lives. Ukrainian scholars and all Ukrainians continue to face regular shelling, power outages, and an unstable economic environment. The national economy is in crisis, the currency has weakened significantly, and public resources have been overwhelmingly redirected toward defense (BBC, 2024). Despite these immense challenges, Ukrainian scholars continue to publish, which deserves respect.
Apart from this, both the representatives of Ukrainian scientific community (Scientific Committee of the National Board of Ukraine on Science and Technology, 2023) and international experts (Horizon 2020 Policy Support Facilities, 2017; Schiermeier, 2019) state that the inability to break away with the Soviet-style culture and practices holds Ukrainian science back and hinders the societal and economic development of the country.
4 Methods
Data for this research were retrieved from the in-house version of the Dimensions database at the Centre for Science and Technology Studies (CWTS) at Leiden University. The Dimensions database is a relatively new entrant in the list of curated scholarly databases. It was launched by Digital Science in January 2018 to provide a single platform access to a wide range of scholarly literature (Gupta & Singh, 2024). Thelwall (2018) states that the scholarly database component of Dimensions is a plausible alternative to Scopus and the Web of Science for general citation analyses and for citation data. According to Thelwall (2018), almost all Scopus articles with DOIs were found in Dimensions and high correlations between citation counts from Scopus and Dimensions. Singh et al. (2021) revealed that about 99.11% and 96.61% of the journals indexed in Web of Science are also indexed in Scopus and Dimensions, respectively. Scopus has 96.42% of its indexed journals also covered by Dimensions. The Dimensions database has the most exhaustive coverage, with 82.22% more journals covered compared to Web of Science and 48.17% more journals covered compared to Scopus. As such, the Dimensions database has a much larger number of journals indexed than Web of Science and Scopus.
The following steps were taken to create the dataset:
1) Unique identifiers of scholars who published with Ukrainian affiliations during the period 2005-2023 were retrieved from the Dimensions database. The analysis focused exclusively on journal articles, as they represent the most significant and peer-reviewed form of scholarly communication. This approach was adopted to minimise publication noise associated with less rigorously vetted document types, such as conference proceedings or editorials. Scholars publishing at list two articles were identified.
2) The list of Ukrainian affiliation organisations was compiled based on affiliation data in the dataset. Organisations were manually classified into the research institutes of the NASU, Ukrainian universities, and other organisations. The dataset was limited to scholars affiliated with either the NASU or Ukrainian universities. In 2014, following the occupation of Crimea by Russia, organisations that were formerly Ukrainian were affiliated with Russia in the articles. Therefore, scholars with final affiliations to organisations in Crimea later than 2013 were excluded from the dataset. In these cases, the change of affiliation country does not reflect mobility, but rather occupation. Considering the occupation of Eastern Ukraine since 2014, a list of Ukrainian universities located in Eastern Ukraine up to 2014 was compiled. Data were gathered regarding their displacement to non-occupied Ukraine or name changes for those that partly remained in occupied territories. Scholars affiliated with these institutions were checked manually. Cases where universities located in occupied territories were marked as Ukrainian, as well as those where the change of affiliation from Ukrainian to Russian was due to occupation, were excluded from the dataset.
3) The final dataset of 26,541 scholars consists of those who claimed in their articles an affiliation either with the NASU, Ukrainian university, or a foreign institution. National affiliations were marked as “NASU” and “University”, while foreign affiliations were categorised as “Abroad”.
4) Considering the affiliations in the first and last publications, the initial and final affiliations of each scholar were defined. The following categories were considered for initial and final affiliations: “Abroad”, “Abroad & NASU”, “Abroad & University”, “University”, and “NASU”. Based on the initial and final affiliations, the following categories of mobility flows were identified:
• Non-mobile scholars, those initial and final affiliations are the same (e.g. “University”- “Initial university”, “NASU”- “NASU”)
• Nationally mobile scholars, those who moved between Ukrainian institutions (e.g. “University”- “NASU”, “University”- “University”)
• Internationally mobile or co-affiliated scholars, who moved to or from a foreign institution, or those with dual affiliations either at the beginning or end of the observation window (“NASU”- “Abroad”, “NASU”- “NASU & Abroad”)
5) Based on the year of the first publication, the scholars were divided into two cohorts. The first cohort included 7,627 scholars who published their first article during 2005-2013. The second cohort included 18,914 scholars who published their first article between 2014 and 2023. Scholars who started publishing before 2005 or after 2023 were not included in the analysis.
6) Scholars’ productivity was measured using the average number of articles per scholar per year. The total number of articles published by a scholar was divided by the number of years between the first and the last publication. Citation impact was measured by field-normalized citation impact (FNCI). Citations to articles were normalized by document type, year of publication, and discipline. A dataset was created using all the articles published by scholars in each cohort. The number of citations of each paper was divided by the world average number of citations of articles from the same discipline (according to the Fields of Research classification in the Dimensions database) published in the same year. Articles belonging to more than one discipline were fractionalised. Each article was allocated to the relevant mobility flow from the two cohorts. We do not exclude the possibility that one article can be allocated to more than one flow.
7) Average normalized citations per flow pair (e.g. “NASU”- “NASU”) were calculated for each cohort separately.
8) Negative binomial regression was used to statistically compare the number of articles per scholar and the FNCI across the flows between the two cohorts.
5 Results
5.1 Mobile and non-mobile flows
Figures 1 and 2 illustrate the flows of mobile and non-mobile scholars from the two cohorts, distinguishing between mobile and non-mobile individuals based on their initial and final institutional affiliations. In the 2005-2013 cohort, the largest share of scholars originated from the “University” category, accounting for 48.2%, followed closely by those from the “NASU” category at 46.4%.
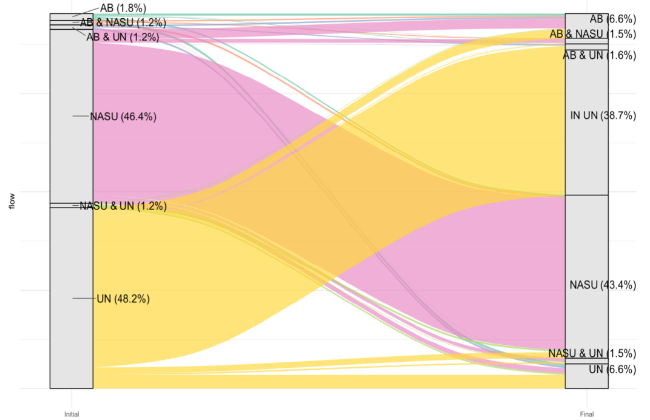
Figure 1. Changes in institutional affiliations of Ukrainian scholars who started publishing in 2005-2013 (N=7,627). |
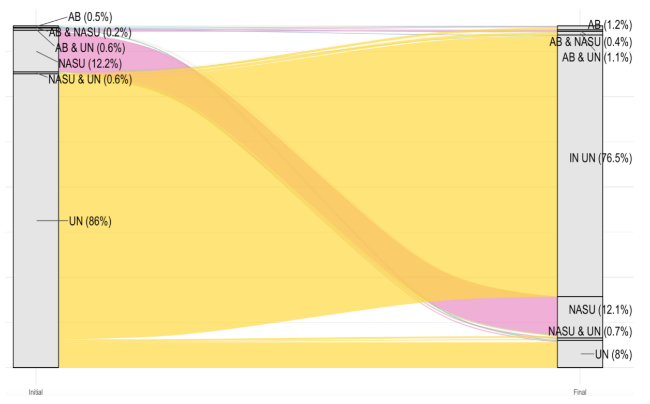
Figure 2. Changes in institutional affiliations of Ukrainian scholars who started publishing in 2014-2023 (N=18,914). |
Among the university-affiliated scholars, 80.3% remained at their initial university, indicating a high level of institutional retention. Similarly, 87.3% of NASU-affiliated scholars remained within the NASU system, reflecting even higher non-mobility within that sector.
When comparing initial and final affiliations, the share of scholars in “Abroad” category increased notably — from 1.9% at the initial affiliation to 6.5% in the final recorded affiliation. By contrast, changes in the representation of other categories remained minimal, with each comprising less than 2.0% of the total. The share of scholars in “Abroad & NASU” category increased from 1.2% to 1.5%. The percentage of scholars in the “Abroad & university” category increased from 1.2% to 1.6%. The percentage of scholars affiliated with both NASU and the university rose from 1.2% to 1.5%.
In the 2014-2023 cohort the total number of publishing scholars (N=18,914) is approximately 2.5 times greater than in the first cohort (N=7,627). This growth is mostly associated with a substantial increase in the number of scholars with an initial affiliation in the “University” category, which rose more than fourfold from 3,678 to 16,260. These scholars constitute 86.0% of the second cohort, which is 1.8 times higher than in the first cohort.
Conversely, the number of scholars initially affiliated with NASU declined significantly. Their share fell from 46.4% to 12.2%, representing a decrease of 35% from 3,539 to 2,304. This suggests a notable decline in the number of early career scholars employed at NASU.
The percentage of non-mobile scholars remained high in both major institutional categories: 88.6% for university-affiliated scholars (i.e. remaining at their initial university) and 92.1% for NASU-affiliated scholars. These values are slightly higher than those observed in the first cohort, indicating a marginally stronger tendency toward institutional non-mobility among more recent scholars.
Compared with the first cohort, the number of scholars with an initial affiliation in category “Abroad” has decreased from 138 to 88, while their share has fallen from 1.8% to 0.5%. Similarly, the number of scholars with a final affiliation in category “Abroad” has dropped from 500 to 219 reducing their share from 6.6 % to 1.2%. These changes suggest that either younger Ukrainian scholars are migrating abroad less frequently than their predecessors, or that those who began publishing internationally after 2013 are less likely to move abroad than those who published before 2013.
The number of scholars in flows “NASU”- “Abroad” and “University”- “Abroad” has decreased from 196 to 31 and from 195 to 128, respectively. In the second cohort, scholars affiliated with universities dominate those who have moved abroad, reversing the balance observed in the first cohort. Additionally, the share of scholars co-affiliated with both the NASU and university decreased compared to the first cohort.
5.2 Productivity of mobile and non-mobile scholars
Figures 3a and 3b illustrate the average number of articles per year per scholar across different mobility flows. In the 2005-2013 cohort (Figure 3a), the highest productivity is observed among scholars with a final affiliation in category “Abroad,” who published on average more than two articles per year. Elevated levels of productivity were also found among scholars in the initial or final affiliation “Abroad” and “Abroad & University” categories. In contrast, the lowest productivity is recorded among scholars in “NASU”- “NASU” (1.2), “University”- “University” (1.4) and “University”-“Initial university” (1.3) flows.
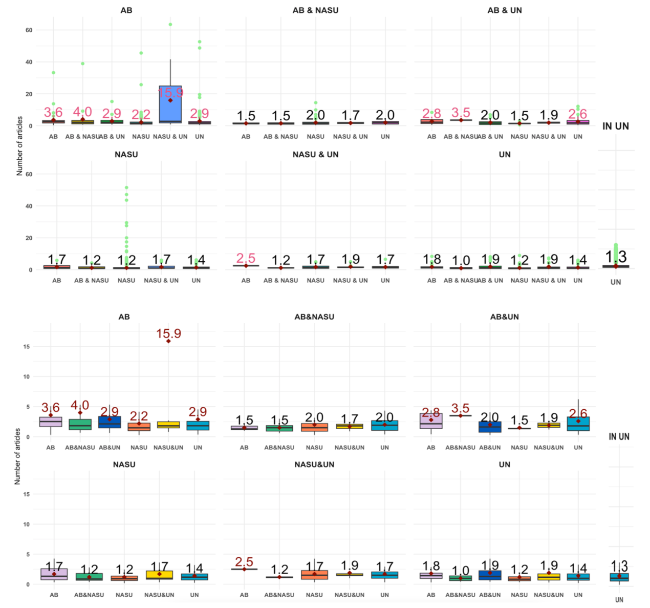
Figure 3a. Distribution of annual publication output per scholar across mobility flows: First article published in 2005-2013. |
In the 2014-2023 cohort (Figure 3b), average productivity has increased across most mobility flows, often exceeding two articles per year. Notably, the publication output of non-mobile scholars has increased considerably. Scholars in the “NASU-NASU” flow have increased their average output from 1.2 to 1.8 articles per year. Similarly, those in the “University-University” and “University”- “Initial university” flows increased their output from 1.4 to 2.5 and from 1.3 to 2.1, respectively. These trends suggest a general improvement in research productivity among both mobile and non-mobile scholars in the more recent cohort.
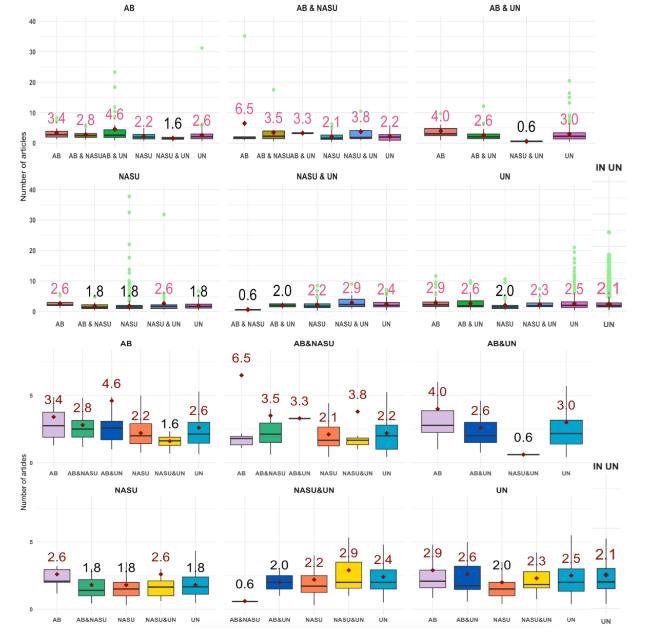
Figure 3b. Distribution of annual publication output per scholar across mobility flows: First article published in 2014-2023. |
Table 2 presents the results of the negative binomial regression (Model 1), which examines the number of articles per year across different mobility types and cohorts. Internationally mobile scholars, serving as the reference category, show the highest research productivity, with an estimated 2.5 articles per year. In comparison, nationally institutionally mobile scholars co-affiliated with both NASU and universities publish significantly fewer articles, with a coefficient of -0.525 (p < 0.001) and a predicted productivity of 1.5 articles per year. Nationally mobile scholars affiliated with universities also demonstrate reduced productivity (β = -0.630, p < 0.001), averaging 1.4 articles annually. Non-mobile scholars show the lowest levels of productivity, particularly those affiliated with universities (β = -0.656, p < 0.001) and NASU (β = -0.762, p < 0.001), producing 1.3 and 1.2 articles per year, respectively. Scholars in the second cohort were slightly more productive overall. The interaction terms reveal a productivity increase among nationally mobile and non-mobile scholars in the second cohort. For instance, the productivity of non-mobile university scholars has increased from 1.3 to 2.1 articles per year. Notably, the productivity of internationally mobile scholars remained highest and slightly improved in the second cohort, rising from 2.5 to 2.8 articles annually.
Table 2. Negative binomial regression. |
| Predictor | Number of scholars | Model 1 | Model 2 | Predicted number of articles per year | Predicted FNCI | ||||
|---|---|---|---|---|---|---|---|---|---|
| 2.5%CI | 97.5%CI | 2.5%CI | 97.5%CI | ||||||
| Intercept | 900 | 0.932*** (0.023) | 0.887 | 0.976 | 0.079*** (0.008) | 0.062 | 0.096 | 2.5 | 1.08 |
| Nationally institutionally mobile | 401 | -0.525*** (0.048) | -0.621 | -0.431 | -0.979*** (0.025) | -1.028 | -0.930 | 1.5 | 0.41 |
| Nationally mobile (university) | 282 | -0.630*** (0.058) | -0.745 | -0.518 | -1.383*** (0.036) | -1.454 | -1.314 | 1.4 | 0.27 |
| Non-mobile (university) | 2,955 | -0.656*** (0.028) | -0.711 | -0.600 | -1.365*** (0.015) | -1.394 | -1.336 | 1.3 | 0.28 |
| Non-mobile (NASU) | 3,089 | -0.762*** (0.028) | -0.818 | -0.707 | -0.983*** (0.014) | -1.011 | -0.955 | 1.2 | 0.41 |
| Second cohort | 623 | 0.11** (0.034) | 0.042 | 0.177 | -0.225*** (0.017) | -0.258 | -0.193 | 2.8 | 0.86 |
| Nationally institutionally mobile: second cohort | 355 | 0.270*** (0.067) | 0.139 | 0.402 | 0.370*** (0.040) | 0.291 | 0.449 | 2.2 | 0.47 |
| Nationally mobile (university): second cohort | 1,403 | 0.517*** (0.066) | 0.388 | 0.648 | 0.259*** (0.042) | 0.177 | 0.342 | 2.5 | 0.28 |
| Non-mobile (university): second cohort | 14,410 | 0.351*** (0.039) | 0.275 | 0.427 | 0.068*** (0.022) | 0.025 | 0.111 | 2.1 | 0.24 |
| Non-mobile (NASU): second cohort | 2,123 | 0.303*** (0.042) | 0.221 | 0.386 | 0.002 (0.026) | -0.49 | 0.054 | 1.8 | 0.32 |
| Log Likelihood | -42,754.650 | -188,335.900 | |||||||
| theta | 14.868*** (0) | 0.903*** (0.007) | |||||||
| Obs | 26,541 | 236,618 | |||||||
Note: Significance levels: ***p< 0.01, **p < 0.05, *p < 0.1. |
5.3 Field-normalised citation impact across mobility flows
Model 2 in Table 2 presents the results of a negative binomial regression comparing FNCI across different mobility flows. Internationally mobile scholars in the first cohort served as the reference group, showing the highest citation impact with a predicted FNCI of 1.08. All other mobility types showed significantly lower citation performance. Mobile scholars affiliated with universities had the largest drop in citation impact (β = -1.383, p < 0.01), with a predicted FNCI of just 0.27. Similarly, non-mobile university-affiliated scholars showed a sharp decline (β = -1.365, p < 0.01), with a predicted FNCI of 0.28. Nationally institutionally mobile scholars and non-mobile scholars from NASU have higher FNCI values (both 0.41), indicating a slightly better performance than their university-affiliated counterparts. In the second cohort, FNCI decreased among internationally mobile scholars (from 1.08 to 0.86), while nationally institutionally mobile scholars showed minor changes or slight increases (β = 0.370, p < 0.01). No-nmobile and mobile scholars affiliated with universities remain at the bottom. Overall, Model 2 shows a clear stratification of citation impact across mobility types, with internationally mobile scholars maintaining a leading position.
Figures 4a and 4b display the average FNCI across different mobility flows for the two cohorts of Ukrainian scholars. In the 2005-2013 cohort (Figure 4a), the highest citation impact is observed among scholars with final affiliaftion in category “Abroad” among some flows of scholars with initital affiliation in categories “Abroad,” “Abroad & NASU” and “Abroad & university”. The average FNCI values for these groups range from 1.05 to 1.69, indicating a strong citation advantage. In contrast, scholars who remained non-mobile within Ukraine had significantly lower avergae FNCI scores.
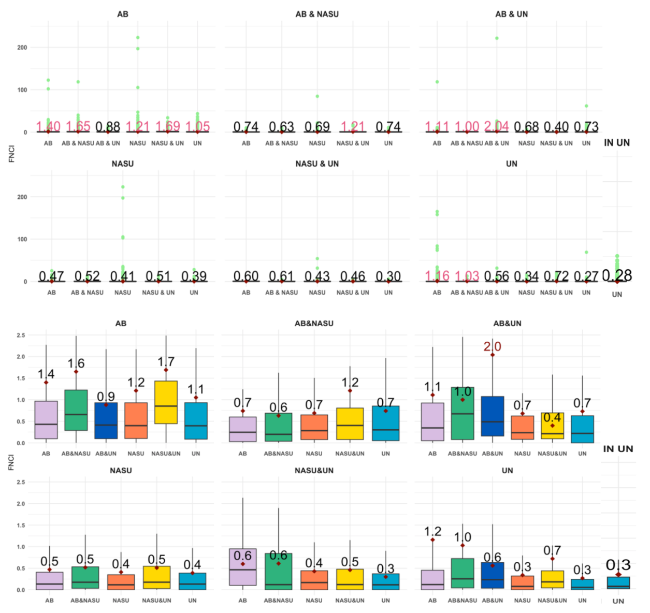
Figure 4a. Distribution of FNCI values across mobility flows: First article published in 2005-2013. |
The average FNCI of non-mobile scholars affiliated with NASU and universities is 0.41 and 0.28, respectively. The average FNCI of mobile scholars affiliated with universities was 0.27. This disparity underscores the influence of international exposure on scholarly visibility and citation impact.
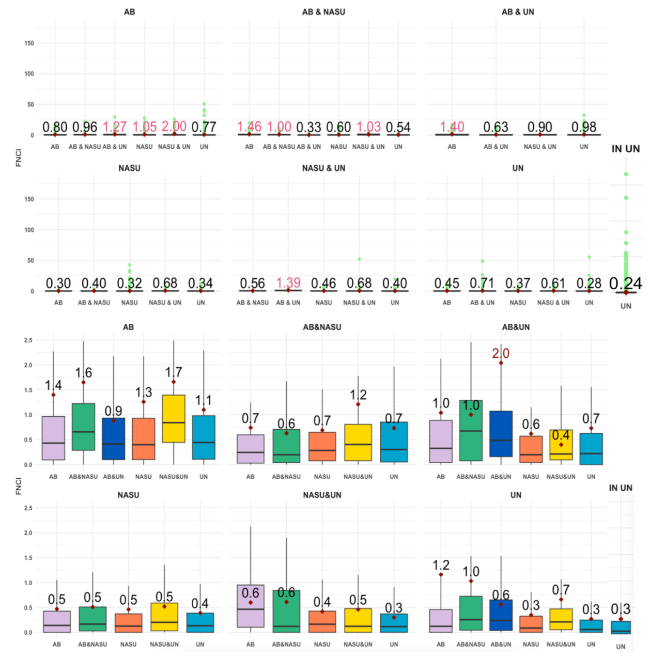
In the 2014-2023 cohort (Figure 4b), a noticeable decline in average FNCI was observed across almost all mobility flows, including internationally mobile groups. While scholars with final affiliation in category “Abroad” still perform better on average (with FNCI values between 0.77 and 2.00), their citation advantage has somewhat diminished. However, there is an improvement in the FNCI of some flows of scholars with final affiliation in category “Abroad & NASU.” Non-mobile scholars in domestic institutions continue to show low FNCI values, with many falling below 0.4. The average FNCI on non-mobile scholars affiliated with NASU has fallen from 0.41 to 0.32. The average FNCI of non-mobile scholars affiliated with universities has falled from 0.28 to 0.24, while the average FNCI of mobile scholars affiliated with universities has remained almost the same.
Figure 4b. Distribution of FNCI values across mobility flows: First article published in 2014-2023. |
Overall, Figures 4a and 4b illustrate the persistent citation advantage of international mobility, though its strength appears reduced in the younger cohort.
6 Conclusions
This study has examined the scholarly publishing landscape in Ukraine from 2005 to 2023, focusing on the interplay between academic mobility, productivity, and citation impact, particularly in the context of evolving research assessment policies. Using data from the Dimensions database, we analysed two cohorts of Ukrainian scholars: those who began publishing in 2005-2013 and those who entered the academic publishing scene in 2014-2023.
One of the key findings of this study is the profound structural shift in the affiliations of Ukrainian publishing scholars. The number of scholars in the 2014-2023 cohort is 2.5 times higher than in the 2005-2013 cohort, primarily due to a marked increase in scholars affiliated with universities. This surge aligns with the policy reforms introduced in 2013 aimed at scholars publishing internationally. Conversely, there has been a dramatic 35% decline in the number of publishing scholars affiliated with NASU. This decline suggests a reduction in the number of early career scholars at NASU since 2014.
Second, while the policy shift has succeeded in boosting the volume of scholarly output, this quantitative growth has not translated into a proportional rise in citation impact. Although the newer cohort of scholars, whether affiliated with universities or NASU, demonstrates higher productivity, their average citation impact remains low. Non-mobile scholars, in particular, continue to be associated with below-average citation performance across both institutional types. This finding aligns with previous research on the effects of research evaluation policies in Ukraine (Hladchenko 2022; Nazarovets 2020, 2022). Similar dynamics have been observed in other national contexts (Bloch & Schneider, 2016; Demir 2018; Ingwersen & Larsen, 2014; Korytkowski & Kulczycki, 2019; Quan et al., 2017). The limitation of this study is that the second cohort (2014-2023) had a shorter citation window, potentially affecting the overall citation impact. However, since FNCI values were normalised by the year of publication, this temporal difference was partially accounted for in the analysis.
The narrowing gap in the predicted publication counts between internationally mobile and non-mobile researchers, especially in the second cohort, suggests a trend toward convergence. This may reflect increasing standardization in research evaluations and greater access to publishing avenues for less mobile academics. The narrowing gap in citation impact between international mobility scholars can be because in the second cohort mobility was forced by Russo-Ukrainian war. Consequently, it allowed the scholars with less outstanding achievements to gain experience of international mobility.
In addition to national policies, university-level policies also shape scholars’ publication patterns. Consistent with the findings of this study, prior research has shown that in the Ukrainian context, university research evaluation policies are primarily focused on quantity rather than quality (Hladchenko, 2025). However, publication requirements alone cannot foster high-quality research in the absence of sufficient funding and structural support (Cernat, 2024). To effectively stimulate both the quantity and quality of scholarly output, enabling conditions must be established, including access to modern research infrastructure, competitive academic salaries, sustainable funding mechanisms, and opportunities for meaningful international collaboration. While these conditions already required significant improvement in Ukraine prior to 2022, the situation has deteriorated markedly afterwards. Destructions caused by the war, along with the resulting economic instability, have further weakened institutional support for research and higher education, making it even more difficult for scholars to engage in high-quality academic work.
Third, our analysis highlights the critical role of international mobility in enhancing scholarly performance. Internationally mobile scholars consistently outperform their non-mobile peers in both productivity and citation impact, confirming the findings of earlier studies (Dubois et al., 2014; Finocchi et al., 2023; Franzoni et al., 2014; OECD, 2015). Domestic institutional mobility, while offering modest advantages—particularly when compared to non-mobile university scholars-still reflects a relatively limited benefit. This is consistent with previous findings on the modest yet positive effects of national mobility (Deville et al., 2014; Fernández-Zubieta et al., 2016). Nevertheless, a clear hierarchical structure persists: global exposure is associated with a higher impact, while academic immobility, particularly within universities, is linked to lower citation performance.
Importantly, this study contributes to the broader discourse on academic mobility and performance by showing that the benefits of mobility—both national and international—are not uniformly distributed. While international mobility is clearly associated with a higher impact, national mobility within Ukraine does not always yield similar returns, likely due to uniform constraints across domestic institutions.
Declaration
The authors declare no conflicts of interest.
Acknowledgements
The authors are grateful to Jonathan Dudek for assistance in creating the dataset for this study.
Funding information
This project received funding through the MSCA4Ukraine project, which is funded by the European Union.
Author contributions
Myroslava Hladchenko (Email: Myroslava.Hladchenko@uantwerpen.be; ORCID: 0000-0002-2907-5124): Conceptualization, Visualization, Writing - original draft.
Rodrigo Costas (Email: rcostas@cwts.leidenuniv.nl): Supervision, Writing - review & editing.