

1 Introduction
As China accelerates its new industrialization strategy under the digital revolution, the concept of new-quality productive forces has emerged as a pivotal theoretical framework characterizing advanced production modes integrating intelligent technologies, green innovation, and systemic efficiency optimization. This paradigm shift, fundamentally reshaping value creation mechanisms through AI integration, clean energy transition, and cross-domain technological convergence, necessitates corresponding transformations in human capital architecture. Particularly, the development of new-quality productive forces demands not merely incremental skill upgrades but structural reconstitution of talent capabilities, requiring professionals to master interdisciplinary knowledge systems, cultivate adaptive innovation competencies, and operationalize cutting-edge technological literacies. This evolutionary leap from traditional productive models presents both strategic imperatives and systemic challenges for cultivating future-ready talent cohorts capable of driving sustainable technological breakthroughs and maintaining competitive advantages in the global innovation landscape (He, 2024). Meanwhile, scientific and technological talents serve as the core driving force of the national innovation system. As a pivotal hub in the coordinated development of the “trinity” of education, technology, and talent, they acquire solid scientific literacy and innovative capabilities through cultivation within a high-quality education system, thereby emerging as the main practitioners in achieving technological breakthroughs. This necessitates updating the measures and methods guiding talent development and creating an environment conducive to talent growth. High-quality science and technology talent policies are crucial for maximizing the innovative vitality of scientific and technological talents, resolving the contradictions between talent supply and the demand for technological innovation, implementing the strategy for science and technology talents, and fostering a favorable environment for talent development (Hu et al., 2024). In this context, deconstructing the policy guarantees for China’s scientific and technological talents, studying the gaps, redundancies, and flaws in policy design, and optimizing the policy system is a valuable proposition. Therefore, this study proposes a multi-dimensional policy fit analysis framework to identify blind spots in the formulation of China’s science and technology talent policies and the structural defects in the supply-demand matching relationship in talent development. This will help improve the precision and efficiency of government services for talent, reduce policy missteps, lower management costs, and stimulate the innovative potential of scientific and technological talents, thereby providing strong talent support for accelerating the formation of new quality productive forces.
Based on existing research, there are several shortcomings in studies on the fit of talent policies: First, the research dimensions are limited. Current studies primarily conduct quantitative analyses from the dimension of policy coherence (Barry, 2024; Li et al., 2023; Liu et al., 2023; Pan et al., 2023; Zhao et al., 2022), lacking exploration of the embedded relationships between policies and policy systems, as well as the relationships between policy supply and demand. Second, the research perspective is still somewhat constrained. Existing studies mainly analyze the diffusion (Qiu & Shi, 2023) and evolution (Chen et al., 2024; Mu et al., 2022; Yuan et al., 2023; Zhong & Huang, 2022) of talent policies from meso- and micro-level perspectives, alongside the impacts and outcomes of policies (Mea et al., 2016; Zimmermann & Pye, 2018), while lacking a macro-level holistic assessment. Third, there is a notable absence of quantitative research on the fit of talent policies. Current studies primarily rely on qualitative methods, such as policy coding or descriptive analysis (Cao, 2021; Sun et al., 2016; Tao et al., 2018; Wang, 2023), with little attention given to quantitative approaches for analyzing policy fit.
This paper proposes a multidimensional analytical framework for assessing the fit of science and technology talent policies. It seeks to interpret the characteristics and challenges of China’s science and technology talent policies through three dimensions: consistency fit, embedded fit, and compensatory fit. Specifically, this framework examines: the internal coordination of policies (consistency fit), the compatibility between policies and the overarching policy system (embedded fit), and the complementarity between policy supply and talent demand (compensatory fit). By employing quantitative analysis methods, this study aims to contribute to the theoretical research on talent policies, provide methodological insights, and offer practical recommendations for optimizing China’s science and technology talent policy system.
2 Framework for analyzing the fit of talent policies
Fit refers to the relationship or alignment between two phenomena. The concept of fit originates from psychology, where it was first theorized in studies on the person-organization fit. This theory is grounded in Schneider’s ASA (Attraction-Selection-Attrition) framework, which posits that mutual attraction occurs when an individual’s characteristics align with those of the organization, resulting in employee retention. Conversely, when an individual’s values and goals are misaligned with those of the organization, they are more likely to leave (Hu, 2009). Muchinsky and Monahan (1987) further expanded on this framework by introducing the concepts of similarity fit and compensatory fit. Similarity fit occurs when an individual shares common goals, values, or characteristics with the organization, fostering alignment. Compensatory fit, on the other hand, is achieved when the individual provides the organization with essential knowledge and skills, while the organization reciprocates by offering opportunities, rewards, and other benefits, thereby establishing a balance between supply and demand.
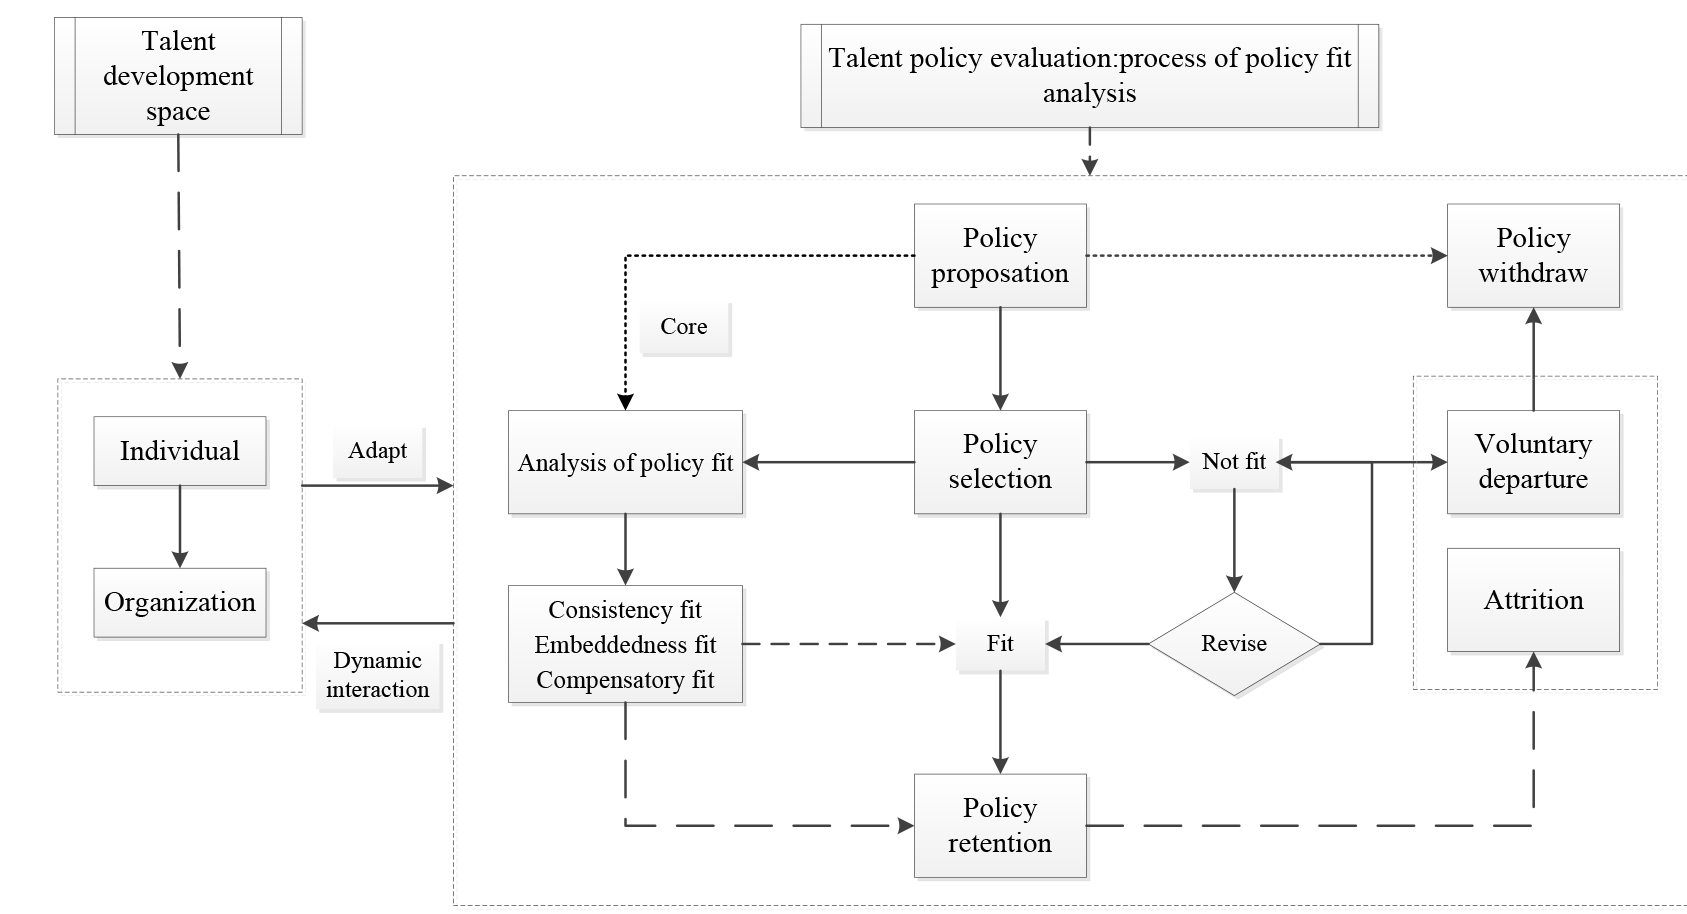
This study draws on the fit theory between individuals and organizational environments in psychology and proposes a Proportion-Selection-Attrition (PSA) analytical framework for evaluating the fit of talent policies (Figure 1). When individuals face challenges requiring solutions in real life, or when the government aims to guide or address talent-related issues through policy implementation, corresponding talent policies are introduced. This process constitutes the proposal of the policy. The policies are then evaluated and filtered based on their rationality and alignment with the goals and needs of talent. Policies that establish a strong fit with talent needs are retained; otherwise, policies may be withdrawn either through voluntary exit or, over time, as a result of declining effectiveness. In this process, policy selection and evaluation are critical, as they determine whether a policy will be retained, revised, or withdrawn. The decision to retain a policy depends on the analysis and measurement of its fit. This study categorizes policy fit into three dimensions: consistency fit, embedded fit, and compensatory fit. Consistency fit refers to the internal alignment of the policy, specifically whether the policy’s goals are consistent with the tools used for its implementation. Embedded fit examines how well the newly introduced policy integrates into the existing policy framework or addresses gaps within it, signifying the alignment between the policy and the broader policy system. Compensatory fit, from the perspective of policy implementation, assesses whether the measures or mechanisms provided by the policy effectively address talent needs or resolve issues, highlighting the fit between the policy’s “supply” and the talent’s “demand”. In the process of constructing the policy system, dynamic interactions occur between talent organizations and the policy environment. On one hand, talent enters and exits organizations and adapts to the policy environment during these interactions. On the other hand, policies create conditions conducive to the survival and development of specific types of talent, collaboratively fostering an environment that supports talent growth and development.
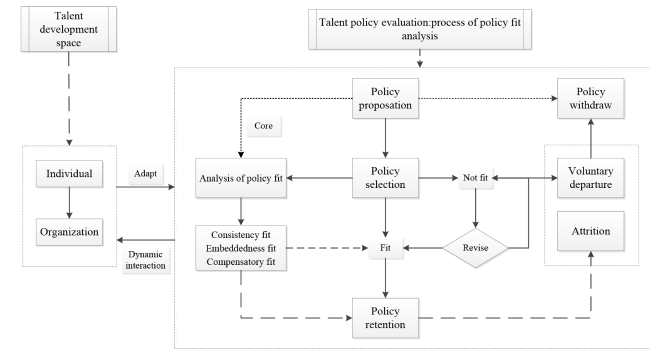
Figure 1. Framework for analyzing the fit of talent policies (PSA). |
3 Materials and methods
The analysis of policy fit comprises two components: the policy analysis module and the talent analysis module. The policy analysis module primarily examines two sub-dimensions: policy supply and policy goals, while the talent analysis module focuses on two sub-dimensions: talent demand and talent goals (Figure 2). These four sub-dimensions form six key interrelationships: the relationship between policy supply and policy goals—If the tools provided by the policy (policy supply) align effectively with its stated objectives (policy goals), consistency fit is achieved; the relationship between policy supply and talent goals—If the policy integrates seamlessly into the broader policy framework and serves as an effective tool for achieving talent goals, embedded fit is established; the relationship between policy supply and talent demand—If the policy supply meets the specific needs of talent (talent demand), compensatory fit is attained; the relationship between policy goals and talent goals—Since policies are inherently designed to achieve talent development goals, there is an automatic fit between these two dimensions; the relationship between policy goals and talent demand—The primary aim of a policy is to address talent demand, which serves as a sufficient condition for policy goals. Thus, an automatic fit exists between these two dimensions; and the relationship between talent demand and talent goals—Talent goals are derived from individual and collective talent needs, with collective needs often reflecting government requirements for talent development. Talent goals are therefore a necessary condition for talent demand, creating an automatic fit between these dimensions.
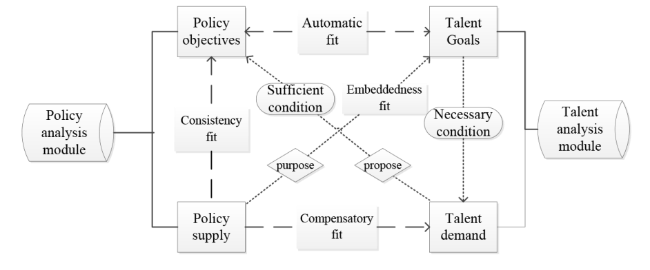
Figure 2. Relationship diagram for analyzing the fit of talent policies. |
3.1 Analysis of policy consistency fit
3.1.1 Quantification of policy instruments
Yang et al. (2018) and Ning and Zhang (2014) have conducted significant research on the policy instruments and policy objectives of talent policies. Building on these studies, this research develops a coding and scoring classification system for policy instruments (Table 1) and policy objectives (Table 2). Talent policy instruments are categorized into seven distinct types. The evaluation and incentive category include policies designed to incentivize talent through financial support, the conferral of titles or honors, and rewards for individual achievements. The management and service category encompasses supportive policies that provide services to talent, including public services such as education and healthcare, financial and funding management mechanisms, protection of intellectual property, institutional measures for talent management, and other strategic management initiatives. The flow and allocation category includes policies that encourage employment, promote industry-university-research cooperation, and other measures that facilitate inter-regional mobility of talent. The introduction and aggregation category refers to policies aimed at attracting both domestic and international talent to meet regional or national needs. The cultivation and development category focus on nurturing talent through the development of infrastructure, the implementation of training programs, and the establishment of comprehensive training systems. The development planning category includes long-term policy measures designed to support the sustained development of talent over time. Lastly, the comprehensive category employs a combination of various policy tools and measures to holistically promote talent development.
Table 1. Policy tool coding and scoring classification system. |
| Primary classification | Secondary classification | Evaluation content |
|---|---|---|
| Evaluation and incentive | Funding Support | Government provides various types of funding and financial support to incentivize talent development. |
| Talent Rewards | Rewards are given based on outstanding performance to motivate talent. | |
| Talent Titles | High evaluations of talent lead to titles being conferred, including designations | |
| Management and service | Public Service Provision | Addressing issues related to education, healthcare, children’s schooling, and social security for talent. |
| Talent Management System | The system and model established by the government for managing talent. | |
| Intellectual Property Protection | Building, standardizing, and improving the intellectual property protection system to safeguard the rights of talent and employers. | |
| Financial and Fund Management | Policies related to finance, taxation, interest subsidies, and fund management. | |
| Strategic Measures | Government formulates strategic measures based on the needs of talent development, including strategic layouts and core tasks. | |
| Flow and configuration | Employment Encouragement | The government encourages employment for college graduates and other talents to promote mobility. |
| Industry-Academia-Research Collaboration | Strengthening regional talent mobility through collaboration among industry, academia, and research. | |
| Inter-Regional Mobility | Policies like the “Three Supports and One Assistance” and Science and Technology Commissioner programs specifically designate talent for mobility. | |
| Import and cluster | Introduction of Foreign Talent | Implementing measures to attract foreign talent. |
| Domestic and International Talent Entrepreneurship | Supporting talent entrepreneurship to achieve talent aggregation. | |
| Training and development | Infrastructure Development | Establishing talent platforms such as training bases, including their application and management. |
| Training Methods | Proposing various methods for talent training, such as attending training courses. | |
| Talent Training System | Establishing a system or model for talent training. | |
| Development planning | Goal Clarity | Planning policies with clearly defined goals. |
| Implement ability of Measures | Measures in the planning are detailed and actionable, not overly vague or broad. | |
| Comprehensive | Department Authority | The more authoritative the department, the better it can coordinate various policy tools from a higher level. |
| Diversity of Measures | The more diverse the policy tools, the stronger the policy effectiveness. |
Table 2. Quantitative scoring standards for policy tools. |
| Scoring | Quantitative scoring standards for policy tools |
|---|---|
| 5 | There are specific policy tools with detailed implementation content. |
| 4 | There are specific policy tools that involve some implementation content. |
| 3 | There are specific policy tools that involve implementation content, but it is somewhat vague. |
| 2 | Policy tools are mentioned, but there is no implementation content. |
3.1.2 Quantification of policy objectives
The National Medium- and Long-Term Talent Development Plan Outline (2010-2020) and the National Talent Development Plan during the 14th Five-Year Plan Period serve as the guiding documents for China’s talent policy. Based on the objectives outlined in these documents—such as expanding the talent pool, enhancing talent quality and capabilities, increasing innovative outputs, promoting talent mobility, and optimizing the talent development environment—the objectives of talent policy can be categorized into five dimensions: increasing the talent scale, improving the quality of talent, enhancing talent effectiveness, increasing talent mobility, and optimizing talent support (Table 3). Increasing the talent scale focuses on the quantitative expansion of the workforce, emphasizing the growth of the talent pool. Improving talent quality aims to enhance the skills, abilities, and qualifications of talent, ensuring a higher standard of individual competency. Enhancing talent effectiveness highlights the socio-economic contributions and innovative outputs generated through talent development, whereas increasing talent mobility underscores the importance of reasonable and orderly movement of talent between regions, promoting balanced regional development. Finally, optimizing talent support emphasizes providing the necessary support and guarantees for talent, including funding, projects, platforms, and other resources critical for talent development. The quantitative scoring criteria for policy objectives are detailed in Table 4.
Table 3. Policy objective coding and rating classification. |
| Primary classification | Evaluation content |
|---|---|
| Increase in Talent Scale | Emphasizes the expansion of the talent pool, increasing the number of talents, and enhancing talent aggregation. |
| Improvement in Talent Quality | Emphasizes the enhancement of the quality and capabilities of the talent workforce. |
| Enhancement of Talent Effectiveness | Emphasizes generating economic and social benefits through talent development, thereby driving regional industrial growth or enhancing innovation capabilities. |
| Increase in Talent Mobility | Emphasizes the orderly and reasonable flow of talents both domestically and internationally, as well as between regions. |
| Optimization of Talent Support | Emphasizes providing funding, infrastructure, projects, and other support for talents. |
Table 4. Quantitative scoring criteria for policy objectives. |
| Scoring | Quantitative scoring standards for policy tools |
|---|---|
| 5 | Clear objectives with specific and detailed content |
| 4 | Clear objectives, involving some content |
| 3 | Clear objectives, but the content is somewhat vague |
| 2 | Clear objectives, but without specific content |
| 1 | Only involves objectives, with no specific content |
3.1.3 Talent demand - objective analysis system
The relationship diagram of talent policy fit demonstrates that talent objectives are a necessary condition for talent demand. Furthermore, the development objectives of talent and policy objectives exhibit an automatic fit relationship, indicating that they should correspond with and complement each other. Based on this relationship, a talent objective analysis system has been developed, as illustrated in Table 5. In terms of talent scale, three indicators are used to represent the scales of primary, intermediate, and advanced talent, reflecting the quantitative aspect of talent development. For talent effectiveness, indicators representing economic benefits, social benefits, and technological transformation benefits have been selected to measure the socio-economic contributions of talent. Regarding talent mobility, three indicators are chosen to reflect inter-regional talent circulation, talent gaps, and talent employment, capturing the dynamics and balance of talent distribution across regions. For talent quality, two indicators are included to assess the levels of basic research talent and technical research talent, focusing on the competence and specialization of the workforce. Lastly, for talent support, two indicators related to medical and cultural support are selected to evaluate the resources and services provided to enhance talent well-being and retention.
Table 5. Talent demand - goal analysis system. |
| Primary classification | Secondary classification |
|---|---|
| Talent scale | Scale of Junior Talent - Number of Graduates from Higher Education Institutions (10,000 persons) |
| Scale of Intermediate Talent - R&D Personnel Full-Time Equivalent (10,000 person-years) | |
| Scale of Senior Talent - Number of Academicians of the Chinese Academy of Sciences (persons) | |
| Talent efficiency | Economic Efficiency - Per Capita GDP (hundred yuan/person) |
| Social Efficiency - Overall Labor Productivity (100 million yuan/10,000 persons) | |
| Technology Conversion Efficiency - Transaction Volume of Technology Market (hundred billion yuan) | |
| Talent mobility | Regional Talent Circulation - Urbanization Rate (%) |
| Regional Talent Disparity - Disposable Income Ratio of Rural and Urban Residents (ratio) | |
| Regional Talent Employment - Ratio of Employment between Urban and Rural Areas (ratio) | |
| Talent quality | Basic Talent - Number of Published Scientific Papers (10,000 papers) |
| Technical Talent - Number of Authorized Invention Patent Applications (items) | |
| Talent support | Medical Support for Talent - Number of Medical and Health Institutions (10,000) |
| Cultural Support for Talent - Number of Public Library Institutions (units) |
3.1.4 Text coding and scoring
This study employed Nvivo software for text coding, establishing primary and secondary classifications of policy tools and policy objectives as coding nodes. Through in-depth analysis of policy documents, content related to talent policies was systematically assigned to the corresponding nodes. To ensure the credibility and validity of the coding results, three researchers independently coded all policy texts. The coding results were then verified using the method described by Wang et al. (2021), which confirmed that the coding demonstrated high reliability.
The scoring of policies was carried out by a scoring group composed of three researchers. After receiving training on a unified scoring standard, group members independently scored 30 policies to ensure consistency in their evaluations. This was followed by the first phase of scoring, where each researcher independently scored all policies. The results revealed that the probability of consistency in scoring policy tools (with a score difference of less than 1) was 67.14%, while the probability of directional conflict (defined as scores falling on either side of the midpoint score of 3) was 28.27%. For policy objectives, the consistency probability was 63.25%, with a directional conflict probability of 21.20%.
The scoring group subsequently convened to discuss discrepancies in policy scores and refine the scoring principles. After revising the scores for policies with inconsistencies, the final consistency probability for policy tools increased to 93.64%, with a directional conflict probability reduced to 1.41%. Similarly, the consistency probability for policy objectives reached 94.35%, with a directional conflict probability of 3.89%. For policies that still exhibited directional conflict, the scoring group conducted additional discussions to reach a consensus. The final score for each policy was determined by taking the mean of the agreed-upon scores.
3.1.5 Quantification of policy consistency fit
In general, the clearer the objectives of a policy and the more specific and detailed the policy instruments employed, the higher the degree of consistency fit. To measure policy consistency fit, this study assumes that the specificity and clarity of policy objectives and instruments result in an exponential increase in policy fit, rather than a simple additive relationship where a one-point increase in the policy objective score corresponds to a one-point increase in the fit score. Accordingly, the degree of consistency fit is quantified using formula (1), where CONt represents the consistency fit level of policies in year t, POl(t) denotes the objective score of policy l in year t, PTl(t) indicates the instrument score of policy l in year t, and N represents the total number of policies in year t.
$C O N_{t}=\frac{1}{N} \sum_{l}^{N} P O_{l}(t) \times P T_{l}(t) \quad l=1 \ldots N$
3.2 Analysis of policy embeddedness fit
From the perspective of policy system construction, a newly introduced policy should seamlessly integrate into the existing policy framework. Such integration is critical for the continuous improvement of the policy system, facilitating a comprehensive structure that aligns with the objectives of talent development. Isolated or singular policies often lack effectiveness, as they fail to generate the spillover effects that arise from the interconnections and complementarities within a cohesive policy framework. The talent policy system is inherently complex and difficult to fully assess, exhibiting the characteristics of a gray system. To address this complexity, this study employs a system coupling model based on gray relational analysis to evaluate the degree of integration and interconnectedness within the talent policy system.
Taking 2014 as the base year for the policy system, and considering that all collected policies remain currently effective, the policy system for a given year is composed of the policies introduced in that year in conjunction with the existing framework. From the perspective of overall system integrity, a lower coupling degree indicates better policy embeddedness. In other words, well-integrated policies enhance the overall cohesion of the system, whereas a higher coupling degree reflects poor embeddedness and a weaker fit within the policy framework.
Given that the original data dimensions differ, we first perform a dimensionless treatment on the data. Let $X_{1}, X_{2}, \ldots X_{i}(i=1,2, \ldots, n)$ be the sub-tool of the talent policy instruments, with its value in year t denoted as $x_{i}(t)(t=1,2, \ldots, T)$. The standardized data is represented as $x_{i}^{\prime}(t)=\frac{x_{i}(t)-\min _{t} x_{i}(t)}{\max _{t} x_{i}(t)-\min _{t} x_{i}(t)}$. Let $Y_{1}, Y_{2}, \ldots Y_{k}(k=1,2, \ldots, p)$ be the primary sub-goal of the talent objectives, where Ykj denotes the secondary sub-goal j under the primary sub-goal k, and the value of the secondary sub-goal in year t is $y_{k j}(t)(t=1,2, \ldots, T)$, with its standardized data represented as $y_{k j}^{\prime}(t)=\frac{y_{k j}(t)-\min _{t} y_{k j}(t)}{\max _{t} y_{k j}(t)-\min _{t} y_{k j}(t)}$. The correlation coefficient between the policy sub-tool Xi and the talent objective Ykj in year t is given by:
$\gamma_{i j}^{k}(t)=\frac{\min _{i, j, t}\left|x_{i}^{\prime}(t)-y_{k i}^{\prime}(t)\right|+\rho \max _{i, j, t}\left|x_{i}^{\prime}(t)-y_{k j}^{\prime}(t)\right|}{\left|x_{i}^{\prime}(t)-y_{k j}^{\prime}(t)\right|+\rho \max _{i, j, t}\left|x_{i}^{\prime}(t)-y_{k j}^{\prime}(t)\right|}$
where ρ∈(0,1) typically takes a value of 0.5. A stronger correlation indicates a higher contribution of the policy tool to the talent objective. The contribution of Xi to Ykj in year t can be expressed as:
$R_{i}^{k}(t)=\sqrt[j]{\gamma_{i 1}^{k}(t) \times \gamma_{i 2}^{k}(t) \times \cdots \times \gamma_{i j}^{k}(t)}$
Given the differences in contribution among various policy subsystems to different talent objectives, a smaller variance indicates a better coupling effect. Therefore, the coupling degree of the policy subsystem to the talent sub-goal can be represented as:
$C(t)=\sqrt{\frac{1}{p} \sum_{k=1}^{p}\left(\lambda_{k}(t)-\bar{\lambda}(t)\right)^{2}}$
where $\lambda_{k}(t)=\sqrt{\left(R_{1}^{k}(t)\right)^{2}+\left(R_{2}^{k}(t)\right)^{2}+\cdots\left(R_{i}^{k}(t)\right)^{2}}$.
3.3 Analysis of policy compensatory fit
The degree of policy compensatory fit indicates the extent to which the “supply” of policies enjoyed by talent aligns with their demand.
$\xi_{s d}=\cos \left(\theta_{s d}-45^{\circ}\right), \quad \theta_{s d} \in\left[90^{\circ}\right]$
where $\cos \theta_{s d}(t)=\frac{\sum_{k=1}^{p} y_{k}^{\prime}(t)}{\sqrt{\left(\sum_{l}^{N} P T_{l}^{\prime}(t)\right)^{2}+\left(\sum_{k=1}^{p} y_{k}^{\prime}(t)\right)^{2}}}$, PTl′(t) represents the standardized score of policy tools for year t with the standardization method being the same as that for xi(t). $\sum_{l}^{N} P T_{l}^{\prime}(t)c$ indicates the policy supply situation in year t, while $ \sum_{k=1}^{p} y_{k}^{\prime}(t)$ reflects the talent demand situation in year t.
Let Ψsd be the environmental variable. When the policy supply exceeds the talent needs, it is recorded as -1, indicating that θsd>45°. Conversely, when the policy support is less than or equal to the talent needs, it is recorded as 1, indicating that θsd≤45°.
3.4 Calculation of fit degree for science and technology talent policies
A higher value of consistency fit and compensatory fit for science and technology talent policies indicates a greater degree of fit, while a lower value of embeddedness fit reflects better integration. Accordingly, the final fit score for science and technology talent policies is calculated by subtracting the embeddedness fit value from 1, and then summing this adjusted value with the consistency fit and compensatory fit values.
4 Empirical analysis of the fit degree of China’s talent policies
4.1 Data and sample
The policy texts analyzed in this study were sourced from publicly available science and technology talent policies in China issued between 2014 and 2023. The following selection criteria were applied during the data collection process: First, only policies explicitly addressing talent-related issues were included, while documents with partial or peripheral discussions on talent were excluded. Second, only policies applicable at the national level were collected, excluding those targeting specific regions. For instance, policies such as the “Notice from the Ministry of Finance and the State Taxation Administration on Personal Income Tax Policies for High-end and Scarce Talent in the Hainan Free Trade Port” were not included. Third, the selection was limited to normative administrative documents, work plans, implementation schemes, and similar policy types. Fourth, outdated policies were excluded to ensure that only currently valid policy documents were analyzed, with the most recent versions of policies being used. Based on these criteria, a total of 283 valid policy documents were obtained for analysis.
4.2 Overall policy analysis
Using the TF-IDF algorithm to extract keywords from policy documents and analyzing them with VOSviewer software, this study reveals that China’s talent policies from 2014 to 2023 primarily emphasize talent cultivation, training, evaluation, and the graduation and entrepreneurship of university students. The key government departments responsible for issuing these talent policies include the Ministry of Education, the Ministry of Finance, the Ministry of Human Resources and Social Security, the Ministry of Industry and Information Technology, and the Ministry of Science and Technology.
In terms of the evolution of policy fit, the overall fit degree of China’s science and technology talent policies has exhibited an upward trend from 2014 to 2023, increasing from 12.42 in 2014 to 16.66 in 2023. However, the year 2018 marked a trough in policy fit despite the highest number of science and technology talent policies being issued that year. A retrospective analysis of the policy content indicates that, while 2018 witnessed significant attention to the development of science and technology talent—with numerous policies introduced covering areas such as talent selection, funding, rewards, training, the establishment of effective talent management mechanisms, and improvements to talent compensation—these policies faced challenges in quality. Specifically, the prevalence of macro-level guiding opinions and insufficient feasibility for practical implementation led to a lower consistency fit score, ultimately affecting the overall policy fit score. Post-2018, although the number of talent policies issued in China declined, the fit degree displayed a consistent upward trend (Figure 3). This trend is also consistent with China’s actual conditions in different periods. Before 2018, the size of China’s scientific and technological talent pool was not large, so the focus of talent policies was on “expanding the quantity”. The 4th National Survey on the Status of Science and Technology Workers released by the China Association for Science and Technology in 2018 showed that 45.9% of science and technology workers believed that the problem of irrational orientation in scientific and technological evaluation was prominent. In response, multiple government departments began to intensively introduce policies aimed at “breaking the four-onlys” (over-reliance on academic papers, professional titles, academic qualifications, and awards). However, the initial policies were mainly principle-based requirements.
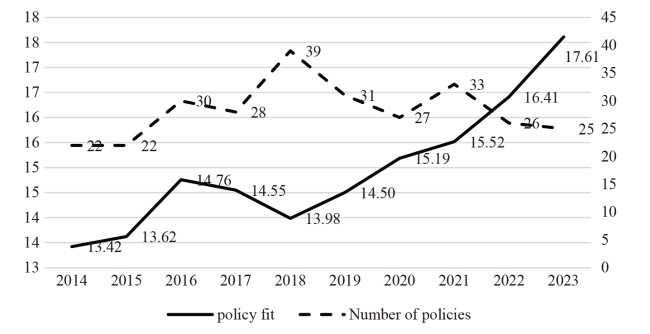
Figure 3. Evolution of the fit of China’s science and technology talent policy. |
4.3 Analysis of policy fit evolution
The consistency of policy fit has increased year by year, evolving from universality to targeted breakthroughs; however, there are still gaps in the application of policy tools. From 2014 to 2023, the consistency fit of China’s science and technology talent policies has shown a continuous upward trend, increasing from 11.71 points in 2014 to 15.64 points in 2023 (Figure 4). This reflects a growing alignment between policy tools and the intended goals of science and technology talent policies, demonstrating ongoing improvements in policy quality. However, gaps in the application of certain policy tools remain evident. The use of policy tools has varied across different periods, highlighting the evolving focus of talent development in China. Between 2014 and 2018, the most frequently employed policy tools were those related to talent cultivation and development. In contrast, tools for talent introduction and aggregation, as well as development planning, were less frequently utilized. During this period, China primarily implemented cultivation plans and specific training programs to enhance the overall technical capabilities of its talent pool. From 2019 to 2021, policies related to evaluation and incentives surpassed those focused-on cultivation and development, becoming the primary instruments in China’s science and technology talent strategy. Key measures during this period included providing financial support for talent, improving talent evaluation systems, reforming the professional title system, and selecting outstanding talent. These efforts aimed to address systemic issues in talent evaluation and enhance the selection and motivation of exceptional talent, marking a shift from the relatively universal talent policies of the previous period to a more targeted focus on high-performing individuals.
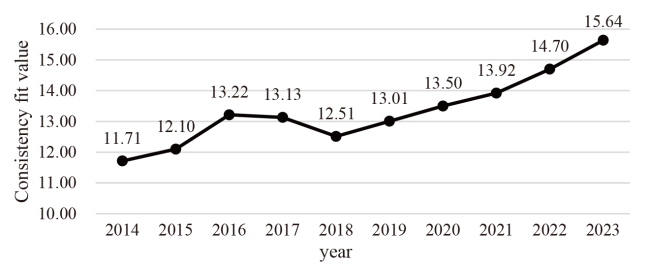
Figure 4. Consistency fit value of China’s science and technology talent policy. |
Post-2022, the application of policy tools became more balanced, with notable increases in management and service policies, as well as policies related to mobility and allocation, compared to the previous two periods. Policies issued during this time were more detailed and specific. Despite these advancements, policies focused on talent introduction, aggregation, and development planning remained underutilized compared to other tools. In terms of policy objectives, little variation is observed across different periods, with a consistent focus on supporting talent and improving talent quality. This reflects the sustained priority of these goals within China’s science and technology talent policy framework.
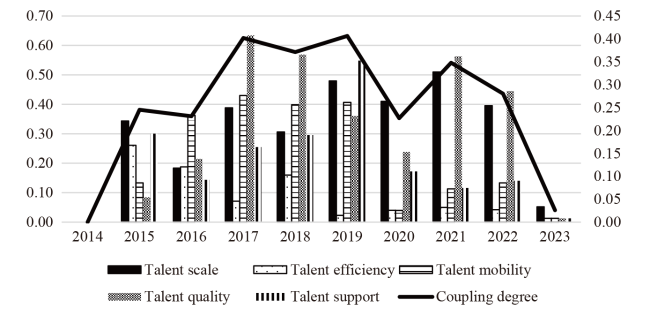
The fit of policy embedding has shown fluctuations, and the policy system is dynamically improving; however, there are still some areas where goal coupling is suboptimal. As shown in Figure 5, the embedding fit of China’s science and technology talent policies exhibits significant fluctuations across different years. Using 2014 as the baseline year, with its value set at 0, the evolution of embedding fit from 2015 to 2022 reveals a dynamic pattern of both increases and decreases. Notably, between 2017 and 2019, policy embedding showed a relatively poor performance, following an M-shaped trajectory. The decline in embedding fit during this period can be attributed to the continuation of certain policies from 2017 into 2018, which led to stronger integration within the existing framework. For instance, the international selection and training policy for high-end accounting talent and the policy for leading talent in the management of small and medium-sized enterprises were directly inherited from 2017’s framework, resulting in improved policy embedding. In contrast, the introduction of major reforms to talent evaluation systems and mechanisms in 2019 diverged significantly from the existing policy framework, leading to a reduction in embedding fit for that year. From 2021 to 2023, the embedding of policies has shown a notable increase, suggesting that China’s science and technology talent policy system has undergone continuous dynamic improvement between 2014 and 2021. During this period, the system actively explored and refined its policy mechanisms for talent, resulting in fluctuations in embedding fit. After 2021, the policy system reached a more mature and stable state. However, regarding specific objectives, the degree of goal coupling within the talent policy system varies significantly. Overall, coupling is strongest in terms of talent effectiveness, followed by talent support, and then talent mobility. By contrast, the coupling related to talent scale and talent quality remains suboptimal. Specifically, while China’s science and technology talent policies have been effective in driving local economic and social development through talent-related initiatives, their impact on expanding the talent pool and enhancing individual abilities has been relatively limited. Furthermore, an analysis of policy consistency reveals that these policies predominantly aim to enhance talent quality and provide talent support. However, a gap exists between the intended goals of the policies and their actual outcomes, particularly regarding talent scale and quality. Additionally, the degree of goal coupling is influenced by the differential contributions of various policy tools. From the perspective of policy contributions to talent development goals, introduction and aggregation policies and development planning policies make relatively smaller contributions compared to other tools. This underscores the need for the introduction of more robust and impactful policies to address these gaps effectively.
Figure 5. Embedded fit Value of China’s science and technology talent policy. |
The degree of policy compensatory fit has increased year by year, with supply and demand matching becoming more consistent; however, the policy supply still cannot meet talent demand. From 2014 to 2023, the compensatory fit value of China’s science and technology talent policies has steadily increased, rising from 0.707 in 2014 to 0.999 in 2023 (Table 6). This trend indicates that, after a decade of evolution, the alignment between policy supply and talent demand has generally improved, achieving a relatively high degree of matching. For example, in 2022, eight departments including the Ministry of Science and Technology launched a pilot program for reforming talent evaluation, designating 6 regional entities and 21 universities and research institutions, including Tsinghua University, as pilot sites. Tsinghua University abolished quantitative indicators for academic papers and shifted to evaluating “representative achievements.” This initiative supported Chen Haodong’s team in overcoming the bottleneck in plant gravity sensing research, with the relevant results published in the journal Cell. However, throughout this period, the environmental variable values have consistently remained at 1, signaling that the current supply of talent policies is still insufficient to fully meet talent demand. This finding underscores the need for continued enhancement of policy support for science and technology talent. In terms of the matching degree between policy supply and specific talent demands, there is minimal variation across different talent dimensions. The compensatory fit of China’s science and technology talent policies for talent scale, talent quality, talent effectiveness, talent mobility, and talent support remains relatively stable, fluctuating around 0.75. When analyzed by policy tool type, evaluation and incentive policies and training and development policies exhibit the highest degree of alignment with talent demand. These are followed by management and service policies, while introduction and aggregation policies and development planning policies show lower degrees of fit. These findings highlight areas where greater emphasis on targeted policy adjustments and enhancements is needed to address the evolving demands of science and technology talent.
Table 6. Evolution of compensatory fit value in China’s science and technology talent policy. |
| Year | Value of compensatory fit | Year | Value of compensatory fit |
|---|---|---|---|
| 2014 | (0.707, 1) | 2019 | (0.902, 1) |
| 2015 | (0.767, 1) | 2020 | (0.911, 1) |
| 2016 | (0.774, 1) | 2021 | (0.944, 1) |
| 2017 | (0.821, 1) | 2022 | (0.992, 1) |
| 2018 | (0.842, 1) | 2023 | (0.999, 1) |
5 Conclusion and policy recommendations
After a decade of development, China’s science and technology talent policy system has essentially established a relatively stable framework. Both the consistency fit and compensatory fit values of the policies exhibit an upward trend, reflecting an improvement in the quality of China’s science and technology talent policies. However, certain shortcomings persist in the formulation and implementation of these policies, as detailed below:
(1) Limited Use of Development Planning Policy Tools: The utilization of development planning policy tools remains relatively limited, resulting in a lack of comprehensive top-level design for talent development. Instead, fragmented and piecemeal policy measures are frequently employed. This shortfall is one of the key reasons why the goal of improving talent quality in China has not been effectively achieved.
(2) Discrepancy in Policy Tool Usage: A significant imbalance exists in the application of policy tools, with training and development tools being used more frequently, while introduction and aggregation policies, as well as development planning policies, are comparatively underutilized. The insufficient use of introduction and aggregation policy tools is a major factor hindering the realization of the goal to expand the talent pool as envisioned in China’s talent policies. Furthermore, the content of existing introduction policies reveals a stronger focus on the recruitment of domestic talent, with less emphasis on attracting international talent. While there is substantial attention given to attracting talent for innovation and entrepreneurship, the introduction of high-level talent remains a lower priority.
(3) Gap Between Policy Goals and Actual Outcomes: A noticeable gap exists between the stated goals of policy implementation and their actual effects. For example, while China’s science and technology talent policies aim to enhance talent quality, the outcomes have been suboptimal, indicating that the measures and intensity of tools designed to improve talent quality require further strengthening.
(4) Mismatch Between Policy Supply and Talent Demand: Although China has implemented numerous policies to support talent development, data indicates that a gap persists between policy supply and talent demand. This issue warrants significant attention in the future development of China’s science and technology talent policies. As the scale and capabilities of the talent pool continue to grow, the nature of talent demand is also evolving. On one hand, the coordinated use of multiple policy tools should be prioritized to achieve the goals of expanding the talent pool and enhancing talent quality. On the other hand, a detailed analysis of talent demand should be conducted. Strengthening protections for talent in areas such as knowledge, living conditions, services, and institutional support is essential for transitioning from a general talent base to a higher-quality talent pool.
This paper introduces, for the first time, a policy fit analysis framework, addressing a gap in the study of policy alignment. The evaluation of science and technology talent policies is conducted across three dimensions: the rationality of policy formulation, the integration of policies into existing frameworks, and the alignment between policy supply and talent demand. This approach not only provides new perspectives and methodologies for policy evaluation, expanding the scope of existing policy analysis (Theis & White, 2021; Whitsel et al.,2024), but also offers meaningful guidance for policymakers and relevant administrative personnel.
Based on the findings of this study, the following three recommendations are proposed. First, talent policies should be iteratively upgraded to align with the country’s strategic objectives and developmental directions. These policies should focus on fostering long-term growth for talent and providing sustained guidance that aligns with national developmental priorities. Secondly, drawing on the methods employed by leading scientific nations to cultivate, attract, and retain top talent, a multifaceted approach should be adopted. This includes implementing diverse policy measures, enhancing mechanisms for international academic exchanges, and significantly improving the scientific research and technical capabilities of scientific and technological talent. Thirdly, backward analysis from specific metrics and data should be used to identify the driving needs of talent. Efforts should be made to enhance the precise assessment and alignment of talent requirements in the new era. Establishing a comprehensive talent database and service system would enable the collection, analysis, and application of relevant data, achieving precision in addressing talent demands and continuously improving the scientific management of talent initiatives.
However, this study has certain limitations. The framework of policy fit analysis proposed by the study can only analyze policies at the same level. For example, this framework can be used to analyze national talent policies or talent policies in a certain region, but it cannot conduct cross-level analysis. To make up for this deficiency and provide a more regional perspective analysis tool for subsequent research and policy formulation, we will try to construct an analysis framework including “regional characteristics”, “technological innovation demand”, “science and technology talent demand”, “policy supply” and their “adaptability” in the future, in order to more systematically understand the profound impact of regional differences on the effectiveness of science and technology talent policies. In the empirical analysis, the policy texts analyzed were limited to publicly available documents.
The exclusion of unpublished policies may introduce some degree of bias into the results. For international readers, the accelerating pace of globalization has made transnational policy collaboration increasingly important. By analyzing the fit of policies across nations, scholars can identify both the potential and challenges of international cooperation, thereby fostering global efforts to address transnational issues such as climate change and economic crises.
Funding information
This work was supported by Science and Technology Plan Project in Sichuan Province (No.2025NSFSCR0002), Special Talent Project of Chinese Academy of Sciences Youth Innovation Promotion Association (No.2023183).
Author contributions
Kaile Wang (wangkl@clas.ac.cn): Conceptualization, Data curation, Formal analysis, Funding acquisition, Investigation, Methodology, Project administration, Software, Visualization, Writing - original draft;
Yunwei Chen (chenyw@clas.ac.cn): Conceptualization, Funding acquisition, Project administration, Supervision, Writing - review & editing.