

1 Introduction
The intensifying global technology competition and accelerating value chain restructuring have elevated regional collaborative innovation to a strategic imperative for national competitiveness (Autio et al. 2018; Granstrand & Holgersson 2020; Porter 1998). Contemporary innovation increasingly depends not on isolated organizational capabilities, but on the capacity to coordinate knowledge flows, resource complementarity, and risk sharing among heterogeneous actors within regional ecosystems (Nan & Huang 2025; Powell et al. 1996; Spigel & Harrison 2018). This shift has prompted a fundamental reorientation in innovation research: from viewing regional innovation performance as a direct outcome of resource endowments or policy intensity (Romer 1990; Lucas 1988), to understanding how dyadic cooperation choices aggregate through micro-level decision rules into meso- and macro-level network structures (Watts & Strogatz 1998; Barabási & Albert 1999; Jackson et al. 2017). The resulting network configurations, characterized by patterns such as core-periphery hierarchies, clustering tendencies, and small-world properties, ultimately determine a region’s capacity for knowledge recombination, technological breakthroughs, and adaptive resilience (Boschma et al. 2015; Vespignani 2018; Golra et al. 2024).
However, the formation of effective collaborative innovation networks is neither automatic nor easily engineered (Grabher 1993; Rodríguez-Pose & Wilkie 2019). Despite substantial investments in R&D infrastructure, policy incentives, and institutional frameworks, many regions struggle to translate material inputs into structurally diverse, exploration-oriented cooperation patterns (Tödtling & Trippl 2005; Balland et al. 2019). Instead, observed networks often exhibit elite concentration, community closure, and limited cross-boundary recombination, suggesting that underlying formation mechanisms may systematically favor exploitation over exploration (March 1991), homophily over heterophily (McPherson et al. 2001), and path dependence over structural adaptation (Arthur 1994; Boschma et al. 2015).
The Guangdong-Hong Kong-Macao Greater Bay Area (GBA) provides a uniquely information-rich case for studying these formation mechanisms. Carrying a dual mandate – serving both as a national technology generation platform and as an experimental zone for higher-level institutional opening (Yang 2005; Li & Bathelt 2018) – the GBA has witnessed unprecedented expansion in cross-border laboratories, joint R&D infrastructure, and patent collaboration applications over the past 15 years (Tang & Zhang 2022). Figure 1 illustrates the evolution of innovation cooperation networks in the GBA from 2009 to 2023, showing substantial growth in both network scale and institutional diversity. However, this intensive material and institutional support investment has not fully translated into the broad, heterogeneous, structurally exploratory cooperation patterns envisioned by policy designers (Lundvall & Johnson 1994; Flanagan et al. 2011). Observed networks still exhibit elite concentration, community closure, and constrained cross-type recombination characteristics, raising fundamental questions about the persistence of underlying formation mechanisms (Feldman & Lowe 2015).
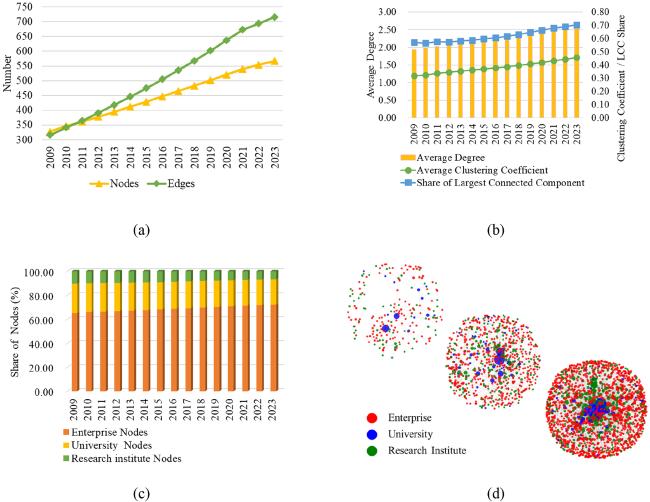
Figure 1: Evolution of collaborative innovation networks in the GBA (2009–2023). (a) Annual counts of nodes (innovation actors) and edges (collaboration ties) showing the temporal expansion of the observed network. (b) Time series of structural metrics: average degree, average clustering coefficient, and share of the largest connected component. (c) Annual proportional shares of the three actor categories: enterprises, universities, and research institutes. (d) Conceptual schematic illustrating the qualitative stages of network development and increasing structural consolidation. |
The selection of the GBA is based on theory-driven sampling (Eisenhardt & Graebner 2007; Flyvbjerg 2006), as it exhibits four characteristics that can amplify competitive mechanism information and provide upper-bound tests of their resilience. First, significant institutional heterogeneity under the “One Country, Two Systems” framework – with differentiated legal, customs, and financial systems – may exacerbate trust-based closure and homophily incentives (North 1990). Second, the diversified combination of actor types and technological domains (advanced manufacturing, information and communication technology, biomedicine, new energy, digital content, internationalized universities) increases the potential occurrence rate of open two-paths across different communities (Burt 1992; Granovetter 1973). Third, concentrated policy interventions around identifiable inflection points (particularly 2015 and 2019) enable phase segmentation to detect mechanism reconfigurations under different policy regimes (Pierson 2000). Fourth, rapid network expansion allows for distinguishing between scale-driven surface changes and genuine persistence of micro-level decision rules (Kivelä et al. 2014). If strong closure, pronounced homophily, and limited bridging persist under these favorable mixed conditions, their resilience across different regional contexts may be high.
Research on collaborative innovation network formation has made significant advances across multiple theoretical traditions. Network formation mechanism studies have identified key drivers, including preferential attachment (reputation and scale-driven cumulative advantage), triadic closure (trust formation and risk reduction), structural hole bridging constraints (transaction hazards and embedding requirements), organizational homophily (friction minimization and cognitive proximity), and experience-driven cumulative advantage (cooperative experience as both capability development and reputation signaling mechanisms). Complementary research on regional innovation network structures has documented core-periphery patterns (Borgatti & Everett 2000), clustering tendencies, small-world characteristics, and their impacts on knowledge spillovers and cross-boundary cooperation (Jaffe et al. 1993; Audretsch & Feldman 1996; Chong & Liu 2024). The integration of social network analysis with innovation research has further advanced understanding of how network positions affect innovation performance (Ahuja 2000) and how policy interventions reshape cooperation patterns (Breschi & Malerba 2001; Nambisan et al. 2019).
Despite these advances, five critical gaps limit our understanding of collaborative innovation network formation, particularly in complex multi-jurisdictional environments. First, descriptive dependence persists: many studies present degree distributions, clustering coefficients, community partitions, or core-periphery diagnostics without statistically evaluating the mechanisms that generate these configurations (Wasserman & Faust 1994; Cranmer et al. 2017). Second, mechanism fragmentation is prevalent: preferential attachment, closure, homophily, and bridging constraints are often modeled separately, limiting comparison of their marginal contributions and potential interactions (Snijders et al. 2006; Block et al. 2018). Third, the relative explanatory weights of endogenous structural dependencies (such as closure) versus exogenous attribute preferences (such as homophily) are insufficiently decomposed within unified inference frameworks (Lusher et al. 2013; Leifeld et al. 2018), weakening policy guidance on whether to target structural reshaping or attribute barrier reduction. Fourth, temporal reconfiguration testing under different policy phases is insufficient; few longitudinal designs test whether mechanism strengths shift at policy inflection points rather than merely scaling with network size (Snijders et al. 2010). Fifth, evidence from high-complexity environments, where multiple mechanisms operate simultaneously and are empirically distinguishable, remains scarce, limiting generalizability to multi-actor, multi-jurisdictional contexts increasingly relevant to regional innovation policy (Cantner & Graf 2006).
This study addresses these gaps by developing and testing a multi-mechanism framework for collaborative innovation network formation in complex regional environments. We conceptualize the evolution of the GBA collaborative innovation network as shaped by two classes of mechanisms: (1) endogenous structural mechanisms, including preferential attachment, triadic closure, and structural hole bridging constraints; and (2) exogenous selection mechanisms, particularly organizational type homophily and experience-driven cumulative advantage. Using a longitudinal patent collaboration application dataset covering 2009–2023, containing 3,582 innovation actors and 57,846 collaborative relationships, we employ Exponential Random Graph Models (ERGMs) to jointly estimate multiple mechanisms across three distinct policy phases while accounting for endogenous dependencies.
We address five research questions: (RQ1) Does the GBA collaborative innovation network exhibit pronounced preferential attachment patterns, where new collaborative ties are more likely to form with actors already possessing a high reputation and dense connections rather than through random diffusion? (RQ2) In the context of cross-jurisdictional institutional frictions, is the tendency for actors sharing collaboration partners to form new relationships significantly higher than for actors without common partners, reflecting pronounced triadic closure mechanisms? (RQ3) Are actors in the GBA network less likely to form direct ties across structural holes, preferring instead to establish bridging through intermediary closure support, reflecting contextual transaction risk constraints on structural hole bridging? (RQ4) Is the probability of collaborative tie formation between same-type organizations significantly higher than cross-type collaboration, indicating the role of organizational homophily in reducing coordination costs and governance frictions? (RQ5) Does actors’ cooperative experience positively correlate with new partnership formation, with this effect further intensifying at higher experience levels, reflecting experience-driven cumulative advantage mechanisms?
This study contributes in four ways. Theoretically, it advances a multi-mechanism perspective by jointly quantifying endogenous and exogenous drivers, refining the complex dynamics of network formation through concepts of structural hole bridging constraints and experience-driven cumulative advantage. Methodologically, it implements a phased longitudinal ERGM design that separates the action strengths of different mechanisms while maintaining cross-period parameter comparability. Empirically, it provides a fifteen-year multi-actor mechanism profile for a high-complexity cross-jurisdictional Chinese mega-region, offering a reference case for the resilience of closure, homophily, and bridging constraints. Policy-wise, it shifts focus from general network expansion to targeted interventions: reducing search and compliance costs for cross-type cooperation, balancing preferential attachment with peripheral diffusion, and establishing unified cross-jurisdictional reputation systems to promote experience sharing and weaken homophily lock-in.
The remainder of this paper is organized as follows. Section 2 develops the theoretical framework and hypotheses. Section 3 describes the data, variable operationalization, and ERGM specifications. Section 4 reports the estimation and robustness results. Section 5 discusses the theoretical and policy implications.
2 Theoretical Analysis and Research Hypotheses
2.1 Institutional Fragmentation and the Cost-Filtering Premise
The GBA collaborative innovation network spans heterogeneous legal regimes, intellectual property enforcement practices, capital mobility arrangements, and divergent administrative incentive systems. This institutional fragmentation raises two categories of collaboration costs: (1) ex ante search, screening, and credibility assessment, and (2) ex post contracting, coordination, monitoring, and compliance. Under elevated coordination uncertainty, organizations rarely pursue indiscriminate densification; instead, they conserve managerial and relational resources through a layered cost-filtering logic. Four interrelated filtering dimensions emerged:
Status/visibility: accumulated partnerships signal coordination capacity, absorptive competence, and legitimacy.
Structural embeddedness: local clustering (closed triads) dampens opportunism and facilitates tacit diffusion, while selectively retained open two-paths sustain cross-module- knowledge recombination potential.
Organizational type homophily: enterprises, universities, and research institutes differ in incentive horizons, appropriation logics, and governance routines; within-type- matching reduces negotiation and interpretive frictions.
Collaborative experience capital: breadth (diversity across partner types) and depth (repeat engagements) encode routinised collaborative capability and reliability distinct from mere tie volume.
2.2 Coupled Mechanism Framework
Building on these filtering dimensions, we propose a coupled framework that operationalizes how institutional fragmentation shapes network formation through two complementary mechanisms: endogenous structural reinforcement and exogenous selection biases.
2.2.1 Endogenous Structural Reinforcement
Preferential attachment: cumulative advantage whereby existing prominence increases marginal tie acquisition probabilities.
Triadic closure: formation of ties among partners of partners fosters trust, sanctioning capacity, and tacit knowledge exchange under enforcement frictions.
Selective brokerage retention: not all open two-paths are closed; strategically valuable bridging channels are preserved to enable cross-module recombination.
2.2.2 Exogenous Selection Biases
Organizational type homophily: cognitive, contractual, and temporal alignment within type lowers coordination and appropriation hazards.
Collaborative experience capital: path dependent accumulation of partnership breadth (diversity across partner types) and depth (repeat engagements) that signals reliable coordination capability and reduces partner selection uncertainty.
2.3 Mechanism Derivations and Hypotheses
The coupled framework outlined above motivates five complementary hypotheses. Rather than staking out competing causal claims, each traces a short arc: a contextual constraint shapes incentives, a mechanism channels those incentives, and a discernible network imprint follows.
2.3.1 Expansion Dynamics and Preferential Attachment
Foundational research on network growth shows that when actors face quality uncertainty and non-trivial downside risk, new ties are rarely formed through random diffusion; instead, they concentrate around visibly reputable and already well-connected partners whose prior collaboration records act as credible signals that screen adverse selection and reduce coordination and enforcement costs (Barabási & Albert 1999; Spence 1973; Podolny 2001; Granovetter 1985). In the GBA, cross-border research collaboration must navigate heterogeneous regimes for data governance, ethical review, funding allocation, auditing, and intellectual property arrangements. These layered procedural frictions elevate the premium on partners that demonstrate procedural fluency, reliable execution, and translational capacity across institutional contexts. As a result, new collaborative ties tend to gravitate toward already visible, collaboration-tested organizations, producing an expansion pattern characterized by preferential attachment rather than diffuse relational dispersion.
H1: In the GBA innovation collaboration network, new collaborative ties are more likely to form with already reputable and densely connected actors, reflecting an expansion dynamic driven by preferential attachment.
2.3.2 Triadic Closure and Credible Knowledge Exchange
The triadic closure perspective argues that shared third-party partners create a micro-structure of implicit monitoring, behavioral predictability, and sanction potential that lowers opportunism and communication frictions, thereby facilitating the transfer of tacit and context-dependent knowledge (Coleman 1988; Uzzi 1997; Reagans & McEvily 2003). In a cross-jurisdictional setting such as the GBA, where legal frameworks, evaluative logics, and compliance routines are still aligned, indirect endorsement via common partners substitutes, in part, for direct experiential verification. Shared collaborators effectively pre-validate procedural reliability and interpretive frames, reducing the search, negotiation, and early-stage monitoring costs of initiating new ties.
H2: In the GBA innovation collaboration network, actors that share existing collaboration partners are more likely to form new ties, indicating a pronounced tendency toward triadic closure.
2.3.3 Structural Hole Bridging Constraints
While occupying open two-paths (structural holes) can, in principle, confer information diversity and brokerage advantages (Burt 1992), the immediate formation of such unembedded bridging is sensitive to contextual transaction hazards. Under conditions of regulatory heterogeneity, compliance ambiguity, and coordination complexity (Powell 1990), initiating a direct bridge without intermediary social embedding amplifies semantic misalignment risk, procedural delay, and reputational exposure. In the current evolutionary stage of the GBA’s cross-border research regime, where data transfer approvals, ethical standards, funding disbursement logics, and intellectual property allocation practices continue to converge, actors have incentives to defer or indirectly route unembedded bridging attempts until some form of relational or procedural buffering can be established.
H3: In the GBA innovation collaboration network, actors are less likely to form direct ties across structural holes without intermediary closure support, reflecting contextual constraints on structural hole bridging.
2.3.4 Organizational Homophily and Friction Minimization
Research on homophily shows that similarity in cognitive frames, incentive systems, and procedural rhythms reduces encoding/decoding losses and governance frictions, enhancing collaboration efficiency (McPherson et al. 2001). Complementary insights from absorptive capacity and multi-dimensional proximity studies indicate that organizational and cognitive proximity accelerate external knowledge recognition and integration (Cohen & Levinthal 1990; Boschma 2005). In the GBA, universities, clinical institutions, platform enterprises, manufacturing incumbents, deep-tech start-ups, and public research entities differ markedly in evaluation cycles, risk tolerance, compliance depth, and IP logic (Li & Zhang 2025). Before cross-type interface templates are fully standardized, actors can rationally prioritize intra-type collaboration to achieve faster alignment, lower negotiation overhead, and reduced monitoring intensity.
H4: In the GBA innovation collaboration network, collaborative ties are more likely to form between actors of the same organizational type, indicating a salient organizational homophily effect.
2.3.5 Experience-Driven Matthew Effects
Cumulative advantage theory (DiPrete & Eirich 2006) posits that initial advantages become systematically amplified, creating “rich-get-richer” Matthew effects. In inter-organizational collaboration, cooperative experience encompasses absorptive capacity (Cohen & Levinthal 1990), dynamic capabilities (Teece 2007), and reputation signals (Gulati 1995a; Podolny 2001). This composite asset operates through dual mechanisms: internal capability development via process standardization and coordination proficiency, and external reputation signaling that reduces partners’ information costs and selection risks (Stuart et al. 1999; Li et al. 2025). These mechanisms create reinforcing cycles where capability stability enhances signal credibility, stronger signals attract quality partners, and premium collaborations further enrich experience. The GBA’s cross-border innovation involves institutional frictions across data flows, regulatory standards, and funding procedures (Chen & Hustad 2025). This context amplifies experience value, enabling experienced actors to navigate barriers efficiently while forming “experience clusters” that exclude newcomers.
H5: In the GBA innovation collaboration network, actors’ cooperative experience positively correlates with new partnership formation, with this effect intensifying at higher experience levels, reflecting experience-driven Matthew effects.
3 Research Design
3.1 Data Sources and Processing
3.1.1 Data Sources
According to the 2019 Outline Development Plan for the Guangdong-Hong Kong-Macao Greater Bay Area (GBA), the GBA comprises the Hong Kong and Macao Special Administrative Regions and nine prefecture-level cities in Guangdong Province: Guangzhou, Shenzhen, Zhuhai, Foshan, Huizhou, Dongguan, Zhongshan, Jiangmen, and Zhaoqing.
We utilized joint patent application data from the Patent Search and Analysis System (PSS) developed by China National Intellectual Property Administration (CNIPA). Our dataset comprises Chinese patent applications filed with CNIPA, including all patent types (invention patents, utility models, and design patents). We focus on applications where all co-applicants were located within the 11 GBA cities, with the timing of innovation collaboration represented by patent application dates. Patent applications serve as reliable indicators of innovation collaboration, widely used in innovation network studies to capture resource integration and collaborative capabilities among different actors (Blazsek & Escribano 2010; Cai et al. 2022; Gao et al. 2011).
Our focus on Chinese patent applications filed with CNIPA inherently addresses patent family consolidation concerns, as it eliminates the risk of counting the same invention multiple times across different patent systems (e.g., China, the US, and Europe). For inventions filed under multiple patent types within China (e.g., both invention patent and utility model for the same technology), we treat each application as a separate collaboration instance, as each filing represents a deliberate collaborative decision and resource commitment by the co-applicants.
Our analysis covers 2009–2023, beginning from 2009 when the Pearl River Delta Regional Reform and Development Plan (2008) first incorporated systematic Hong Kong-Macao cooperation into regional planning. To examine the dynamic evolution of collaboration patterns, we divide this period into three phases based on key policy milestones: preliminary development (2009–2014), policy-driven development (2015–2018, marked by the Pan-Pearl River Delta Regional Cooperation Framework Agreement), and innovation acceleration (2019–2023, following the formal implementation of the GBA Development Plan).
3.1.2 Data Preprocessing
To ensure analytical validity and accurate network construction, we applied systematic filtering and quality assurance procedures. We retained only joint patent applications where: (1) all co-applicants were geographically located within the GBA region, (2) all applicants were organizational entities (excluding natural persons due to location attribution challenges), and (3) applications involved multiple co-applicants to maintain the collaboration focus. We applied patent number-based deduplication to eliminate duplicate records, ensuring that each unique patent application number represents a distinct collaboration event.
Patents involving three or more co-applicants were decomposed into constituent dyadic relationships following standard network analysis practices. Each unique pair of co-applicants generates one collaboration tie, allowing us to capture the full collaborative structure while maintaining analytical tractability.
Missing organizational attributes, particularly applicant types and precise locations, were verified through automated database searches supplemented by manual validation where necessary. We cross-validated organizational identities through official registration databases and manually verified ambiguous cases (such as enterprises with similar names). All organizational names were standardized for legal entity suffixes and punctuation conventions to ensure consistent entity identification. These systematic disambiguation and standardization procedures ensured data completeness and accuracy for subsequent network analysis.
The preprocessing procedure yielded 57,846 collaboration records involving 3,582 innovation actors across enterprises, universities, and research institutions within the GBA.
3.1.3 Network Construction
We constructed innovation collaboration networks using the processed joint patent application data and performed temporal analysis through network slicing.
Networks were constructed with innovation actors as nodes and joint patent application relationships as edges. Each edge contains comprehensive attribute information, including patent publication numbers, application dates, and applicant characteristics.
For temporal analysis, we generated networks at multiple time scales: 15 annual networks covering 2009–2023, and three phase-specific networks corresponding to the preliminary development (2009–2014), policy-driven development (2015–2018), and innovation acceleration (2019–2023) periods.
This network construction framework enables subsequent analysis of basic network characteristics such as network size, density, and clustering coefficients, as well as exploration of the dynamic evolutionary processes of innovation collaboration patterns within the GBA.
3.2 Research Methods
3.2.1 Exponential Random Graph Model
Given the complex interplay between structural patterns and actor characteristics in GBA innovation networks, we utilize the Exponential Random Graph Model (ERGM) to disentangle the relative contributions of endogenous network structures and exogenous actor attributes in shaping collaboration formation.
ERGM enables us to test specific hypotheses about collaboration formation by modeling the probability that any two innovation actors will form a collaborative tie based on both their individual characteristics and their positions within the broader network structure. Let be a random graph on a fixed node set and the observed network. The probability of observing is: where is the parameter for configuration ; is the observed network statistic counting (or weighting) occurrences of configuration ; is a normalizing constant ensuring the probability distribution sums to one.


Configurations may include edges (baseline density), stars, closed triads, open two-paths, and attribute-based homophily terms. Parameter signs and magnitudes indicate whether a configuration is over- or under-represented relative to a Bernoulli (random) baseline controlling for all other included terms.
3.2.2 Analytical Framework
Our analysis examined two categories of factors that may drive collaboration formation:
Network-based factors capture how an organization’s position in the existing collaboration network influences its likelihood of forming new partnerships:
| – | Preferential attachment: Whether organizations with many existing collaborations attract additional partners disproportionately. |
| – | Triadic closure: The tendency for indirect connections (through mutual partners) to become direct collaborations. |
| – | Brokerage: Whether organizations maintain positions that bridge different parts of the network. |
Organization-based factors reflect systematic preferences based on observable characteristics:
| – | Organization type homophily: Whether organizations preferentially collaborate within institutional categories (university-university, enterprise-enterprise, etc.). |
| – | Matthew effects: Whether organizations with greater prior collaboration experience attract additional collaboration opportunities. |
This framework allows us to assess whether GBA collaboration patterns reflect strategic network positioning, institutional preferences, organizational capabilities, or some combination of these factors.
3.3 Variable Measurement
3.3.1 Dependent Variable: Collaboration Network
We construct the collaboration network using joint patent applications as indicators of substantive innovation partnerships. Two organizations are considered collaborators if they co-applied for at least one patent during the study period, as these captures realized working relationships rather than formal agreements or stated intentions. The network is represented as an undirected binary matrix where = 1 if organizations and have collaborated, and 0 otherwise.


3.3.2 Endogenous Structural Terms
Edges: The baseline probability of tie formation; its coefficient serves as the model intercept, providing the reference level for other structural and attribute effects.
Geometrically weighted degree (GWD): Captures preferential attachment/degree heterogeneity by down-weighting higher degrees geometrically. A positive coefficient suggests super-linear reinforcement in collaboration opportunities for highly connected actors, and a negative coefficient implies degree regularization.
Geometrically weighted edge-wise shared partners (GWESP): Measures triadic closure, with each triangle contributing diminishing marginal weight. A positive coefficient indicates that collaboration ties are more likely when partners share prior collaborators, reflecting trust transfer and coordination efficiencies.
Geometrically weighted dyad-wise shared partners (GWDSP): Counts open two-paths (unclosed shared partners) with geometric down-weighting and captures brokerage potential. A negative sign (conditional on GWESP) would indicate a tendency to close rather than maintain two open paths; a positive sign would imply value in brokerage positions. We include both GWESP and GWDSP to separately identify closure versus brokerage.
3.3.3 Exogenous Attributes
Nodematch (organization type): This indicator captures institutional homophily; a tie is coded 1 if both organizations share the same categorical type (e.g., enterprise-enterprise, university-university, or research institute-research institute) and 0 otherwise. A positive coefficient indicates higher conditional log-odds of collaboration between similar institutional forms, consistent with resource-alignment and coordination-efficiency arguments.
Nodecov (collaboration experience): This indicator is defined as the cumulative number of jointly filed patent applications prior to the focal period. This measure is used to test for a collaboration-output Matthew effect: a positive coefficient indicates cumulative advantage, whereas the observed negative coefficient suggests compensatory expansion by lower-stock organizations.
Table 1 reports the ERGM statistics, distinguishing endogenous structural processes (baseline sparsity, preferential attachment, triadic closure, and the status of open two-paths/brokerage) from exogenous attribute mechanisms (institutional homophily and scale-based cumulative advantage) in the GBA innovation collaboration network. For each term, we provide its network process, hypothesized coefficient sign, and conditional interpretation.
Table 1: ERGM terms and theoretical interpretations. |
| Variable | Schematic | Network process | Expected effect | Interpretation |
|---|---|---|---|---|
| Edges |  | Baseline sparsity | Negative | Baseline tendency toward collaboration is low; other effects shift this baseline |
| GWD |  | Preferential attachment | Positive | Ties are more likely to involve already well-connected organizations (reinforcing cumulative connectivity) |
| GWESP |  | Triadic closure | Positive | A dyad with shared collaborators has higher tie log-odds (diminishing marginal returns) |
| GWDSP | 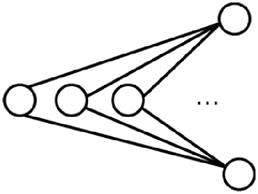 | Open two-paths/brokerage potential | Negative | Negative signals pressure to close open two-paths, whereas positive signals valued maintenance of brokerage positions |
| Nodematch |  | Institutional homophily | Positive | Same-type organizations exhibit higher conditional tie propensity |
| Nodecov |  | Scale-based cumulative advantage | Positive | Larger (higher collaboration stock) organizations are more attractive partners (cumulative advantage) |
4 Empirical Analysis
4.1 Descriptive Characteristics of the Network Structure
We construct the Greater Bay Area (GBA) collaborative innovation network by treating innovation actors as nodes and patent co-applications as collaborative ties. Guided by the staged evolution of GBA innovation policy, the observation window (2009–2023) is partitioned into three strategic phases: the Initial Development Phase (2009–2014), the Policy Promotion Phase (2015–2018), and the Innovation Acceleration Phase (2019–2023). Figure 2 shows the network in each phase, and Table 2 reports the descriptive statistics.
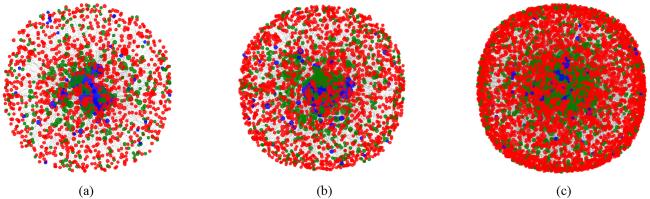
Figure 2: Full GBA collaborative innovation networks across three phases: (a) Initial Development (2009–2014), (b) Policy Promotion (2015–2018), and (c) Innovation Acceleration (2019–2023). All observed actors and their collaborative innovation ties are shown. Node colors indicate actor type (red = enterprises, blue = universities, green = research institutes). Node size scales with degree (number of collaborative ties). |
Table 2: Descriptive statistics of collaborative innovation network characteristics (by phase). |
| Indicators | Initial development (2009–2014) | Policy promotion (2015–2018) | Innovation acceleration (2019–2023) |
|---|---|---|---|
| Nodes | 1,317 | 2,135 | 4,310 |
| Edges | 1,660 | 2,853 | 6,637 |
| Density | 0.001913 | 0.001253 | 0.000715 |
| Average clustering coefficient | 0.1865 | 0.2043 | 0.2321 |
| Number of connected components | 127 | 98 | 74 |
| Share of largest connected component | 76.23 % | 87.59 % | 95.13 % |
| Degree distribution (counts and shares): | |||
| Degree = 1 | 682 (51.78 %) | 978 (45.81 %) | 1,724 (40.00 %) |
| Degree = 2 | 287 (21.79 %) | 512 (23.98 %) | 1,142 (26.50 %) |
| Degree = 3 | 146 (11.09 %) | 265 (12.41 %) | 578 (13.41 %) |
| Degree ≥ 4 | 202 (15.34 %) | 380 (17.80 %) | 866 (20.09 %) |
| Actor type composition (counts and shares): | |||
| Enterprises | 894 (67.88 %) | 1,486 (69.60 %) | 3,056 (70.90 %) |
| Universities | 308 (23.39 %) | 482 (22.58 %) | 927 (21.51 %) |
| Research institutes | 115 (8.73 %) | 167 (7.82 %) | 327 (7.59 %) |
| Cross-regional collaboration ratio | 37.65 % | 42.13 % | 46.82 % |
| Industry–university–research (IUR) collaboration ratio | 28.43 % | 31.76 % | 35.24 % |
Overall scale expands markedly. As shown in Table 2, the number of innovation actors increases from 1,317 (Initial Development) to 4,310 (Innovation Acceleration), while collaborative ties rise from 1,660 to 6,637, indicating pronounced growth in both participation and collaborative activity. Despite this expansion, nodes of degree = 1 remain above 40 % in every phase, suggesting a persistent peripheral stratum not yet embedded in cohesive collaboration clusters.
Actor composition shifts gradually toward a more enterprise-centered configuration. The enterprise share rises moderately, while industry–university–research (IUR) collaborative ties increase in proportion, consistent with deeper multi-actor integration. Cross-regional (Guangdong-Hong Kong-Macao) collaboration ratios also climb steadily, evidencing enhanced spatial integration and reduced geographic segmentation.
The degree distribution becomes more right-skewed at the upper tail (rising share of nodes with degree ≥ 4), indicating the consolidation of higher-degree actors that may anchor knowledge diffusion. Concurrently, the largest connected component’s share increases from 76.23 % to 95.13 %, pointing to a progressively more unified regional collaboration space.
These descriptive patterns jointly indicate: (1) rapid scaling accompanied by sustained entry of low-embeddedness actors, (2) strengthening integration mechanisms across institutional and spatial boundaries, and (3) emergent structural centralization around a subset of more connected entities. Together they motivate a formal examination of endogenous structural processes versus attribute-based selection, undertaken with ERGM in Section 4.2 .
4.2 Model Estimation Results and Analysis
4.2.1 Network Simplification
Prior studies show that network evolution and functional performance are disproportionately shaped by core actors (Barabási & Albert 1999; Borgatti & Everett 2000). To focus on more substantively engaged participants and reduce noise from minimally connected nodes, we extract a core subnetwork comprising actors with degree ≥ 3 (following Liu et al. 2020; Chen & Wang 2023). Figure 3 presents the phase-specific core subnetworks; Table 3 summarizes their statistics.
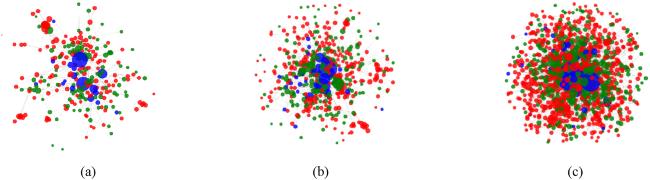
Figure 3: Core subnetworks of the GBA collaborative innovation network in three phases: (a) Initial Development (2009–2014), (b) Policy Promotion (2015–2018), and (c) Innovation Acceleration (2019–2023). Only nodes with degree ≥ 3 are shown to highlight the core. Node colors denote actor type (red = enterprises, blue = universities, green = research institutes). Node size scales with degree (number of collaboration ties). Edges represent collaborative innovation relationships. |
Table 3: Descriptive statistics of core collaborative innovation subnetworks (degree ≥ 3). |
| Indicators | Initial development (2009–2014) | Policy promotion (2015–2018) | Innovation acceleration (2019–2023) |
|---|---|---|---|
| Nodes | 250 | 458 | 1,016 |
| Edges | 518 | 992 | 2,818 |
| Density | 0.0166 | 0.0095 | 0.0055 |
| Average degree | 4.1440 | 4.3319 | 5.5472 |
| Average weighted degree | 43.7680 | 68.2052 | 76.5748 |
| Average clustering coefficient | 0.4740 | 0.4985 | 0.4789 |
| Average path length | 3.2053 | 3.5785 | 3.4107 |
| Nodes in largest component | 229 | 419 | 997 |
| Share of largest component | 91.60 % | 91.48 % | 98.13 % |
| Actor type composition (shares): | |||
| Enterprises | 54.00 % | 52.40 % | 59.25 % |
| Universities | 6.80 % | 6.99 % | 4.13 % |
| Research institutes | 39.20 % | 40.61 % | 36.61 % |
Both scale and interaction intensity within the core rise strongly. While density declines, the expected mathematical consequence of rapid node and tie expansion-average degree and especially average weighted degree increase, indicating intensification of collaboration frequency or multi-tie relationships. The average clustering coefficient remains high (≈0.47–0.50), and the largest connected component consistently encompasses over 90 % of core actors (reaching 98.13 % in the final phase). Short average path lengths, paired with elevated clustering, are consistent with small-world tendencies (Uzzi & Spiro 2005; Watts & Strogatz 1998). Mild oscillation in clustering and path length during the Policy Promotion Phase plausibly reflects policy-driven broadening that temporarily diversifies connection pathways before renewed consolidation.
Relative to the full network, the core subnetwork contains smaller enterprise and university shares and a higher representation of research institutes, suggesting that research institutes, while numerically fewer overall, participate disproportionately in intensive collaboration structures. This stratification underscores differentiated functional roles: enterprises dominate numerically and in peripheral expansion, whereas research institutes maintain central positions in cohesive high-intensity clusters.
4.2.2 Empirical Results
For each phase, we estimate four ERGM specifications using MCMC maximum likelihood (Statnet in R). Model 1 includes only the baseline edges term; Model 2 adds endogenous structural terms (geometrically weighted degree, edgewise shared partners, dyadwise shared partners); Model 3 incorporates exogenous attributes (actor type homophily and collaboration scale); Model 4 combines both sets. Table 4 reports results. AIC and BIC uniformly favor Model 4, while the sign and significance patterns of key coefficients remain stable across nested models, indicating specification robustness.
| Parameter | Initial development (2009–2014) | Policy promotion (2015–2018) | Innovation acceleration (2019–2023) | |||||||||
|---|---|---|---|---|---|---|---|---|---|---|---|---|
| Model 1 | Model 2 | Model 3 | Model 4 | Model 1 | Model 2 | Model 3 | Model 4 | Model 1 | Model 2 | Model 3 | Model 4 | |
| Edges | −4.0790*** | −5.8132*** | −5.0833*** | −6.4266*** | −4.6492*** | −6.6405*** | −5.4222*** | −7.1330*** | −5.2039*** | −7.1967*** | −5.7778*** | −7.6120*** |
| (0.0443) | (0.1136) | (0.0858) | (0.1512) | (0.0319) | (0.0915) | (0.0560) | (0.1133) | (0.0189) | (0.0521) | (0.0321) | (0.0622) | |
| GWD | 1.6323*** | 2.6614*** | 0.9599*** | 1.7590*** | 1.9191*** | 3.9252*** | ||||||
| (0.3938) | (0.4828) | (0.2164) | (0.2364) | (0.2965) | (0.5279) | |||||||
| GWESP | 2.1424*** | 1.8179*** | 2.6399*** | 2.4262*** | 2.7825*** | 2.4776*** | ||||||
| (0.1009) | (0.1142) | (0.0840) | (0.0883) | (0.0495) | (0.0509) | |||||||
| GWDSP | −0.0643*** | −0.0568*** | −0.0343*** | |||||||||
| (0.0051) | (0.0029) | (0.0009) | ||||||||||
| Nodematch | 0.3491*** | 0.3513*** | 0.2953*** | 0.3259*** | 0.2326*** | 0.3902*** | ||||||
| (0.1031) | (0.1010) | (0.0712) | (0.0665) | (0.0419) | (0.0398) | |||||||
| Nodecov | 0.0608*** | 0.0856*** | 0.0429*** | 0.0670*** | 0.0216*** | 0.0397*** | ||||||
| (0.0019) | (0.0037) | (0.0010) | (0.0020) | (0.0003) | (0.0006) | |||||||
| AIC | 5,272.5708 | 4,514.5187 | 4,474.0239 | 4,038.0773 | 11,219.3927 | 9,222.4325 | 9,840.8460 | 8,413.6382 | 34,982.4259 | 28,666.3955 | 31,054.5119 | 26,335.8909 |
| BIC | 5,280.9166 | 4,539.556 0 | 4,499.0612 | 4,088.1519 | 11,228.9511 | 9,251.1077 | 9,869.5212 | 8,470.9886 | 34,993.5790 | 28,699.8548 | 31,087.9712 | 26,402.8096 |
Edges. The edges coefficient is significantly negative in all phases, with increasing absolute magnitude, consistent with rising overall sparsity and heightened selectivity in partner formation as the opportunity set enlarges (Rivera et al. 2010). This aligns with the observed decline in network density as scale expands growing innovation collaboration complexity raises coordination and transaction costs, prompting actors to maintain fewer but higher-quality ties (Gulati 1995b; Wuyts et al. 2004).
GWD. The positive GWD effect demonstrates a persistent tendency toward degree concentration (preferential attachment), consistent with H1. Its trajectory – an initial intensification (Phase 1 to Phase 2), followed by a moderation and partial re-concentration in the final phase – can be read as an interplay between early emergence of central actors, subsequent policy-induced diffusion that broadens participation, and later reinforcement of established hubs as accumulated reputational and resource advantages again attract collaborators. This indicates that centralization pressures are tempered but not displaced by mid-phase diversification.
GWESP. The strongly positive and rising GWESP coefficient (largest marginal increase from Phase 1 to Phase 2) indicates strengthening triadic closure dynamics (Coleman 1988), supporting H2. As closure becomes more prominent, actors increasingly leverage partners’ partners to extend collaboration under reduced coordination and trust uncertainty while accessing richer multi-lateral knowledge recombination channels (Uzzi 1997; Hansen 1999). The continued, though smaller, increment into the Innovation Acceleration Phase suggests consolidation rather than mere episodic clustering.
GWDSP. The consistently negative GWDSP estimate, whose absolute magnitude attenuates over time, shows that open two-paths remain disfavored even as the penalty softens, supporting H3. This softening is coherent with the expanding prevalence of closed triads captured by GWESP: as more potential open configurations resolve into closed clusters, the residual marginal penalty on remaining open structures naturally declines. Together, the coupled GWESP increase and GWDSP suppression point to an evolutionary shift from indirect, potentially noisier brokerage pathways toward embedded, trust-reinforced local cohesion.
Nodematch. The positive homophily effect in all phases confirms a persistent same-type collaboration bias, consistent with H4. The modest dip during the Policy Promotion Phase accords with policy efforts to stimulate industry–university–research integration, which partially countervail default similarity preferences; the subsequent rise in the Innovation Acceleration Phase suggests that as functional specialization crystallizes, same-type actors again find efficiencies in coordinating complementary yet institutionally proximate resources. Thus, policy broadening exerts a temporary dampening rather than a structural reversal of homophilous selection.
Nodecov. The positive but monotonically declining nodecov coefficient evidences a cumulative advantage (Matthew effect) in attracting partners while indicating diminishing marginal returns to scale over time, supporting H5. Early phases see larger cumulative patent actors leveraging visibility and reputational signals; later, a combination of targeted support for smaller entities (Rothwell & Dodgson 1991) and reduced search frictions through digital platforms (Nambisan 2017) appears to narrow the incremental advantage gap. This gradual attenuation implies a broadening inclusiveness of the collaboration field even as scale remains an asset.
Collectively these results depict a network that, across phases, becomes more selective yet structurally cohesive: preferential attachment operates alongside an intensifying closure mechanism that progressively internalizes indirect paths, while homophily and cumulative advantage persist in moderated form under policy-driven diffusion and technological reductions in information asymmetry.
We implemented three robustness assessments: (1) Random subsampling and re-estimating the models preserved the signs and significance of all focal coefficients. (2) For core network restriction, limiting the analysis to actors with degree ≥ 4 and re-estimating produced coefficient signs and significance patterns identical to the baseline (Table 5). (3) Adding cross-border control variables to the baseline specification (degree ≥ 3) to address potential omitted-variable bias related to the Mainland-HK/Macao institutional boundary confirmed that our focal coefficients remained substantively unchanged (Table 6). Collectively, these tests suggest that our principal conclusions are robust to sampling perturbations, to exclusion of peripheral, low-degree actors, and to cross-jurisdictional collaboration dynamics.
Table 5: Robustness check results: Core network constriction. |
| Parameter | Initial development (2009–2014) | Policy promotion (2015–2018) | Innovation acceleration (2019–2023) | |||||||||
|---|---|---|---|---|---|---|---|---|---|---|---|---|
| Model 1 | Model 2 | Model 3 | Model 4 | Model 1 | Model 2 | Model 3 | Model 4 | Model 1 | Model 2 | Model 3 | Model 4 | |
| Edges | −3.5135*** | −4.9633*** | −4.8618*** | −5.7547*** | −4.1190*** | −5.8785*** | −5.1217*** | −6.4109*** | −4.6480*** | −6.6501*** | −5.4466*** | −7.0942*** |
| (0.0568) | (0.1356) | (0.1200) | (0.1886) | (0.0398) | (0.1098) | (0.0739) | (0.1398) | (0.0224) | (0.0639) | (0.0399) | (0.0771) | |
| GWD | 1.0286** | 1.9455*** | 0.4687* | 1.3382*** | 1.0678*** | 2.5339*** | ||||||
| (0.4556) | (0.5378) | (0.2440) | (0.2738) | (0.2941) | (0.3751) | |||||||
| GWESP | 1.6796*** | 1.2220*** | 2.2250*** | 1.9543*** | 2.5500*** | 2.1700*** | ||||||
| (0.1180) | (0.1416) | (0.0986) | (0.1063) | (0.0604) | (0.0632) | |||||||
| GWDSP | −0.0939*** | −0.0767*** | −0.0409*** | |||||||||
| (0.0093) | (0.0051) | (0.0013) | ||||||||||
| Nodematch | 0.6020*** | 0.5571*** | 0.3311*** | 0.3076*** | 0.4197*** | 0.5076*** | ||||||
| (0.1326) | (0.1279) | (0.0898) | (0.0830) | (0.0501) | (0.0473) | |||||||
| Nodecov | 0.0840*** | 0.1223*** | 0.0602*** | 0.0875*** | 0.0279*** | 0.0462*** | ||||||
| (0.0036) | (0.0069) | (0.0017) | (0.0035) | (0.0004) | (0.0009) | |||||||
| AIC | 2,890.9998 | 2,580.2211 | 2,417.4418 | 2,240.7721 | 6,595.4325 | 5,598.9287 | 5,691.2136 | 5,017.9817 | 22,771.3532 | 19,019.0283 | 19,847.6689 | 17,253.1805 |
| BIC | 2,898.3079 | 2,602.1452 | 2,439.3658 | 2,284.6201 | 6,604.0338 | 5,624.7325 | 5,717.0174 | 5,069.5894 | 22,781.6186 | 19,049.8245 | 19,878.4651 | 17,314.7730 |
Table 6: Robustness check results: Cross-border controls. |
| Parameter | Initial development (2009–2014) | Policy promotion (2015–2018) | Innovation acceleration (2019–2023) | ||||||
|---|---|---|---|---|---|---|---|---|---|
| Model 4 | Model 5 | Model 6 | Model 4 | Model 5 | Model 6 | Model 4 | Model 5 | Model 6 | |
| Edges | −6.4266*** | −6.5119*** | −11.5566*** | −7.1330*** | −6.6872*** | −3.8243*** | −7.6120*** | −6.9938*** | −4.7579*** |
| (0.1512) | (0.3419) | (0.0926) | (0.1133) | (0.1882) | (0.5988) | (0.0622) | (0.0898) | (0.2858) | |
| GWD | 2.6614*** | 2.6747*** | 2.2316*** | 1.7590*** | 0.5043* | 0.0989 | 3.9252*** | 2.8835*** | 2.2091*** |
| (0.4828) | (0.4977) | (0.5289) | (0.2364) | (0.2638) | (0.1761) | (0.5279) | (0.3651) | (0.2775) | |
| GWESP | 1.8179*** | 1.8210*** | 1.8277*** | 2.4262*** | 1.9073*** | 2.1744*** | 2.4776*** | 2.0931*** | 2.1050*** |
| (0.1142) | (0.1158) | (0.1229) | (0.0883) | (0.1074) | (0.1275) | (0.0509) | (0.0531) | (0.0553) | |
| GWDSP | −0.0643*** | −0.0639*** | −0.0743*** | −0.0568*** | −0.1363*** | −0.1042*** | −0.0343*** | −0.0465*** | −0.0648*** |
| (0.0051) | (0.0053) | (0.0062) | (0.0029) | (0.0073) | (0.0032) | (0.0009) | (0.0012) | (0.0013) | |
| Nodematch (organization type) | 0.3513*** | 0.3532*** | 0.3479*** | 0.3259*** | 0.1765*** | 0.1631*** | 0.3902*** | 0.3556*** | 0.3750*** |
| (0.1010) | (0.1060) | (0.1049) | (0.0665) | (0.0557) | (0.0596) | (0.0398) | (0.0472) | (0.0389) | |
| Nodecov | 0.0856*** | 0.0851*** | 0.0841*** | 0.0670*** | 0.1278*** | 0.1138*** | 0.0397*** | 0.0498*** | 0.0707*** |
| (0.0037) | (0.0039) | (0.0036) | (0.0020) | (0.0033) | (0.0028) | (0.0006) | (0.0009) | (0.0013) | |
| Nodematch(jurisdiction) | 0.0838 | 0.7221*** | −0.2370*** | ||||||
| (0.3122) | (0.1341) | (0.0743) | |||||||
| Nodemix(jurisdiction): | |||||||||
| HK/Mac–Mainland | 5.8155*** | −2.0466*** | −2.1692*** | ||||||
| (0.2899) | (0.5647) | (0.3078) | |||||||
| Mainland–Mainland | 5.3712*** | −2.2921*** | −2.3877*** | ||||||
| (0.0919) | (0.5425) | (0.2758) | |||||||
| AIC | 4,038.08 | 4,047.2357 | 4,063.03 | 8,413.64 | 11,060.2445 | 10,752.33 | 26,335.89 | 26,714.6394 | 27,972.95 |
| BIC | 4,088.15 | 4,105.6560 | 4,129.79 | 8,470.99 | 11,127.1534 | 10,828.8 | 26,402.81 | 26,792.7113 | 28,062.18 |
Specifically for the cross-border robustness check (3), given the unique institutional context of the GBA under the “One Country, Two Systems” framework, we specified two cross-border controls. First, Nodematch(jurisdiction) captures whether both organizations are in the same jurisdiction (Mainland or HK/Macao). Second, Nodemix(jurisdiction) distinguishes three types relative to within-HK/Macao ties (baseline): cross-border ties and within-Mainland ties. Results across all three periods remain consistent with our baseline findings (Table 6).
4.2.3 Goodness-of-Fit Assessment
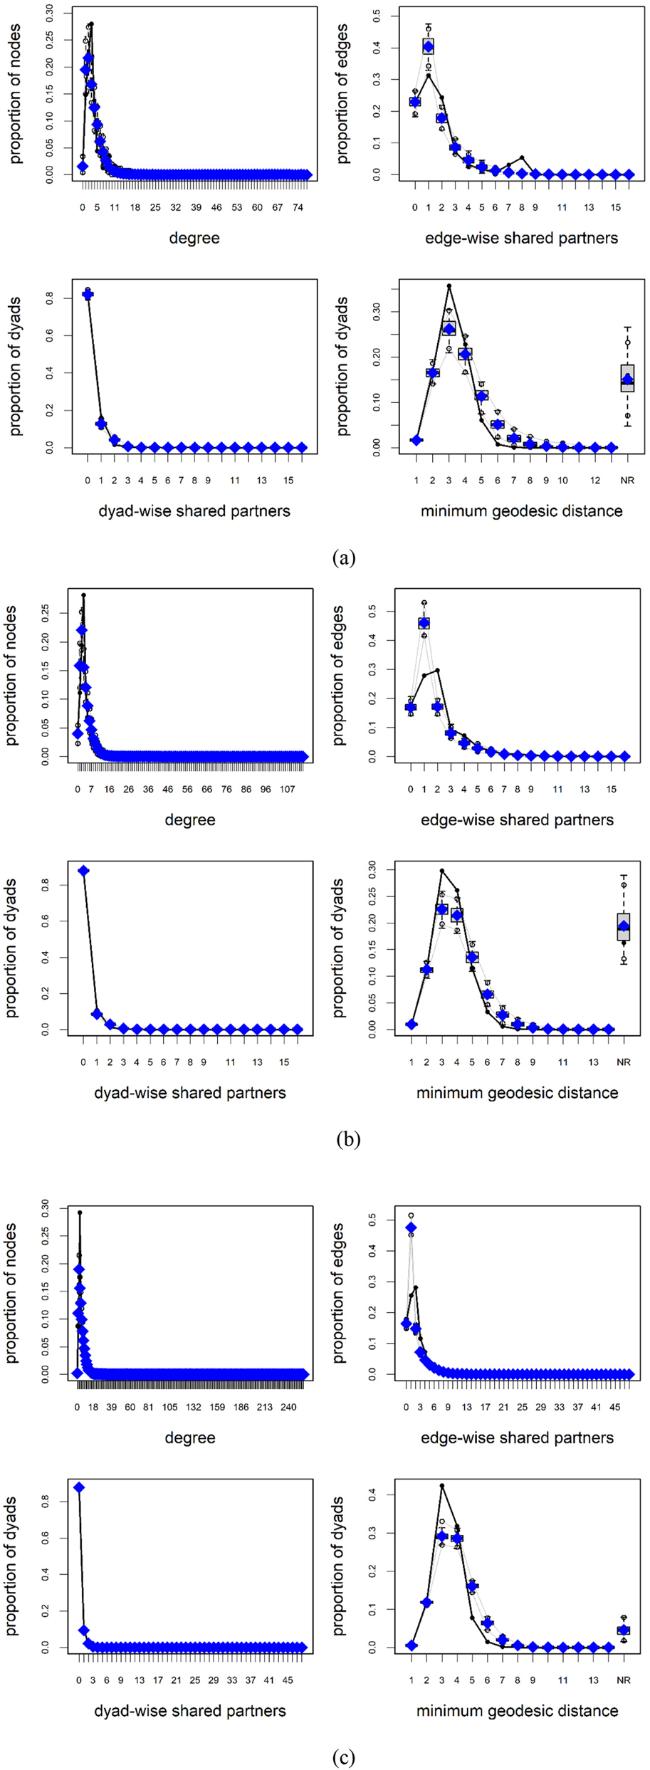
Goodness-of-fit (GOF) diagnostics evaluate whether simulated networks from the fitted ERGM reproduce salient structural features (Cranmer et al. 2012). For each phase, conditional on convergence, we simulate networks via MCMC draws from the fitted probability distribution and compare observed versus simulated distributions on: (1) degree; (2) edge-wise shared partners; (3) dyad-wise shared partners; and (4) minimum geodesic distance (Figure 4).
Figure 4: Goodness-of-fit plots for the final ERGM by phase. Phases: (a) Initial development (2009–2014); (b) Policy promotion (2015–2018); (c) Innovation acceleration (2019–2023). Columns (left to right): degree, edge-wise shared partners, dyad-wise shared partners, minimum geodesic distances. Observed values (black lines) align closely with boxplots from 100 simulated networks, supporting model adequacy across phases. |
Across all phases, observed statistics lie within (typically near the medians of) the simulated interquartile ranges for each diagnostic dimension, indicating satisfactory replication of degree heterogeneity, local clustering pathways, and path length structure. No systematic tail misfit is visible for shared partner distributions, suggesting that the combined GWESP–GWDSP specification captures closure versus open two-path suppression dynamics appropriately. Overall, the ERGM adequately recovers key generative features of the GBA collaborative innovation network across developmental stages.
5 Conclusions and Discussion
In an era of increasing global innovation competition, regional collaborative innovation has emerged as a critical strategy for enhancing national and regional competitiveness. Traditional isolated innovation models are being replaced by networked collaborative approaches that span organizations and sectors. The structural characteristics and formation mechanisms of regional innovation networks directly influence knowledge flow efficiency, resource allocation optimization, and breakthrough innovation capacity. However, existing research largely remains at the descriptive level, lacking deep empirical examination of underlying formation mechanisms. This gap is particularly evident in cross-regional innovation systems with complex institutional environments and frequent policy interventions, where the relationship between micro-level network evolution and macro-level policy effects remains unclear.
This study advances our understanding of collaborative innovation network formation through the first comprehensive multi-mechanism analysis of a major cross-regional innovation system. By conducting longitudinal ERGM estimations across three developmental phases of the Guangdong-Hong Kong-Macao Greater Bay Area (2009–2023), we demonstrate that regional collaborative innovation networks evolve through multiple, often competing mechanisms operating simultaneously, rather than through a single dominant driver. Our analysis of 57,846 collaborative patent applications reveals a paradoxical evolutionary trajectory: despite substantial policy investment and institutional reforms aimed at fostering open, diverse collaboration, the GBA network has consolidated into what we term an “elite-driven community closure” configuration.
Our theoretical contributions emerge from three key findings. First, we identify persistent preferential attachment mechanisms that concentrate new partnerships around established hubs, creating stable elite cores throughout the observation period. Second, triadic closure effects intensify over time, reflecting deepening trust relationships within communities while simultaneously constraining cross-community knowledge flows. Third, organizational homophily shows sustained positive effects across all developmental phases, indicating that significant collaboration barriers persist between enterprises, universities, and research institutes despite policy incentives for cross-sector integration. These patterns show that structural inertia in collaborative innovation networks resists policy intervention more than we previously assumed, challenging optimistic assumptions about the adaptability of regional innovation ecosystems.
The theoretical implications extend beyond network science to regional innovation studies. While existing literature often treats network structure as either a policy outcome or environmental constraint, our multi-mechanism approach reveals structure as an emergent property of micro-level collaboration decisions operating under institutional and competitive pressures. We identify experience accumulation as a distinct mechanism – separate from but interacting with preferential attachment – contributing to cumulative advantage theory in innovation contexts. The finding that experience effects diminish over time while preferential attachment remains stable suggests that reputation-based advantages become more important than capability-based advantages as networks mature.
Our findings suggest three key policy adjustments needed to address these mechanism patterns. First, reducing transaction costs for cross-type collaboration requires targeted institutional innovations rather than general incentive provision. The persistent organizational homophily effects show that effective interventions should focus on establishing standardized IP sharing frameworks, creating sector-neutral collaboration platforms, developing cross-sector personnel exchange programs, and implementing risk-sharing mechanisms that address different risk preferences between academic and commercial actors. Second, counteracting preferential attachment concentration requires proactive peripheral engagement strategies, including “innovation voucher” systems that subsidize hub-peripheral collaborations, mentorship programs that incentivize established leaders to engage emerging actors, and network diversity requirements in major R&D funding programs. Third, extending trust beyond similar groups requires institutional infrastructure for reputation sharing, including unified cross-regional collaboration reputation systems, standardized collaboration assessment frameworks, and cross-community networking platforms.
Methodologically, this study demonstrates the value of phase-segmented longitudinal ERGM analysis for understanding network evolution under changing policy conditions. The multi-mechanism framework developed here provides a template for comparative analysis across different regional innovation systems, particularly those characterized by institutional complexity, actor diversity, and policy intervention. However, there are two important scope limitations. First, this study reveals the structural patterns of a quantitative collaboration network but does not assess the quality or outcomes of individual collaborations. Patent co-applications indicate realized partnerships but do not directly measure innovation quality, knowledge transfer effectiveness, or commercial value. While network structure shapes access to resources and opportunities for knowledge recombination, the relationship between structure and performance is not deterministic. Addressing this limitation would require linking network data with innovation outcome metrics such as patent citations or commercialization success, which represents an important avenue for future research. Second, our findings are based on patent collaboration networks, which represent application-oriented R&D partnerships aimed at commercial innovations. Whether the mechanisms we identify operate similarly in other innovation contexts (such as basic research collaborations reflected in co-authored publications) remains an open question, as different institutional logics and collaboration motivations may produce different network formation dynamics.
Future research should integrate collaboration network data with innovation quality metrics (such as patent citations, technological impact measures, or commercialization outcomes) to test whether the structural mechanisms we identify actually translate into superior innovation performance, employ dynamic models such as temporal ERGMs (Leifeld et al. 2018; Setayesh et al. 2022), score-driven ERGMs (Di Gangi et al. 2024) or stochastic actor-oriented models (Ter Wal & Boschma 2009; Teng et al. 2021) for more precise continuous evolution capture, and investigate mechanism interaction effects, particularly how preferential attachment interacts with homophily to create “similar-preference Matthew effects”. Additionally, future work should examine whether the structural mechanisms identified here generalize across different types of innovation networks (Li & Feng 2025), particularly in contexts where collaboration motivations differ from patent-oriented partnerships.
The broader implications suggest that creating institutional conditions for cooperation through funding, infrastructure, and regulatory frameworks may be necessary but insufficient for generating the open, diverse, exploration-oriented networks that drive breakthrough innovation. Our analysis reveals that collaborative innovation networks may naturally evolve toward elite-driven community closure configurations that limit the cross-boundary recombination they are intended to promote. By identifying specific micro-level processes that aggregate into macro-level network structures, this mechanism-based approach enables more targeted and theoretically grounded interventions in regional innovation ecosystems. As global competition increasingly centers on collaborative innovation capabilities, such understanding becomes crucial for designing effective regional development strategies that can overcome structural inertia and foster truly collaborative innovation networks.