1 Introduction
A publication suffering from delayed recognition is a publication that received very little attention shortly after publication, but received recognition later. Stephen Cole proposed to use citations as a proxy for recognition (Cole, 1970). Although recognition can be given in many ways—receiving tenure is another important way in which scientists are recognized for their achievements—collecting received citations is the most practiced way to operationalize the notion of delayed recognition. This contribution is not meant as a review of the topic, but we concentrate on a few recent developments. Yet, among the many papers written by colleagues on delayed recognition we single out for mention: (Bornmann et al., 2018; Burrell, 2005; Du & Wu, 2016; El Aichouchi & Gorry, 2018; Garfield, 1980; Glänzel et al., 2003; Ke et al., 2015; Li & Ye, 2012; van Raan, 2004, 2015, 2017).
In this short paper we will discuss three aspects: naming of the phenomenon, recent methods based on a cumulative citation curve and re-interpretation of delayed recognition as a fuzzy concept.
2 Naming of the concept
The concept of delayed recognition in relation to persons or articles has also been described as premature discovery, suffering from Mendel’s syndrome, being late bloomers or being ahead of one’s time. Mendel’s work on the rules of heredity is often considered as the prototype case. Yet, Mendel’s work was not totally unknown before the 20th century as mentioned by Garfield (1970), giving reference to Zirkle (1964).
In an article published in 2004, Ton van Raan proposed the name “sleeping beauty” for an article suffering delayed recognition (van Raan, 2004). This catchy term took on immediately: on June 3, 2018 van Raan’s article had already received 176 citations in the Web of Science (WoS). When the value, importance or usefulness of such a “sleeping beauty” is finally recognized in another article, denoted here as P, serving as a wake-up call for the scientific community (leading to general recognition of the “sleeping beauty”), article P is referred to as the Prince, continuing the metaphor of the story of the Sleeping Beauty. The act of “awakening” the sleeping beauty is then sometimes referred to as “the kiss.”
Sugimoto and Mostafa (2018) recalled that, in the context of sleeping beauties, Braun et al. (2010, p. 198) discussed the “ideal couple” and further sexualized the metaphor by discussing male and female dominance and “absolute superiority”: a measurement of the relative citations achieved by the prince and the sleeping beauty. Finally, they introduced the notion of chastity of sleeping beauties, in terms of the number of articles that awoke the dormant article and mentioned the possible unfaithful behavior of princes. Clearly a form of sexualization of citation trajectories has been—and is still—going on.
It is clear that these types of metaphors, continuing with “brave girls” for articles which are immediately recognized (Ye & Bornmann, 2018) have the tendency to become more and more gender-loaded. For this reason Sugimoto & Mostafa (2018) wrote an editorial, decrying this “clear violation of sociocultural norms”. They made a plea to future authors that the use of any such terms, despite connections to historical roots in the literature, should be avoided. As a consequence they stated that JASIST’s author guidelines will be adapted to make this policy explicit and clear.
As a reaction Hu et al. (2018) proposed the metaphor of gender-neutral terms “hibernator” and “awakener” to replace the terms “sleeping beauty” and “prince”. It is, of course, an open question if any metaphor is really useful.
3 A new approach to determine articles with delayed recognition based on a cumulative citation curve
The approach proposed by Ke et al. (2015)
Although being a sleeping beauty sounds like a yes/no situation, it is clear that delayed recognition is not a clear-cut phenomenon and a sleeping beauty in the eyes of one person may not be one in the eyes of a colleague. A similar observation holds in relation to the citation database used for collecting citations. To solve this problem Ke et al. (2015) turned delayed recognition into a time-dependent continuous phenomenon by defining a beauty coefficient at time T, denoted as B(T). In the next section we return to the fact that these authors turned a yes/no phenomenon into a continuous one. Now we focus on the practical way in which they did this. Let c(t) denote the yearly citation curve of an article, i.e., c(t) is the number of citations received in year t. The publication year is year t = 0 and t takes values between
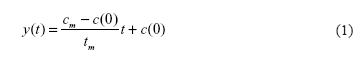
0 and T. Let cm > 0 be the maximum yearly number of received citations by this article, for which we assume that it happened in year tm, with 0 < tm ≤ T. The line connecting (0,c(0)) and the peak (tm,cm) = (tm,c(tm)), which is referred to as the recognition line, is denoted as y(t), and has equation:
0 and T. Let cm > 0 be the maximum yearly number of received citations by this article, for which we assume that it happened in year tm, with 0 < tm ≤ T. The line connecting (0,c(0)) and the peak (tm,cm) = (tm,c(tm)), which is referred to as the recognition line, is denoted as y(t), and has equation:
Then,
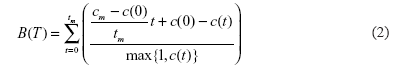
The numerator of a term in B(T) is equal to the—signed—difference between the recognition line and the citation value. As the denominator of this term is equal to the number of citations (unless this number is zero, in which case the denominator is 1) each term in the sum determining B(T) is a relative value.
If c(t) has a concave trajectory then B(T) is negative.
If c(t) is approximately linear then B(T) is (close to) zero.
If c(t) is convex then B(T) is positive.
If now each term in the sum determining B(T) is non-negative, then the following properties hold.
-) All else staying the same, B(T) is increasing when cm increases.
-) All else staying the same, B(T) decreases when c(t), with t fixed and different from 0 or tm, increases as the numerator decreases and the denominator increases.
Using cumulative citation curves
In recent papers Du & Wu (2017, 2018) note some disadvantages of the definition proposed by Ke et al. (2015), the most important one being the high importance given to the peak. They claim that the determination of the B-value works well for publications that after discovery have huge numbers of citations every year, but for publications with fewer citations, it may lead to some unwanted results. They, moreover, consider the role of the denominator in the original definition as just a way to avoid division by zero.
For these reasons these authors propose a different approach, not based on the citation curve, c(t), but on the cumulative citation curve 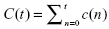 . Using a variation on the Du and Wu approach based on the cumulative citation curve we will propose a description of delayed recognition as a fuzzy phenomenon.
. Using a variation on the Du and Wu approach based on the cumulative citation curve we will propose a description of delayed recognition as a fuzzy phenomenon.4 Delayed recognition as a fuzzy phenomenon
Now we propose a framework to study delayed recognition of an article at a given moment in time, say T. More precisely, we consider the question: does this article suffers delayed recognition or has it in the past (while now it, perhaps, behaves like a normal article, already receiving a declining number of citations).
Studying this question we consider three aspects: “delayed,” “recognition” and fuzzy membership.
When it comes to the “delayed” part, this implies that one must wait a certain period before one may say that there is a delay. In this study we wait at least ten years (see further for details), but further investigations are needed to study the influence of this starting time. Does it matter if one starts investigations 10 years after publication or is 15 or 20 years better?
Next we come to the “recognition” part. We propose to concentrate on the 1% most cited publications in the same publication year as the publication under investigation. A choice must further be made to include all publication types in this 1% or only normal articles (or normal articles and reviews). We think that
here all choices are valid, i.e., have some scientific value, but the choice must be stated clearly.
here all choices are valid, i.e., have some scientific value, but the choice must be stated clearly.
Finally we come to the most difficult part: constructing a framework to come to a fuzzy membership value. This value, between zero and one, must in a meaningful way express to which extent an article can be said to belong to the fuzzy set of publications with delayed recognition. This membership function, as calculated at time T, is denoted as DR(T). If an article is not “recognized”, i.e. it does not belong to the 1% most cited, it is not ahead of its time and its DR(T) value is set equal to 0 for any T. Our approach is based on ideas from Ke et al. (2015) and Du and Wu (2018).
To the best of our knowledge Ke et al. (2015) were the first to state that suffering delayed recognition is not a yes-no situation. They introduced a parameter-free measure that quantifies the extent to which a specific paper can be considered to suffer delayed recognition. Papers with citations growing linearly with time have
B = 0. B is non-positive for papers whose citation trajectory is a concave function of time and positive for papers with a convex citation curve. Du and Wu (2017, 2018) proposed a similar measure, but based on the cumulative citation curve.
B = 0. B is non-positive for papers whose citation trajectory is a concave function of time and positive for papers with a convex citation curve. Du and Wu (2017, 2018) proposed a similar measure, but based on the cumulative citation curve.
We will calculate a partial membership function, denoted as K(t), for each time t between 10 and T. The final DR(T) value is then equal to:

The use of the maximum function in formula (3) avoids that the DR coefficient diminishes over time, which is against the definition of the concept of delayed recognition: once an article is accepted to have suffered delayed recognition this cannot be undone.
When determining K(t) for given t, we define C(n) equal to the cumulative number of received citations at the beginning of year n (where year 0 is the publication year) and hence C(0) = 0; c(1) = C(1) denotes the number of citations received during the publication year. If C(t) = 0 then K(t) is set equal to 0. If now C(t) ≠ 0, we consider the line y(n) connecting the origin (0,0) with the point (t, C(t)). This line, which we call the recognition line at time t, has equation
Now we calculate the sum of the differences in each n, 0 ≤ n ≤ t, between the line y(n) and the cumulative citation curve C(n). This sum is denoted as S(t).
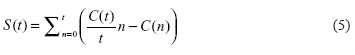
The largest possible value of S(t) occurs when all C(n) are zero except C(t).
This happens if the publication receives its first citation in the year t. Yet, we are not interested in that year, but just use this value as a reference. For this case,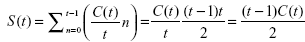 . Finally K(t) is defined as the ratio of the observed S(t) value over the largest possible one:
This happens if the publication receives its first citation in the year t. Yet, we are not interested in that year, but just use this value as a reference. For this case,
. Finally K(t) is defined as the ratio of the observed S(t) value over the largest possible one: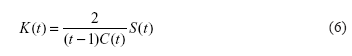
leading to a value between -1 and +1.
K(t) is negative if C(n) is always situated above the line y(n) and certainly positive when C(n) is always situated under this line. Yet, K(t) may also be positive when parts of C(n) are above the recognition line y(n).
We note that if an article receives its first citation in year 10 and is ‘recognized’ then, based on equation (3), its DR(T) value is equal to one, for all T ≥ 10.
5 Examples
Theoretical examples
If the cumulative citation curve is everywhere concave then K(t) is always negative and DR(T) = 0 for every T. Similarly, if c(n) is constant: c(n) = a > 0, then C(n) = a*n and the recognition line has equation y(n) = a*n. Clearly, also here DR(T) = 0, agreeing with the fact that there is no delayed recognition.
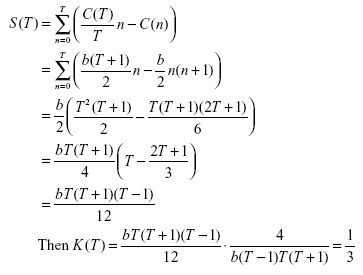
If citations grow linearly in time, then c(n) = b*n (b > 0), C(n) = b*n(n+1)/2 and C(T) = b*T(T+1)/2 and hence  . Consequently, DR(T) = 1/3 (The calculation is included in the appendix). This result is different from the one obtained by using Ke et al.’s B. Their B-value is zero, although citations grow with time, indicating a delay in recognition. We further remark that this value for linear growth can be used as a kind of benchmark when comparing to other citation curves. Recall that linear growth in citation corresponds to quadratic growth in cumulative citations as illustrated in
 Figure 1 for b = 0.5.
. Consequently, DR(T) = 1/3 (The calculation is included in the appendix). This result is different from the one obtained by using Ke et al.’s B. Their B-value is zero, although citations grow with time, indicating a delay in recognition. We further remark that this value for linear growth can be used as a kind of benchmark when comparing to other citation curves. Recall that linear growth in citation corresponds to quadratic growth in cumulative citations as illustrated in Some real-world examples
In this contribution we provide three examples, leaving more investigations to further research.
As a real-world example we begin with Romans’ article (Romans, 1986), an article studied by van Raan (2004). This article got its first citation in 1995 (n = 10), followed by 11 more in 1996. Since then it kept on receiving citations with a peak in 1999, in which year it received 32 citations. The WoS includes 520,862 publications of article type published in 1986. Among these, the article ranked 5209 received 229 citations. As Romans’ article received 374 citations it belongs to the top 1% most-cited (data collected on June 5 2018). Figure 2 shows the cumulative citation curve, the recognition line for the year 2017, when K(2017) is 0.241 and the recognition line in the year 1996. Its DR value is equal to 1.0 obtained in the year 1996, which is the first year for which we perform a calculation. Hence DR(T) = 1 for all T ≥ 10. We recall that these calculations are performed at the beginning of the year: n = 0 correspond to the publication year and citations received during the publication year are associated with the year n=1.
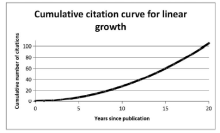
Figure 1. Quadratic cumulative growth corresponding to linear growth. |
Next we consider Leaky et al. (1964). This article has been studied as a sleeping beauty in (Tobias, 1996). The WoS contains 127,018 publications of article type published in 1964. Among these the article ranked 1271 received 242 citations. As Leakey et al. (1964) received 348 citations it belongs to the top 1% most-cited (data collected on June 5 2018). Its DR-value is 0.225 which is obtained in the latest year studied, namely 2017. This value is smaller than the benchmark value of 0.333 obtained for linear growth. Its lowest K(n) value is -0.084, which was obtained for n = 39 (the year 2003). Note that this value was obtained several years after Tobias (1996) had declared this article to be a sleeping beauty! Figure 3 shows the cumulative citation curve, its final recognition line and the situation in the year 2003, when the recognition line was situated under the citation curve.
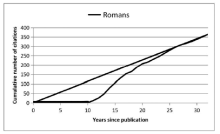
Figure 2. Cumulative citation curve of Romans (1986) and two recognition lines. |
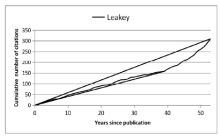
Figure 3. Cumulative citation curve of Leakey et al. (1964) and two recognition lines. |
Table 1 K-values for Leakey et al. (1964). |
| Year t | K(t) | Year t | K(t) | Year t | K(t) | Year t | K(t) |
|---|---|---|---|---|---|---|---|
| 1974 | 0.014 | 1985 | -0.019 | 1996 | -0.032 | 2007 | -0.007 |
| 1975 | 0.020 | 1986 | -0.055 | 1997 | -0.032 | 2008 | 0.027 |
| 1976 | 0.005 | 1987 | -0.053 | 1998 | -0.061 | 2009 | 0.061 |
| 1977 | -0.006 | 1988 | -0.011 | 1999 | -0.059 | 2010 | 0.060 |
| 1978 | -0.013 | 1989 | 0.013 | 2000 | -0.057 | 2011 | 0.085 |
| 1979 | -0.035 | 1990 | 0.016 | 2001 | -0.055 | 2012 | 0.102 |
| 1980 | -0.036 | 1991 | -0.015 | 2002 | -0.074 | 2013 | 0.145 |
| 1981 | -0.023 | 1992 | -0.026 | 2003 | -0.084 | 2014 | 0.151 |
| 1982 | 0.023 | 1993 | 0.005 | 2004 | -0.041 | 2015 | 0.164 |
| 1983 | 0.003 | 1994 | -0.022 | 2005 | -0.017 | 2016 | 0.194 |
| 1984 | -0.004 | 1995 | -0.023 | 2006 | -0.006 | 2017 | 0.225 |
This leads us to question Tobias’ paper (1996). What did he claim? It is important to know that, actually, Tobias was a co-author of the Leakey et al. (1964) paper. In his paper from 1996 he described how their findings were not accepted by their colleagues, but that step by step the original objections against their findings and corresponding theory fell away and, in his words, by 1984 their findings were accepted. This happened twenty years after their publication and hence, these findings were—rightly—described as a premature discovery. Honesty forces us to include that even today the exact position of Homo habilis in the development of the genus Homo is not yet convincingly determined.
The citation curve does not show any sign of this observation. We think this illustrates the very important fact that using citations is just an operationalization and experts may, rightly, have other opinions. We note that this article and Romans’ are also under-cited influential and hence citation chimeras in the sense of (Hu & Rousseau, 2018). This term refers to the fact that these articles are exceptional in terms of received citations and in terms of second-generation citations.
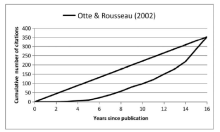
Finally, we consider one of our own articles, namely (Otte & Rousseau, 2002). Again, we first check if it belongs to the top 1% most-cited articles. The WoS contains 813,472 publications of article type published in 2002. Among these the article ranked 8,135 received 280 citations. As Otte and Rousseau (2002) received 368 citations it belongs to the top 1% most-cited (data collected on June 5, 2018). The K(t)-values first decline somewhat before they start increasing. Only in the latest year the maximum is reached: DR(2017) = 0.523. The cumulative citation curve and the recognition line for 2017 are shown in Figure 4 .
Figure 4. Cumulative citation curve of Otte and Rousseau (2002). |
Table 2 K-values for Otte and Rousseau (2002). |
| Year t | K(t) |
|---|---|
| 2011 | 0.515 |
| 2012 | 0.480 |
| 2013 | 0.476 |
| 2014 | 0.455 |
| 2015 | 0.464 |
| 2016 | 0.477 |
| 2017 | 0.523 |
6 Conclusion
We reviewed recent developments related to the study of delayed recognition, leading to the idea to consider delayed recognition as a fuzzy concept. We proposed a method to obtain fuzzy membership values. One of the requirements for suffering delayed recognition, is that the article must belong to the 1% most-cited ones. This means that at most 1% of the articles under consideration have a non-zero fuzzy membership value, and probably much less than 1%. The value 0.333 for linear growth in citations can be considered a benchmark for comparisons.
Besides proper hibernators (sleeping beauties) who have a long period with no or few citations, articles suffering delayed recognition may have a convex cumulative citation curve, such as in the case of linear growth in citations. Examples of these two types are shown in this contribution: Romans (1986) being a proper hibernator and Leakey et al. (1964) and Otte & Rousseau (2002) being examples of the second type.
We made the important observation that using citations to study delayed recognition is just a—convenient—operationalization of the concept, but that experts may agree on delayed recognition long before this is shown by citations. This is illustrated by the case of Leakey et al. (1964). This leads to the question: How good (adequate) is citation analysis for detecting premature discoveries?
As this contribution is just a feasibility study, many questions are left unanswered, such as:
(1) What are typical values for membership functions?
(2) Wouldn’t it be better to use normalized citation scores instead of absolute ones as done here? If so, how to normalize: with respect to the database, with respect to the field, or both (Bornmann et al., 2018)?
(3) Can this framework, by focusing on negative values and years immediately after the publication year, also be used for characterizing early recognition (flash-in-the-pan)? If so, how?
These questions are left as topics for further research.
Finally we mention the obvious limitation: as all citation studies also this one is database dependent.
Appendix: Calculation of DR(T) in the case of a linear increase in citations.