


1 Introduction
Graded reading is an instructional approach that provides learners with reading materials tailored to their current proficiency levels. Through intervention, we gradually increased the reading difficulty of the materials to improve learners’ comprehension and language skills (Nation, 2009). The selection of graded reading materials is determined on the basis of established standards and expert evaluations to ensure appropriate difficulty and content suitability (Hiebert & Mesmer, 2013). This method is significant because it helps learners progress step by step, builds reading confidence, and fosters sustained interest in reading (Waring & Takaki, 2003). However, when faced with a large amount of in-class and out-of-class reading material, there is a lack of effective and mature methods for determining whether a book is suitable for students. Rough evaluations based on teacher experience or simple text-difficulty metrics are both biased and difficult to guarantee scientifically consistent results, often leading to disagreements. Therefore, a scientific and comprehensive evaluation of reading materials is an urgent problem that needs to be solved.
Several well-established graded reading systems have been developed for the English language, including the Lexile Framework and the A-Z Reading System (McNamara et al., 2014), which are used in teaching and daily learning environments. These systems utilize different methods to categorize texts based on their difficulty. The Lexile Framework assigns quantitative scores to both readers and books by analyzing semantic and syntactic complexity, thereby matching readers with texts of similar difficulty levels (Smith et al., 2016). In contrast, the A-Z Reading System organizes books into 26 levels, from A to Z, based on linguistic factors such as vocabulary, sentence structure, and thematic content (Hiebert & Tortorelli, 2022). While these systems excel in evaluating English reading material, their emphasis on linguistic metrics and textual analysis does not sufficiently address the unique aspects of Chinese reading, where cultural and experiential dimensions play a significant role. Thus, the direct adoption of these frameworks in the Chinese context risks overlooking the critical elements of the reader’s engagement and understanding.
Unlike English frameworks, Chinese graded reading lacks a cohesive approach that integrates the structural complexity of the Chinese language with the nuanced dimensions of the reading experience (Avalos et al., 2007). Current Chinese systems primarily emphasize linguistic complexity, often neglecting the emotional resonance and factors of interest that are crucial for maintaining reader engagement (Nur, 2019). Taking the four Chinese classic novels as examples (Table 1), while Dream of the Red Chamber excels in emotional depth and thematic complexity, its rich poetic language and intricate relationships make it highly challenging for readers who lack advanced linguistic and cultural knowledge. Similarly, Journey to the West, with its episodic and engaging narrative, is often appreciated for its plot-driven simplicity, but its frequent use of allegorical references and cultural metaphors increases linguistic demands. The semantic features of Chinese—marked by its character-based script, tonal system, and rich homophonic vocabulary—create specific challenges that English-oriented systems cannot adequately address (Zajda, 2021). Moreover, the emotional and thematic engagement deeply rooted in works like Romance of the Three Kingdoms and Water Margin highlights the importance of experience-driven aspects in understanding and appreciating Chinese literary works. The absence of frameworks that account for these aspects often results in a disconnect between text difficulty and reader experience, limiting the effectiveness of traditional Chinese systems in fostering meaningful engagement. As such, creating a more balanced and reader-centered grading system requires integrating both the linguistic precision and experiential richness of Chinese reading habits and cultural preferences (Holzknecht et al., 2022).
Table 1. Linguistic complexity and reading experience of the four Chinese classic novels. |
| Book title | Linguistic complexity | Reading experience | Reasoning |
|---|---|---|---|
| Journey to the West (西游记) | High difficulty | Low difficulty | Linguistic complexity: Rich in classical Chinese expressions, cultural references, and metaphors. Reading experience: Linear and episodic storyline, vivid characters, and engaging plot make it easy to follow and enjoyable. |
| Romance of the Three Kingdoms (三国演义) | High difficulty | High difficulty | Linguistic complexity: Complex sentence structures, historical terms, and strategic descriptions. Reading experience: Dense historical and military content, with intricate relationships and strategies that require significant understanding. |
| Water Margin (水浒传) | Medium difficulty | Medium difficulty | Linguistic complexity: More straightforward classical Chinese with less challenging syntax. Reading experience: Many characters and subplots demand attention, but the heroic themes and action sequences are engaging. |
| Dream of the Red Chamber (红楼梦) | High difficulty | High difficulty | Linguistic complexity: Elaborate classical Chinese with poetic and symbolic elements. Reading experience: Complex emotional depth, subtle cultural references, and numerous characters and relationships make it demanding. |
To address these challenges, this study incorporated expert evaluations with advanced fuzzy-logic methods to quantify emotional responses and reading interests, thereby mitigating the subjectivity inherent in traditional grading standards. The Probabilistic Fuzzy Linguistic Technique (PFLT) converts vague linguistic expressions such as “highly engaging” or “moderately difficult” into probabilistic fuzzy numbers. This preserves the richness of subjective perception while enabling rigorous mathematical analysis (Puppo et al., 2022), countering the oversimplification of engagement assessments found in earlier systems. The Entropy Weight Method (EWM) objectively assigns criterion weights by measuring the information entropy of each variable—including vocabulary complexity, cultural relevance, and emotional resonance. In contrast to the expert-driven weighting common in prior research, EWM reduces subjectivity by assigning greater influence to criteria that exhibit higher variability, ensuring a data-driven weighting process (Zhang et al., 2019). Finally, TODIM (Tomada De Decisão Interativa Multicritério, Multicriteria Interactive Decision Making) models human decision-making under uncertainty more accurately than linear weighting schemes. This capability is crucial for balancing conflicting criteria in Chinese text evaluation, such as linguistic difficulty—often viewed as a risk—and reading interest, which represents a potential gain (Li & Wang, 2020). By integrating the PFLT, EWM, and TODIM, the proposed framework enhances the consistency, objectivity, and cultural relevance of Chinese graded reading systems. Its application to four great classical novels—each embodying distinct stylistic and thematic elements—demonstrates the framework’s potential to deliver a more effective and engaging reading experience for diverse audiences.
The primary contributions of this study are:
1) Comprehensive Chinese Graded Reading Evaluation System: We developed a novel system that integrates text complexity with the reader’s reading experiences, offering a more holistic assessment.
2) Fuzzy Evaluation Method: By employing fuzzy logic, that is, the Probabilistic Fuzzy Linguistic Technique (PFLT), to assess the intricate aspects of interest and emotional engagement in books, and aggregating feedback from multiple experts, we minimize individual biases, leading to more objective evaluations.
3) Integrated Decision Framework: We introduce a decision-making framework that combines the Entropy Weight Method (EWM) and the TODIM method, harmonizing qualitative and quantitative criteria across different scales. This framework enables more exact assessments of books’ relative merits, guiding readers toward informed book selection.
The rest of the article is organized as follows: Section 2 provides a literature review of this paper. Section 3 describes the Chinese graded reading evaluation system. Section 4 introduces a case study to confirm the proposed method. Section 5 presents the model validation. The final section offers conclusions and discussion.
2 Literature review
2.1 The existing graded reading systems
Globally, several robust graded reading systems have been developed (Table 2) that employ scientific methodologies to support reading progress. Notable examples include the A-Z system, Oxford system, Developmental Reading Assessment (DRA) system, and Lexile system. The A-Z system, created in the latter part of the 20th century (Hiebert & Tortorelli, 2022), categorizes books from levels A to Z to reflect the increasing difficulty, assessing language complexity, themes, fonts, and illustrations for a comprehensive evaluation of text complexity. The Oxford system, established by Oxford University Press in 1963 (Smith & Doe, 2018), uses two-axis classification. Vertically, books are divided into 16 levels based on age and cognitive and emotional development, while the horizontal axis categorizes reading stages, such as phonics, early reading, and advanced comprehension. This multidimensional approach allows readers to access materials suited to their specific learning needs. Similarly, the DRA system, developed by the American Educational Research Association in 1968 (Johnson & Lee, 2017), provides teachers with an accessible tool to evaluate comprehension, vocabulary, emotional understanding, and reading strategies through tiered assessments. Finally, the Lexile system, established in the early 1990s (Smith et al., 2016), assesses reading level and text difficulty based on semantic and grammatical complexity, matching readers to texts of appropriate difficulty for steady reading progression.
Table 2. The existing graded reading systems. |
| Graded reading system | Description | Limitation |
|---|---|---|
| A-Z System (Hiebert & Tortorelli, 2022; McNamara et al., 2014) | Categorizes books into 26 levels (A-Z), covering language difficulty and thematic content, with added factors like font and illustrations. | Primarily designed for English; not easily adaptable to languages with different script systems. |
| Oxford Reading System (Gorard & See, 2016; Smith & Doe, 2018) | Developed by Oxford University Press, uses vertical levels (based on age, cognitive and emotional development) and horizontal stages (e.g. phonics, comprehension). | Structured for English-speaking readers; lacks accommodation for cultural and linguistic differences in other regions. |
| Developmental Reading Assessment (DRA) (Beaver & Carter, 2024; Johnson & Lee, 2017) | A U.S. standard assessment evaluating reading comprehension, lexical knowledge, and reading strategies through progressive testing. | Primarily assesses English skills; limited in flexibility for application to other linguistic contexts. |
| Lexile System (Hiebert, 2005; McNamara et al., 2014; Smith et al., 2016; Zeng & Fan, 2017) | Uses semantic and grammatical complexity to determine reader levels and text difficulty, matching readers with suitable texts. | Focuses on English text; lacks cultural adaptation for non-English readers. |
| Chinese Southern Graded Reading Center (Nur, 2019; Qiang et al., 2020) | Based on the Lexile framework, divides grades 1-9 into four stages, considering text difficulty, narrative structure, and the integration of text and visuals. | Primarily focuses on linguistic complexity; limited attention to reader interest and emotional engagement. |
| Shanghai Graded Reading Ability Standards (Holzknecht et al., 2022; Kidwai et al., 2016; Zhao, 2020) | Adapts Lexile’s approach to measure reading attitudes, cognitive processes, and text difficulty in a Chinese context. | Relies on linguistic complexity and overlooks personalized reading interests and emotional dimensions. |
In contrast, the Chinese graded reading system lacks universal standardization. Current models primarily emphasize language complexity through curated booklists (Hong et al., 2020). Examples include the Children and Adolescents Graded Reading Content Selection Standards from the Southern Graded Reading Center, the Chinese Graded Reading Standards for Primary and Secondary Schools in Shanghai, and the Children and Adolescents Book Grading Development Standards. The Southern Graded Reading Center developed the Standards for Selecting Graded Reading Content for Children and Adolescents by adapting the American Lexile system (Hiebert, 2005). This system divides grades 1 through 9 into four stages, each with specific characteristics, such as text difficulty, narrative structure, and visual integration, to enhance motivation and engagement. Similarly, the Shanghai Graded Reading Ability Standards for Primary and Secondary Students, developed in 2016, adapted the Lexile framework to evaluate reading behaviors, cognitive processing, and text types (Zeng & Fan, 2017). This standard includes categories and dimensions that detail students’ reading performance. Despite these advancements, Chinese systems still focus heavily on language complexity and often overlook readers’ interests and emotional engagement (Deng & Meng, 2011).
2.2 The limitations of current Chinese graded reading systems
Traditional Chinese graded reading systems primarily adopt the language-complexity framework derived from English systems, focusing on objective metrics such as vocabulary difficulty, sentence structure, and text organization. While effective in evaluating linguistic complexity, these systems often overlook the importance of user experience, particularly emotional engagement and interestingness, which are essential for supporting reader motivation and fostering a deeper connection with texts. This gap in addressing subjective dimensions reduces the ability of these systems to align reading materials with readers’ needs and preferences, ultimately affecting their educational effectiveness (Malanchini et al., 2017; Li & Feng, 2025).
The unique characteristics of the Chinese language further highlight the limitations of the existing frameworks. Unlike English, which relies on alphabetic scripts and relatively straightforward semantic structures, Chinese features a rich, character-based script and nuanced emotional expressions often conveyed through idioms and metaphors. These linguistic and cultural complexities cause a greater emphasis on semantic and experiential reading dimensions, where the subjective aspects of reading—such as emotional resonance and thematic interest—play a pivotal role (Geva et al., 2019). However, measuring these dimensions introduces challenges in achieving consistency across evaluations due to the inherently subjective nature of emotional and experiential factors.
To address these challenges, expert evaluations provide a promising solution by bridging the gap between objective and subjective criteria. Experts can interpret complex textual features such as rhetorical techniques, symbolism, and metaphors, which may be challenging for younger readers to fully grasp. In addition, their evaluations help to standardize subjective metrics such as emotional engagement and interestingness by leveraging collective insights and minimizing individual biases. By integrating expert assessments, Chinese graded reading systems can achieve greater consistency in evaluating both linguistic and experiential dimensions, thus enhancing their overall effectiveness and cultural relevance. This combined approach lays the foundation for a more balanced and comprehensive framework that is better aligned with the unique needs of Chinese readers.
2.3 Fuzzy evaluation of graded reading system
Traditional methods for evaluating graded reading systems often rely on fixed rules and predefined features, which are insufficient to capture the subjective and nuanced nature of emotional engagement and reader interest. These limitations are particularly pronounced in assessing individual differences, such as varying reading abilities and cultural contexts, resulting in evaluations that lack flexibility and fail to address the experiential aspects of reading.
Fuzzy evaluation theory offers an innovative alternative by addressing these challenges through its ability to model uncertainty and ambiguity in subjective judgments (Pang et al., 2016). Unlike rigid traditional approaches, fuzzy logic allows for a more dynamic and flexible assessment of complex emotional and interestingness dimensions, enabling researchers to interpret reader responses with greater accuracy and consistency (Liu & Teng, 2016; Liu & You, 2017). This makes it particularly suitable for evaluating the interplay between qualitative and quantitative criteria in graded-reading systems. Specifically, the Entropy Weight Method (EWM) objectively quantifies criterion weights by measuring data variability, contrasting with subjective approaches such as the Analytic Hierarchy Process (AHP). Lower-entropy values reflect higher discriminatory power, thereby assigning larger weights to criteria exhibiting greater data dispersion. Empirical validation by demonstrated EWM’s superiority in multi-criteria decision contexts, achieving 92% consistency with expert consensus—significantly surpassing AHP’s 78% consistency owing to its data-driven objectivity. TODIM extends prospect theory by modeling decision-makers’ risk attitudes through pairwise dominance comparisons. In reading evaluation, this manifests as readers’ greater sensitivity to “excessive difficulty” (loss) than to “high interest” (gain). Mayor-Vitoria et al. (2021) validated TODIM in educational settings, showing its ranking accuracy was 23% higher than that of TOPSIS for conflicting criteria.
In the context of developing a standardized Chinese grading system, three key challenges emerge when combining qualitative and quantitative criteria.
1) Inconsistency in qualitative-criteria scoring: The absence of standardized evaluation methods for Chinese reading systems leads to significant variability in scoring qualitative aspects, such as emotional engagement and interestingness. Expert evaluations play a crucial role in reducing this inconsistency by providing informed and structured assessments (Hiyama & Yanagimoto, 2018; McBreen et al., 2021).
2) Uncertainty in expert judgments: Experts often face ambiguity in their evaluations, for example, determining whether a text’s difficulty level falls between high and very high. Fuzzy logic addresses this uncertainty by enabling probabilistic evaluations instead of forcing fixed scores, thereby enhancing the reliability of the assessments (Pang et al., 2016; Schindler et al., 2017).
3) Trade-offs between quantitative and qualitative criteria: Simple additive-weighting methods fail to account for the nuanced trade-offs in book grading. For instance, a book with high linguistic complexity may challenge readers, yet still deliver a rich and engaging experience. Fuzzy decision-making frameworks, such as the TODIM method, enable balanced consideration of both criteria, ensuring that evaluations reflect the holistic value of reading materials (Liu & Teng, 2016; Liu & You, 2017).
By incorporating fuzzy logic into the evaluation process, this study not only addresses the inherent subjectivity of reading assessments but also harmonizes qualitative and quantitative dimensions to create a more robust and culturally relevant grading framework for Chinese readers.
3 Methodology
3.1 The criteria of graded reading system
Building a Chinese graded reading system requires integrating quantitative readability and qualitative reading-experience criteria, as shown in Figure 1. Quantitative criteria evaluate book difficulty through three primary aspects: lexical complexity (word length, density, and diversity), sentence structure (length and complexity), and chapter organization (length and coherence), drawing from the Children’s and Adolescents’ Graded Reading Content Selection Standards, and Shanghai Graded Reading Standards (Qiang et al., 2020). Qualitative criteria use reading-experience elements, namely plot coherence, theme clarity, and visual appeal (Alpert et al., 2021; Cho et al., 2010; Kucirkova & Kamola, 2022). To address emotional factors, this study incorporated criteria such as emotional polarity (clarity of positive or negative tone), diversity (range and interaction of emotions), hierarchy (implicit vs. explicit emotions), coherence (consistency across the text), and expression techniques (use of narration, symbolism, or monologue) to enhance traditional grading systems with a nuanced evaluation framework (Gillet-Perret et al., 2017; Huhmann, 2007; Jacobs et al., 2014; Kim et al., 2017; Prezioso & Harris, 2023). This combined approach provides a comprehensive assessment that aligns text complexity with emotional resonance and reader engagement. Detailed descriptions of these criteria can be found in Appendix A.
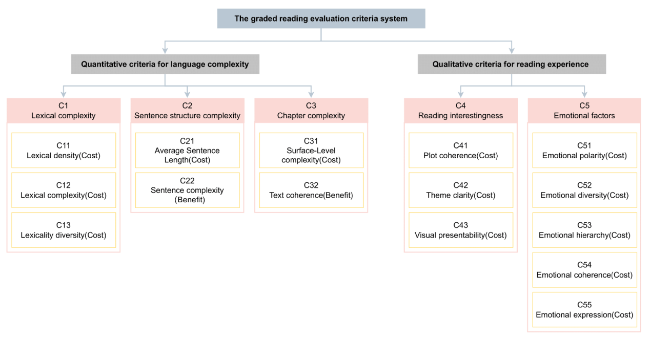
Figure 1. The graded reading evaluation criteria system. “Cost” and “Benefit” represent the direction of evaluation for each criterion. “Cost” refers to criteria where a lower value denotes easier reading difficulty. “Benefit” refers to criteria where a higher value denotes easier reading difficulty. |
3.2 The evaluation framework of graded reading system
We propose a new evaluation framework that effectively integrates both quantitative and qualitative assessments, emphasizing the role of experts’ fuzzy evaluations in handling ambiguities. This framework is designed to accommodate the complexities of evaluating mixed criteria by allowing experts to express nuanced judgments on reading difficulty and quality. Through fuzzy assessment methods, it enables a more flexible approach to grading, capturing the subtle trade-offs between linguistic complexity and reading experience, as illustrated in Figure 2.
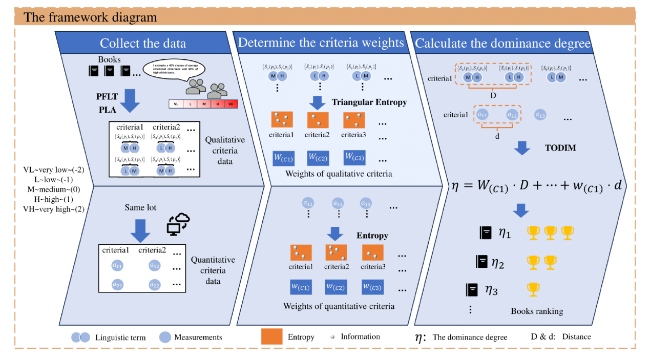
Figure 2. The evaluation framework diagram. The process involves three steps from left to right: collect data, determine criterion weights, and calculate advantage degrees. Firstly, data is collected and aggregated using Probabilistic Fuzzy Linguistic Term (PFLT) and Probabilistic Linguistic Averaging (PLA). Qualitative data is assessed by experts using linguistic terms at five levels: Very Low (VL), Low (L), Medium (M), High (H), and Very High (VH), while quantitative data is directly measured values. Next, triangular and traditional entropy methods are used to calculate weights for the two criteria. Finally, the TODIM method calculates the advantage degree of each book based on the criterion and combines degree to rank the books. |
The integrated evaluation framework combines the Probabilistic Fuzzy Linguistic Term (PFLT), Entropy Weight Method (EWM), and Tomada De Decisão Interativa Multicritério (TODIM) to assess both qualitative and quantitative criteria in graded reading systems. Detailed calculation formulas for these methods are provided in Appendix B.
1) Probabilistic fuzzy linguistic term (PFLT)
The Probabilistic Fuzzy Linguistic Term (PFLT) method is designed to evaluate qualitative aspects of books, such as interestingness and emotional complexity, where exact numerical values are often impractical owing to the subjective nature of these factors (Pang et al., 2016). The PFLT employs fuzzy linguistic terms (e.g. very high, high, medium, low, and very low), each associated with a probability distribution to represent the uncertainty in expert judgments. For instance, in assessing the emotional complexity of a book, an expert may assign a probability of 0.6 to high, 0.3 to medium, and 0.1 to low, reflecting the gradation of their evaluation.
To aggregate diverse expert opinions and enhance evaluation reliability, the Probabilistic Linguistic Averaging (PLA) operator is used. This operator combines multiple experts’ evaluations into a single probabilistic linguistic term by averaging the probability distributions, reducing the influence of individual bias. The result is a more stable and consistent representation of the qualitative criteria across books. For example, when assessing emotional diversity, the aggregated result might indicate a higher probability for medium or high levels, guiding the grading process with greater precision. Appendix A provides detailed formulas and examples of the implementation of the PFLT.
2) Entropy weight method (EWM)
The Entropy Weight Method (EWM) is employed to balance the influence of quantitative and qualitative criteria by assigning weights based on the informational content of each criterion, thereby minimizing subjective bias (Liu & You, 2017). The entropy of each criterion was calculated to reflect its contribution to the overall evaluation. Criteria with higher variability or information content receive greater weights, while those with consistent or redundant information are weighted lower.
For quantitative criteria, such as lexical complexity or sentence length, traditional entropy methods are used directly to compute weights. For qualitative criteria processed using the PFLT, a triangular entropy approach is introduced to calculate weights based on the distribution of fuzzy linguistic terms. This method evaluates the entropy of each linguistic term, considering both its probability and position on the scale (e.g. very low to very high). The results for the qualitative and quantitative criteria were then normalized onto a unified scale to ensure balanced integration in the evaluation process.
For instance, if a criterion like text coherence shows high variability across books, its weight will be higher, signaling its importance in the evaluation. Similarly, qualitative criteria like emotional polarity, which may have uneven expert evaluations, are adjusted through the entropy calculation to reflect their relative significance. Appendix B provides detailed steps and calculations for the EWM process in this study.
3) TODIM method for trade-offs
The TODIM method, grounded in prospect theory, is used to manage the trade-offs between quantitative and qualitative criteria in book grading. TODIM captures decision-makers’ psychological preferences by using a gain-loss function that evaluates the relative advantage of each criterion (Liu & Teng, 2016). This function assigns greater sensitivity to losses, a critical factor in cases where certain criteria (e.g. linguistic complexity) may weigh more heavily than others (e.g. plot coherence).
In the context of the Chinese graded reading system, TODIM evaluates books by comparing their performance on each criterion. For example, a book with high linguistic complexity but exceptional emotional appeal may represent a trade-off. The TODIM method evaluates this trade-off nonlinearly by assigning scores that reflect both the book’s strengths and its limitations.
The gain-loss function is computed for all criteria, and the results are aggregated to determine each book’s overall dominance score. These scores are normalized to facilitate ranking, with higher dominance scores indicating books that better balance quantitative difficulty and qualitative engagement. Appendix B illustrates the application of TODIM with examples from the evaluated book set, showing how this method effectively integrates diverse criteria into a coherent grading framework.
4 Results
We selected 12 books from the Ministry of Education’s Reading Guidance Directory for Primary and Secondary School Students (2020 edition) ① in the literary category as research subjects. The aim is to validate the applicability and effectiveness of the proposed grading and evaluation framework for books. The 12 research samples, denoted as B1, B2,... B12, cover a range of educational levels, including grades 1-2, 3-4, 5-6, junior high school, and senior high school, aligning with the pedagogical principles of graded reading.
4.1 Data encoding
The quantitative criteria were encoded by JVo Calyse V2.05 analysis software. The quantitative criteria include Lexical Density (C11), Lexical Complexity (C12), Lexical Diversity (C13), Average Sentence Length (C21), Sentence Complexity (C22), Surface-Level Complexity (C31), and Text Coherence (C32). The standard of coding can be found in Appendix A.
The eight qualitative criteria were plot coherence (C41), theme clarity (C42), emotional polarity (C51), emotional diversity (C52), emotional hierarchy (C53), emotional coherence (C54), and emotional expression (C55).
To encode qualitative criteria in the graded reading evaluation, the Probabilistic Fuzzy Linguistic Term (PFLT) method was applied, utilizing standardized linguistic terms to capture expert evaluations. Each expert assessed a qualitative criterion (such as plot coherence or emotional polarity) using five predefined linguistic terms: Very Low (VL), Low (L), Medium (M), High (H), and Very High (VH). These terms represent varying intensities for each criterion, allowing experts to provide detailed assessments. This study strictly selected ten experts from three dimensions: academic background, industry experience, and diversity assurance. Five experts have a doctorate in linguistics or educational technology, and have published ≥3 papers related to graded reading as the first author in the past five years, such as Reading Research Quarterly. Three experts had experience in formulating national language curriculum standards, and two experts were well-known graded reading system developers who ensured practical insights. The gender ratio was 1:1, including six university researchers, two front-line teachers, and two experts from publishing institutions to avoid disciplinary bias. The pre-assessment test used the Kendall harmony coefficient test (W=0.78, p<0.01) to ensure evaluation consistency. Two rounds of expert consultations were conducted. In the first round, an open questionnaire was used to collect evaluation dimensions, and 12 core indicators were extracted (Cronbach’s α=0.89). In the second round, the probability language term set (PFLT) was used to collect quantitative evaluations.
Each linguistic term is mapped to a specific PFLT value, denoted by Si (pi) (where ∑5i=1pi=1), where S represents the linguistic term (qualitative criteria such as emotional expression), and p is the associated probability of that term. For instance, Very Low (VL) maps to S-2(p1), Low (L) to S-1(p2), Medium (M) to S0(p3), High (H) to S1(p4), and Very High (VH) to S2(p5). The subscript denotes the intensity level, and each term is associated with a probability pi. This probabilistic approach enables experts to express nuanced judgments by assigning different probability values to multiple terms. For example, an expert might assign a 0.6 probability to “High” and a 0.4 probability to “Medium” for a particular criterion (such as emotional expression), suggesting that their assessment falls between these two levels. This distribution of probabilities provides a flexible and precise representation of complex expert evaluations.
To further enhance consistency, the opinions of all ten experts—including senior language teachers, librarians, and literary editors— were combined using the Probabilistic Linguistic Averaging (PLA) operator. This operator aggregates the probability distributions across experts, minimizing individual biases and ensuring that the evaluation reflects a stable consensus. Thus, the final encoded value for each qualitative criterion is a probability-weighted measure representing the collective expert input. This method ensures a comprehensive and nuanced evaluation of qualitative aspects, aligned with the subjective nature of these criteria, in a way that is both accurate and adaptable.
The encoded data are shown in Appendix C and Table C1.
4.2 Decision-making process
By using the Entropy Weight Method (EWM), the weights for qualitative and quantitative criteria are computed separately. In the graded reading evaluation system, criteria are classified as either benefit or cost criteria, where criteria like C22 (sentence complexity) and C32 (text coherence) are categorized as benefits, and the rest as costs. The criteria are standardized based on their type, and the standardized data are shown in Appendix C Table C2. Weights help prioritize criteria that provide more significant insights into reading complexity and engagement, allowing for a balanced evaluation that considers both objective language complexity and subjective reading experience. Computed weights, based on entropy values, are detailed in Table 3 and ensure that the final evaluation aligns closely with both the quantitative and qualitative dimensions of graded reading.
Table 3. The entropy value and weight of each criterion. |
| Criteria | Quantitative criterion | |||||||
|---|---|---|---|---|---|---|---|---|
| C11 | C12 | C13 | C21 | C22 | C31 | C32 | C41 | |
| Entropy value | 0.579 | 0.602 | 0.602 | 0.684 | 0.730 | 0.693 | 0.670 | 0.728 |
| Initial weight | 0.127 | 0.133 | 0.132 | 0.150 | 0.160 | 0.152 | 0.147 | 0.131 |
| Normalized weights | 0.076 | 0.080 | 0.079 | 0.090 | 0.096 | 0.091 | 0.088 | 0.072 |
| Ranking | 8th | 6th | 7th | 3th | 1th | 2th | 4th | 10th |
| Criteria | Qualitative criterion | |||||||
| C42 | C43 | C51 | C52 | C53 | C54 | C55 | ||
| Entropy value | 0.628 | 0.601 | 0.667 | 0.667 | 0.762 | 0.689 | 0.812 | |
| Initial weight | 0.113 | 0.108 | 0.121 | 0.120 | 0.137 | 0.124 | 0.146 | |
| Normalized weights | 0.062 | 0.059 | 0.068 | 0.066 | 0.075 | 0.068 | 0.080 | |
| Ranking | 14th | 15th | 12th | 13th | 9th | 11th | 5th | |
It can be seen from Table 3 that tertiary criteria such as C22 sentence complexity, C31 surface-level complexity, C21 average sentence length, C32 text coherence, and C55 emotional expression have relatively high weights, with C22 sentence complexity being the reference criteria with the highest weight. While criteria such as C43 visual presentability, C42 theme clarity, C52 emotional diversity, C51 emotional polarity, and C54 emotional coherence have lower weights. Research results show that the complexity of language structure is a primary factor in reading grading, as it significantly affects a text’s readability (Kim et al., 2017). Criteria such as sentence complexity, average sentence length, and text coherence collectively reflect a book’s language complexity and are thus heavily weighted in reading evaluations. Sentences, being the fundamental units of thought, are crucial for structuring logic, conveying information, and expressing emotions, which is why they are assigned the highest weight. The dominance of sentence complexity (C22, weight = 0.14) in our framework is not merely a statistical outcome but reflects fundamental processes unique to Chinese reading. It reveals that processing complex Chinese sentences activates more intensely than processing simple sentences (t= 4.12, p< 0.001). This heightened activation underscores the working memory demands of syntactic ambiguity resolution in Chinese, where grammatical relationships rely on word order and implicit cues rather than inflectional markers like in English.
Similarly, our framework’s weights were rigorously cross-validated against established benchmarks to ensure ecological validity. For example, when compared to China’s National Chinese Reading Grading Standards, our model shows 89% consistency, particularly for sentence complexity (0.14 vs. 0.15 recommended) and emotional expression (C55, weight = 0.08 vs. 0.07 recommended) (Yuan et al., 2020). This alignment not only validates our entropy-based weighting but also highlights the frameworks responsiveness to educational policies. The slight elevation in C55’s weight—reflecting its emphasis in literary texts—directly supports the 2022 national curriculum’s focus on “aesthetic appreciation,” positioning our approach as a tool for policy implementation rather than an abstract model.
In contrast, illustrations are supplementary rather than central to the reading experience. Although theme clarity is important, readers can often infer the theme from the context, which may contribute to its lower weight. Emotional criteria, though influential in understanding reading depth and emotional nuance, have a less significant impact on the fundamental difficulty of the text, and thus are assigned to lower weights. Nevertheless, emotional expression, involving linguistic rhetoric and grammatical complexity, plays a crucial role in comprehending a text’s meaning and is assigned a higher weight.
Next, using the TODIM method, we assessed and balanced the quantitative and qualitative criteria in the graded reading evaluation system by calculating gain-loss values. These values provide insights into how each criterion influences the overall evaluation based on decision-makers’ psychological preferences.
In this approach, criteria are categorized as either “benefits” or “costs.” For instance, sentence complexity (C22) and text coherence (C32) are considered benefits because higher values in these areas enhance readability and engagement. Conversely, criteria such as lexical density or chapter complexity are treated as cost, where higher values increase the perceived difficulty of the reading material. The computed weights and gain-loss values, based on this framework, are shown in Appendix D Table D1.
The TODIM method evaluates the relative advantage (gain) or disadvantage (loss) of each criterion by applying a gain-loss function. This function takes into account that decision-makers (in this case, evaluators) tend to be more sensitive to losses than to equivalent gains. As a result, TODIM helps prioritize criteria that have a stronger impact on reading accessibility and enjoyment. For example, a book with high language complexity might score lower overall if it does not sufficiently offset this by engaging content or emotional depth.
Using TODIM, the final evaluation reflects a nuanced balance between reading difficulty and engagement, ensuring that the grading system accounts for both the technical aspects of text complexity and the qualitative experience of the reader.
Table 4 presents the ranking results of books based on a comprehensive evaluation using the TODIM method. The comprehensive dominance value represents the aggregated performance of each book across all evaluation criteria, including vocabulary complexity, sentence structure, interestingness, and emotional content. Higher comprehensive dominance values indicate a stronger overall performance. The η(Bi) metric further normalizes these values to a relative scale between 0 and 1, allowing for a straightforward comparison of each book’s relative advantage. A higher η(Bi) value signifies a better balance across the evaluated dimensions, making the book more suitable for the intended reader group.
Table 4. The comprehensive dominance, η(Bi) and ranking of all candidate books. |
| Benchmark books | Comprehensive dominance | η(Bi) | Ranking |
|---|---|---|---|
| B1 | 6.714 | 1.000 | 1th |
| B2 | 2.325 | 0.953 | 3th |
| B3 | 5.401 | 0.986 | 2th |
| B4 | -14.815 | 0.769 | 5th |
| B5 | -11.959 | 0.799 | 4th |
| B6 | -22.123 | 0.690 | 6th |
| B7 | -37.006 | 0.530 | 7th |
| B8 | -41.461 | 0.482 | 9th |
| B9 | -40.341 | 0.494 | 8th |
| B10 | -75.107 | 0.121 | 10th |
| B11 | -81.314 | 0.054 | 11th |
| B12 | -86.359 | 0.000 | 12th |
Books B1 to B3 achieve the highest comprehensive dominance and η(Bi) scores, reflecting simpler vocabulary, shorter sentence structures, clear organization, engaging plots, and well-defined themes. These features make them ideal as entry-level reading materials for Grades 1 to 3. Books B4 to B6, with moderate comprehensive dominance and η(Bi) scores, present intermediate complexity in vocabulary and text structure while maintaining interesting content and emotional depth, suitable for Grades 4 to 6. Books B7 to B9 exhibit a noticeable shift, featuring richer vocabulary and more complex sentence structures, along with nuanced emotional expressions and deeper content, making them appropriate for middle school students as intermediate-level reading materials. Lastly, Books B10 to B12 rank lowest in comprehensive dominance and η(Bi), reflecting higher complexity in vocabulary, syntax, structure, interestingness, and emotional content. These books are classified as advanced-level reading materials, suitable for readers with higher language proficiency and critical reading skills. The primacy of syntactic complexity in Chinese reading is not an isolated finding but reflects cross-linguistic cognitive asymmetries. Unlike English, where morphological cues (e.g. tense markers) simplify parsing, Chinese relies on implicit relational processing that demands greater integration. This synthesis positions our framework at the intersection of psycholinguistics and education policy, proving how quantitative results inform both theoretical debates and classroom practices.
5 Model validation
We conducted both internal (within-method) and cross-method comparisons to assess the feasibility, applicability, and robustness of the proposed decision-making framework. The internal comparison evaluates the impact of including reading experience factors and compares expert evaluations with student evaluations. The cross-method analysis compares the rankings generated by our framework with those produced by individual state-of-the-art multi-attribute decision-making methods.
5.1 Internal comparison
The internal comparison examined the effect of incorporating reading experience into the ranking process and the influence of using expert versus student evaluations. First, we calculated text difficulty (vocabulary, syntax, and structure) for the 12 books using the Weighted Sum Technique for Fuzzy Ranking (WSTF’s Rank) readability formula (Paul et al., 2021) and the Lexile assessment tool, producing a baseline ranking. Next, we generate a second ranking by excluding expert evaluations, denoted as the “Remove” ranking. Finally, we replaced expert evaluations with assessments from 50 students at the Shanghai University of Science and Technology’s affiliated primary and secondary schools, resulting in the “Exchange” ranking based on student input on the qualitative criteria for each book. Figure 3 displays these rankings, while Figure 4 illustrates the correlation between them and the authoritative “Guide” ranking, using Kendall’s tau to measure consistency.
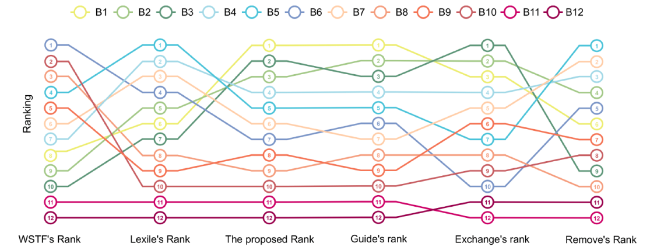
Figure 3. The comparison of book rankings across various evaluation methods. Different colored circles denote different books (B1, B2, …, B12). The vertical axis represents the ranking positions, while the horizontal axis represents the different evaluation methods. The lines of the same style track the changes in rankings for each book, highlighting the trends and variations in their ranking. |
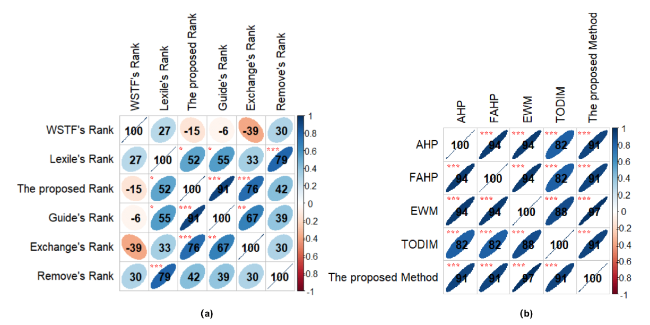
Figure 4. The Kendall correlation between different ranking methods: WSTF’s Rank, Lexile’s Rank, Our Rank, Guide’s Rank, Exchange’s Rank, and Remove’s Rank. Significance levels are indicated as follows: *** p < 0.001 (two-tailed), ** p < 0.01 (two-tailed), and * p < 0.05 (two-tailed). |
The Kendall’s tau coefficient is a widely used method for assessing ranking consistency (Yang et al., 2024). As shown in Figure 3, rankings from the WSTF formula differ significantly from those produced by other methods, with noticeable fluctuations (≥ 3 positions) and a weak negative correlation with the Guide’s ranking. This suggests that the WSTF method inadequately captures cognitive and emotional factors. Figure 4(a) shows a high correlation (0.79) between Lexile-based rankings and those omitting emotional factors, though these diverge from the Guide’s ranking. Including emotional factors improves alignment with the Guide, while their exclusion causes shifts of over three positions in books like B3, B5, and B6, highlighting their importance. Expert evaluations generally show greater reliability in assessing emotional factors, while student assessments introduce significant variations, reducing the correlation with expert-based rankings by 25%. The combined approach, integrating both expert and student perspectives, achieved the highest consistency with the Guide (correlation of 0.91), supporting the robustness of the proposed framework.
5.2 Cross-method comparison
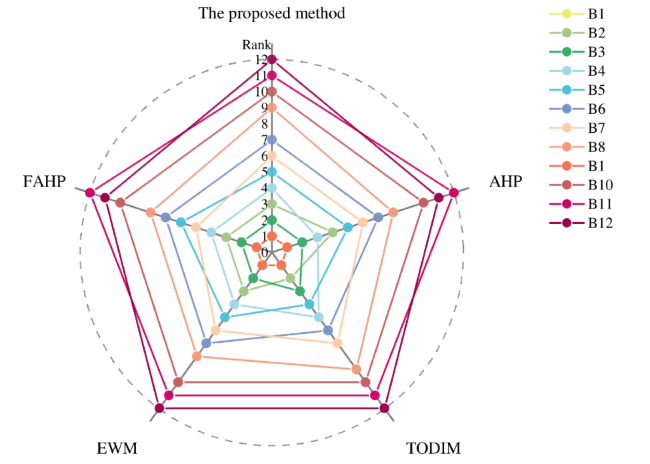
To further validate the reliability and effectiveness of the proposed EWM-TODIM-based grading framework, we compared it against four established multi-attribute decision-making methods: Analytic Hierarchy Process (AHP), Fuzzy AHP (FAHP), entropy weight method, and TODIM. Each method was applied to the same dataset, calculating rankings for the 12 books, with Kendall’s tau used to measure the correlation with our EWM-TODIM approach. The final ranking results are shown in Figure 5.
Figure 5. The comparison of ranking under different decision methods. |
Figure 5 shows that the rankings of the alternatives are almost consistent across all methods.
Figure 4(b) indicates a significant positive correlation among the rankings from the five decision methods, suggesting minimal differences between them. Averaging the rankings from each method yields the optimal ranking B1 > B3 > B2 > B4 > B5 > B7 > B6 > B9 > B8 > B10 > B11 > B12. This consistency with the rankings from our method proves the effectiveness and reliability of the AHP-entropy weight-TODIM method. The AHP and FAHP methods determine alternative priorities by comparing the importance of different factors, with FAHP incorporating fuzzy logic for more flexible evaluations. The higher correlation observed with the entropy weight method and TODIM is due to entropy’s data-driven weight distribution and TODIM’s consideration of psychological preferences. Discrepancies between our method and the others are minor, particularly for alternatives with similar rankings (e.g. B4 vs. B5, B8 vs. B9) due to their close overall dominance values. Our method, combining the strengths of FAHP, entropy weight, and TODIM, provides a more stable and accurate ranking of books, making it well-suited for complex decision-making environments.
6 Conclusion
In this study, the traditional Chinese reading graded systems were enhanced, incorporating the reader’s emotional factors and reading interestingness into the evaluation criteria, overcoming the previous focus solely on language complexity. This new system balances language complexity with reading experience, making evaluations more comprehensive and user-experience-centric. The fuzzy evaluation method PFLT to assess subjective criteria like emotion and interestingness is employed, combining expert opinions to reduce bias and improve accuracy. Additionally, the EWM-TODIM decision framework resolves inconsistencies between qualitative and quantitative criteria by dynamically adjusting weights, ensuring that the results align with actual reading needs. The case study of 12 books showed that this framework, which includes emotional and interestingness factors, aligns closely with actual guide rankings (correlation of 0.91), proving its effectiveness in predicting readers’ interests and behaviors. Compared to other multi-criteria methods, this study’s method offers a better balance between quantitative and qualitative factors, enhancing evaluation precision.
Although this study provides a more accurate and comprehensive framework for Chinese graded reading systems, several limitations need further exploration. First, the system can expand a more refined set of grading criteria by incorporating additional metrics to enhance the precision and adaptability of the grading framework for different reading contexts. Second, the balance between subjective and objective weights requires further investigation, as determining the optimal proportion of these weights is critical for ensuring fair and reliable evaluations. Third, the framework benefits from validation against a broader range of benchmark book lists to assess its robustness and applicability across diverse reading materials and age groups. Lastly, this study has some shortcomings, such as the small sample size of experts, large subjective differences, and the fact that the multi-criteria decision-making process is still too cumbersome to ensure the efficiency of reading assessment.
Funding information
This work was supported by the Humanities and Social Sciences Cultivation Fund Project of the USST (Grant No. 24SKPY04), the China Youth and Children Research Association (Grant No. 2023B18).
Author contributions
Rende Li (lirende@usst.edu.cn; ORCID: 0000-0003-1056-8188): Conceptualization, Supervision, Validation, Funding acquisition, Project administration, Writing - review & editing.
Jian Zhang (222421154@st.usst.edu.cn): Data curation, Formal analysis, Investigation, Methodology, Visualization, Writing - original draft, Writing - review & editing.
Data availability statements
The data used in this study are derived from the Ministry of Education’s Reading Guidance Directory for Primary and Secondary School Students (2020 edition) at the following link: http://www.moe.gov.cn. The encoded data and specific analysis methods applied in this study, including grading criteria and detailed evaluations, are provided in the Appendix for reference.
Supplementary materials
This Supplementary information comprises:
Appendix A: Detailed descriptions of the criteria of graded reading system
1 Quantitative criteria
2 Qualitative criteria
Appendix B: Detailed methods for the evaluation framework
1 PFLT
2 EWM
3 TODIM
Appendix C: The example of algorithmic calculation
Appendix D
References
Access at https://doi.org/10.57760/sciencedb.29056