


1 Introduction
“Industry-University-Research” (IUR) refers to the mutual cooperation among enterprises, universities, and research institutions to leverage their respective strengths and form an integrated innovation system that combines “Industry” (production), “University” (learning and scholarship), and “Research” (scientific inquiry). The existing research on IUR cooperation mainly focuses on the motives, models, and effects of cooperation. Researchers generally believe that enterprises, universities, and research institutions can achieve resource sharing and complementary advantages through cooperation, thereby accelerating technological innovation and the transformation of scientific and technological achievements (Leydesdorff & Martin, 2003). However, as research deepens, scholars have gradually realized that IUR cooperation is not static but constantly evolves with changes in the external environment and interactions among internal entities (Fischer et al., 2019). In recent years, research has gradually shifted to the structural characteristics of the cooperation network, the dynamic evolution mechanism, and the influencing factors. In terms of the structural characteristics of the cooperation network, researchers have found that the IUR cooperation network has complex and diverse characteristics. The entities in the network not only include enterprises, universities, and research institutions but also involve the government, financial institutions, and so on. These entities are interconnected through various means such as technological cooperation, talent exchange, and financial support, forming a complex ecosystem (Gui et al., 2019). Some studies have constructed cooperation network models and analyzed structural indicators such as network density, centrality, and clustering coefficients, revealing the degree of closeness of the cooperation network, key entities, and the clustering phenomenon of cooperation. These structural characteristics are of great significance for understanding knowledge flow and innovation diffusion (Melamed et al., 2018), In terms of the dynamic evolution mechanism, researchers have paid attention to the changes in the IUR cooperation network over time. Through time-series analysis, some studies have found that the scale and density of the cooperation network are increasing, but the stability of cooperation varies. Some cooperative relationships gradually strengthen over time, while others may weaken due to changes in the external environment or conflicts of interest within the cooperation (Meng et al., 2021). In addition, it has been found that the evolution of the IUR cooperation network is influenced by a variety of factors, including policy environment, market demand, and technological progress. Policy support and guidance can accelerate the formation and development of the cooperation network, changes in market demand prompt the entities involved in cooperation to continuously adjust the direction and content of cooperation, and technological progress provides new opportunities and challenges for cooperation (Chen et al., 2022). In terms of influencing factors, researchers have explored the factors affecting the evolution of IUR cooperation from multiple perspectives. From the policy level, the government’s science and technology policies, industrial policies, and tax policies have played an important role in promoting the formation and development of IUR cooperation (Cheng et al., 2020). From the market level, changes in market demand are an important driving force for the evolution of IUR cooperation. As the market’s demand for new technologies and products continues to increase, enterprises need to cooperate with universities and research institutions to jointly carry out technological research and development and innovation in order to maintain a competitive advantage (Yarkent et al., 2023). Studies have shown that the expectations and evaluations of innovation performance by the cooperating parties directly affect the continuity and stability of cooperation. When cooperation can bring significant innovation results and economic benefits, the willingness and input of the parties to cooperate will be further strengthened. On the contrary, if cooperation fails to achieve the expected innovation performance, it may lead to the weakening or even termination of cooperation (Liu et al., 2021).
However, there are still some gaps in previous research. First, on the one hand, most existing studies mainly focus on the structural characteristics and evolutionary patterns of IUR cooperation networks, with relatively insufficient research on the structural characteristics and evolutionary patterns of key technology networks within the cooperation. Moreover, the majority of these studies take a single network as the research object and pay insufficient attention to the “Technology-Applicant” bipartite network, failing to fully consider the complex interactive relationships between technology and actors. The “Technology-Applicant” bipartite network is a network structure that contains two types of nodes: Technology Nodes and Applicant Nodes. Technology Nodes represent the technological fields involved in the collaboration, while Applicant Nodes represent the organizations that apply for patents. On the other hand, current research on the factors influencing IUR cooperation mainly focuses on the endogenous mechanisms of cooperation evolution or innovation performance research, with relatively insufficient research on the endogenous mechanisms of key technology networks within the cooperation, as well as the dissemination, integration of technology within the network, and the role of technology in the structure and function of the cooperation network.
Based on this, this study focuses on the IUR collaborative networks of Chinese “Double First-Class” universities. “Double First-Class” universities are institutions of higher education in China that have been identified for the development of world-class universities and first-class disciplines. These universities demonstrate significant strengths and distinctive features in talent cultivation, scientific research, and discipline construction, representing the high standards and quality of Chinese higher education. This study plans to employ complex network analysis methods to construct a “Technology-Applicant” bipartite network and identify key technologies in IUR collaborative networks. Specifically, the IUR collaborative patents over the past decade are divided into stages, with each two-year period as an independent stage. The Louvain algorithm for complex networks is utilized to partition the IUR collaborative network into applicants, and information entropy features are extracted to identify key collaborative technologies. This study also analyzes the evolution of key technologies in IUR collaboration over the past decade.
The contributions of this study are as follows: First, by integrating complex network analysis, the Louvain algorithm, and information entropy feature extraction, this study has developed a systematic model for identifying key technologies. This model can effectively identify the technological nodes that play a crucial role in IUR cooperation networks, providing a scientific basis for decision-making for universities, enterprises, and research institutions during cooperation. It helps all parties accurately pinpoint the direction of cooperation and key technological fields. Second, through multi-stage analysis of data from the past decade, this study not only identifies the key technologies in each stage but also further explores the evolutionary trends of these technologies over time. This dynamic perspective can clearly demonstrate the rise and fall of key technologies, as well as the transformation and integration between different technological fields. Finally, this study focuses on the structural characteristics and network attributes of key technologies in IUR collaboration and explores the evolution mechanisms and dynamic patterns of key technologies in the innovation network during the collaborative evolution process.
The remainder of this paper is organized as follow. Section 2 reviews the related literature on the structure of IUR cooperation, the identification of key technologies. Section 3 presents a detailed explanation of the research methodology used in this study and the proposed analytical framework. In Section 4, based on collaborative patent data and using a two-year period as a stage division, this study constructed the IUR community collaboration partitions and built a “technology-applicant” bipartite collaborative network. This study also identified the key technologies of applicant collaboration in different stages through information entropy. Additionally, this study presents the evolutionary characteristics of key technologies in IUR collaboration over the past decade. Section 5 explores the underlying mechanisms and dynamic patterns of key technologies in the IUR network. Section 6 discusses the primary findings as well as the theoretical and practical implications of this study. Section 7 provides a summary of the study’s primary work, limitations, and opportunities for future work.
2 Literature review
2.1 Evolutionary identification of key technology in Industry-University-Research collaboration
With the intensification of global technological competition and the continuous upgrading of industrial structures, the role of IUR cooperation in promoting technological innovation and industrial upgrading has become increasingly important. In recent years, the evolution of key technologies in IUR cooperation has become a focus of attention in both academic and industrial circles. The evolution of key technologies not only affects the efficiency and effectiveness of cooperation, but also determines the competitiveness and development direction of industries (Wang et al., 2025). However, existing research on the evolution trends and influencing factors of key technologies in IUR cooperation is still not deep enough, especially in terms of the dynamism and complexity of technologies.
In the research on technological evolution, scholars have gradually realized that the development of technology is not a linear process but is influenced by a combination of various factors. The speed and magnitude of technological iteration show significant differences across different industries and fields. For example, in high-tech fields such as artificial intelligence and new energy vehicles, the speed of technological iteration is extremely fast. Companies must work closely with universities and research institutions to layout the research and development of next-generation technologies in advance (Chui et al., 2023). This rapid technological iteration demands that IUR cooperation models become more flexible and efficient to adapt to the swift changes in technology (Cohen et al., 2025). However, existing research lacks a systematic analysis of this rapid technological iteration model, especially in terms of cooperation mechanisms and innovation models.
However, existing research on the mechanisms and influencing factors of interdisciplinary integration in IUR cooperation is still not deep enough. For example, how to effectively integrate the resources and advantages of different disciplines in IUR cooperation, and how to promote the cooperation and innovation of interdisciplinary teams, these questions all need further research.
At the same time, research on technological evolution has also revealed the trend of interdisciplinary integration. In many key technology fields, such as radiative cooling materials and intelligent transportation systems (Xu et al., 2025), the development of technology relies on the knowledge and methods of multiple disciplines. This kind of interdisciplinary cooperation not only accelerates technological innovation but also promotes the wide application of technology (Chandra, 2013). However, existing research on the mechanisms and influencing factors of interdisciplinary integration in IUR cooperation is still not deep enough. For example, how to effectively integrate the resources and advantages of different disciplines in IUR cooperation, and how to promote the cooperation and innovation of interdisciplinary teams, these questions all need further research.
In addition, research on technological evolution has also emphasized the strengthening of the status of cooperation entities. In IUR cooperation, the leading role of enterprises is increasingly prominent. Enterprises are not only the demanders and users of technological innovation but also the key entities for technology transfer and market promotion (Zhao et al., 2024). For example, in China’s marine industry, the enterprise-enterprise (I-I) cooperation model has the highest number of patents, accounting for 41.59%, followed by the enterprise-research institute (I-R) and university-enterprise (U-I) cooperation models. This trend indicates that the leading role of enterprises in technological innovation is continuously strengthening, and IUR cooperation is gradually forming a cooperation network centered on enterprises (Guo et al., 2023). However, existing research lacks in-depth exploration of the mechanisms between the status of cooperation entities and technological evolution. The main shortcoming is the failure to fully reveal the dynamic process and interaction mechanisms of the co-evolution of cooperation entities and technology. Specifically, existing research pays little attention to how changes in the status of cooperation entities affect the direction and speed of technological evolution, and how technological evolution, in turn, shapes the status and behavior of cooperation entities. Moreover, regarding the mechanisms of key factors in this co-evolution process, such as knowledge distribution and policy environment, existing research also lacks systematic analysis and empirical support.
Policy support plays an important role in IUR cooperation. By formulating industrial policies, providing financial support, and building cooperation platforms, the government has promoted the in-depth development of IUR cooperation (Behfar et al., 2024). For example, the government provides policy guarantees and financial support to encourage enterprises to jointly carry out innovation projects with universities (Kabombo et al., 2025). By formulating industrial policies, the government guides resources towards key technology research and development (R&D) areas, ensuring that the direction of technology R&D is consistent with national and local economic development strategies (Li et al., 2022). In addition, the government also builds cooperation platforms and organizes IUR docking activities to promote information exchange and cooperation among all parties. These measures jointly promote the deepening of IUR cooperation, accelerating technological innovation and the transformation of results (Zhou & Wang, 2023). However, when analyzing the evolution of IUR cooperation, existing research often fails to fully combine the specific policies of the year and lacks a systematic analytical framework. Especially in evaluating the precision and effectiveness of key technologies, there is little in-depth discussion in existing research that combines policy tools with the actual evolution process of IUR cooperation to verify whether the technological achievements formed by the existing cooperation evolution truly meet the key technology needs of the year.
To sum up, existing research has not clearly elaborated the recent technological evolution trends of IUR cooperation in a country or region, which makes long-term planning and strategic adjustment of IUR cooperation lack strong basis. The unclear technological evolution trends lead to certain blindness in resource allocation, choice of cooperation models, and policy formulation. At the same time, the unclear technological evolution trends also cause differences in the expectations and strategic planning of technological development among the parties in IUR cooperation. Universities and research institutions may focus more on basic research and technological breakthroughs, while enterprises have more urgent needs in application development and market promotion. Such differences may lead to inconsistent goals and resource misallocation in the cooperation process, affecting the efficiency and effectiveness of cooperation. Moreover, the unclear technological evolution trends also make it difficult for the government to precisely guide and support IUR cooperation when formulating relevant policies, thus greatly reducing the effectiveness of policy support.
2.2 Research on the endogenous driving mechanism of Industry-University-Research networks
In recent years, the endogenous driving forces of IUR cooperation networks have gradually become a focus of attention in both academic and practical circles. Endogenous driving forces refer to the structural and mechanistic factors within the network that drive the formation, evolution, and stability of the cooperation network (Ankrah & Al-Tabbaa, 2015). These factors not only affect the formation and evolution of IUR cooperation networks but also have a significant impact on cooperation efficiency and innovation outcomes. Existing research mainly involves three aspects of the network: First is the proximity mechanism factors. The proximity mechanism is an important part of the endogenous driving forces of IUR cooperation networks, which mainly includes geographical proximity, technological proximity, and institutional proximity. Geographical proximity emphasizes the impact of the physical distance between cooperating entities on cooperation. Research shows that the closer the geographical distance, the higher the likelihood of cooperation (Errico et al., 2024). Technological proximity focuses on the similarity and complementarity of cooperating entities in the technological field. The higher the degree of technological proximity, the easier it is for cooperating entities to transfer knowledge and engage in collaborative innovation (Zhang & Liu, 2024). Institutional proximity emphasizes the similarity of cooperating entities in terms of laws, regulations, and management standards. This similarity provides a stable institutional environment for cooperation, reducing uncertainty and conflicts in the cooperation process (Hong & Su, 2013). Second, there is research on the endogeneity of network mechanisms. The endogeneity of network mechanisms mainly involves the impact of network structure on the formation and evolution of IUR cooperation networks. Research shows that IUR cooperation networks tend to form star-shaped structures and closed triangular structures. The star-shaped structure reflects the Matthew effect, that is, the central nodes in the network (such as well-known universities or large enterprises) are more likely to attract new cooperation opportunities (Wu & Liu, 2024). The closed triangular structure reflects the transitivity effect, that is, the open triangular structures in the network tend to close, forming closer cooperative relationships (Estrada & Arrigo, 2015). In addition, the connectivity of the network also plays an important role in the evolution of IUR cooperation networks. The higher the connectivity, the more stable the cooperation network (Zhang et al., 2017). Finally, there is research on the dynamics and heterogeneity of driving mechanisms. The driving mechanisms of IUR cooperation networks are not static but are influenced by exogenous factors such as policies. For example, the implementation of the “Double First-Class” construction policy has changed the driving mechanisms of IUR cooperation networks from an open structure relying on binary connections to a strong community structure with ternary closure (Yuan et al., 2025). In addition, different types of cooperating entities show different driving mechanisms in the evolution of IUR cooperation networks. For example, there are significant differences in the driving mechanisms of comprehensive universities and specialized universities in IUR cooperation networks. Comprehensive universities are more likely to break through the limitations of geographical proximity and form cross-regional and cross-disciplinary cooperation networks (Garcia et al., 2018).
In addition, with the continuous development of disciplines, the key role of knowledge characteristics in IUR cooperation has become increasingly prominent. In terms of the structural characteristics of knowledge networks, research has found that many networks exhibit scale-free network characteristics (Wang et al., 2023), where a minority of nodes have a large number of partners. These nodes play an important role in the rapid dissemination and diffusion of technology and knowledge, while the majority of nodes only collaborate with a few partners (Fioravanti et al., 2023). At the same time, some networks also have small-world network characteristics, with close local cooperative groups that help accelerate the flow and transformation of knowledge (Fritsch & Kudic, 2022; Wang et al., 2024). In addition, community structure characteristics are also quite common. There are communities of different sizes in the network, with nodes within the community being more closely connected and having a stronger willingness to cooperate. However, there are also a large number of nodes that have not established effective connections with super nodes (Li & Zheng 2024; De Paulo & Porto 2023). The evolution of knowledge networks is another focus of research. By analyzing network data over different periods of time, it has been found that indicators such as network scale and connection density change over time, and the distribution of key innovative entities and technological fields also shows stage characteristics (Chang, 2022; Pu et al., 2022). For example, the cooperation networks in some fields have gradually expanded from local areas to the national and even global level (Yang et al., 2021), the importance of key nodes and edges in the network has become more and more significant, and the cooperation model has also gradually shifted from being centered on a single entity to a pattern of multi-entity collaborative cooperation (Cheng et al., 2020).
However, existing research is relatively lacking in terms of the factors influencing knowledge networks in IUR cooperation, especially regarding the depth and width of knowledge. The depth and width of knowledge play a crucial role in IUR cooperation. They not only affect the construction and operation of IUR cooperation networks but also determine the innovation capability and adaptability of IUR cooperation. From the perspective of knowledge depth, the diversity of knowledge sources and types in knowledge networks is a key factor affecting the effectiveness of IUR cooperation (Wang, 2020). A network with a wide range of knowledge sources can integrate knowledge resources from different disciplines, industries, and regions, thereby providing a more comprehensive perspective and richer solutions for cooperative projects (Chen & Yan, 2023). For example, interdisciplinary cooperation projects often require the integration of knowledge from multiple disciplines such as physics, chemistry, and biology, while cross-industry cooperation may involve multiple fields such as manufacturing, services, and information technology. This diversity of knowledge can promote the collision and integration of innovative thinking, thereby increasing the success rate of cooperative projects (Von Wehrden et al., 2019). From the perspective of knowledge width, the scope of knowledge integration and application in knowledge networks is also an important factor affecting the effectiveness of IUR cooperation. A network with a wide range of knowledge application can successfully transfer knowledge from one field to another, achieving cross-field application and innovation of knowledge (Serrano et al., 2024). For example, artificial intelligence technology is not only widely used in the field of information technology but also shows great application potential in multiple fields such as medical care, finance, and manufacturing. This cross-field integration and application of knowledge can expand the innovation boundaries of knowledge networks, enhance the innovation capability of cooperative projects, and improve market competitiveness (Pathan, 2025).
In current research on IUR cooperation, despite numerous achievements, most studies have focused solely on individual network characteristics, such as the structure and evolution of IUR cooperation networks or knowledge networks, often neglecting the interactions between these two types of networks. This one-sided research perspective not only restricts a comprehensive understanding of the role of knowledge networks in IUR cooperation but also affects the innovation efficiency and effectiveness of IUR cooperation to a certain extent. Therefore, there is an urgent need to conduct systematic research to deeply analyze the interactive impacts between IUR cooperation networks and knowledge networks, in order to provide more scientific theoretical support for the innovative development of IUR cooperation.
3 Methodology
Figure 1 illustrates analytical framework for IUR Key Technology Identification and Evolutionary. The research data is sourced from the incoPat database of BEIJING INCOPAT TECHNOLOGY CO. Patents applied for through IUR cooperation by Chinese Double First-Class Project universities from 2015 to 2024 were screened, and a total of 139,903 patent data entries were ultimately included in the analysis. To better elucidate the evolution of technological characteristics in IUR cooperation, this study analyzed the data in two-year time intervals. The framework is designed to be executed in four steps: Collection of IUR cooperation patents, Applicant division of IUR cooperation, Identification of Key Technologies in the “Technology- Applicant” Network, and Endogenous Motivation Mechanism of Key Technology Characteristics.
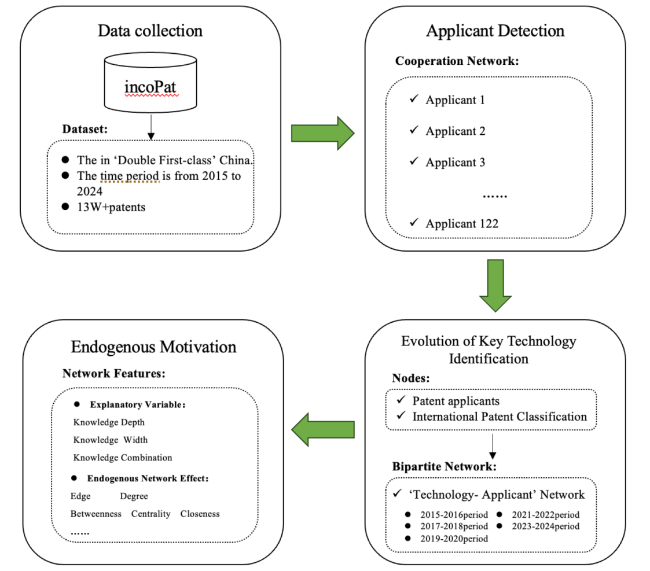
Figure 1. The analytical framework for IUR Key Technology Identification and Evolutionary. |
3.1 Cooperation network applicant detection
The Louvain algorithm is a community detection method based on modularity optimization, used to identify applicant structures within a network. Its core idea is to optimize the network’s modularity to recognize groups of nodes with dense internal connections and sparse external connections (Sahu et al., 2024). The algorithm is characterized by its efficiency and scalability, making it suitable for large-scale networks.
In this study, we utilized the Louvain algorithm to divide the collaborative innovation network of the Double First-Class universities, industries, and research institutions into multiple IUR cooperation applicants. Specifically, the algorithm assesses the strength of connections between nodes by calculating the modularity of each node within the IUR collaborative innovation network. Modularity quantifies the connection patterns among nodes in the network, reflecting the density of internal connections within applicants and the sparsity of external connections across applicants. The number of collaborative patents between IUR entities directly affects their modularity values within the network. The greater the number of collaborative patents, the higher the modularity value between the IUR entities, indicating a stronger connection between them and a higher likelihood of them being assigned to the same applicant.
By doing so, this study was able to clearly reveal the pathways of collaborative knowledge flow between different applicants. This approach provides an important perspective for understanding the underlying mechanisms of IUR collaborative innovation and offers a scientific basis for optimizing the cooperative network and enhancing innovation efficiency.
3.2 Key technology identification model
3.2.1 Bipartite network features
A bipartite network is a special type of network composed of two distinct types of nodes, with connections existing only between nodes of different types (Lv et al., 2023). This study extracts the IPC subclass codes of the community cooperation patents as technologies and takes the divided IUR cooperation communities as the “Cooperation Applicants”. It ultimately links the two to form a “Technology-Applicant” bipartite network. The International Patent Classification (IPC) is an internationally recognized system for classifying patent documents and objectively reflects the technical components of the cooperation patents. The data are then imported into a social network analysis tool (Gephi) for visualization and analysis of the distribution and cooperation relationships within the bipartite network.
3.2.2 Information entropy
Complex network entropy is a quantitative measure of the complexity and uncertainty of network structures. By introducing the concept of entropy into the analysis of complex networks, it is used to describe the randomness and diversity of node connections within the network. The higher the entropy, the more complex the network structure and the more disordered the node connections are (Zhang & Li, 2022). This study calculates the information entropy of technology nodes in a bipartite network and employs the Pareto principle to identify the top 20% of technology nodes as key technologies and further conducts robustness tests to validate the results. Subsequently, these key technology nodes are mapped back to the cooperating entities within the bipartite network, thereby constructing a “Technology-Applicant” network for IUR cooperation. This process not only accurately identifies key technologies but also reveals the core associations between these technologies and the cooperating entities, providing strong support for a deeper understanding of the underlying mechanisms of IUR cooperation.
The calculation of complex Network Information Node entropy is typically based on the degree distribution of nodes, as defined in Eq:
$\begin{array}{c} p_{i}=\frac{k_{i}}{2 E} \\ H_{i}=-\sum_{i=1}^{N} p_{i} \log _{2}\left(p_{i j}\right) \end{array}$
where ki is the degree of a Network node, E is the total number of edges in the network, and pij is the probability of a connection between node i and node j. If there is no connection between node i and node j, then pij=0.
This study calculates and ranks the information entropy of technical nodes and combines the encouraged industry categories in the “Catalogue for Guiding Industry Restructuring (2024 Version)” to identify key technologies for industry-university-research collaboration. This catalogue clearly defines the encouraged industry categories, specifying the strategic focus of national economic development, which helps to concentrate resources and efforts on breakthroughs in key areas, promoting the optimization and upgrading of the industrial structure.
3.3 Network endogenous motivation model
This study calculates and ranks the information entropy of technical nodes, and combines the encouraged industry categories in the “Catalogue for Guiding Industry Restructuring (2024 Version)” to identify key technologies for industry-university-research collaboration. This catalogue clearly defines the encouraged industry categories, specifying the strategic focus of national economic development, which helps to concentrate resources and efforts on breakthroughs in key areas, promoting the optimization and upgrading of the industrial structure.
In the ERGM model formula, Y represents the network, y is a specific realization of the network, g(y) is a set of graph statistics, θ is the corresponding vector of parameters, and c(θ) is the normalizing constant, which ensures that the sum of the probabilities is 1, as defined in Eq:
$P(Y=y)=\frac{\exp \left(\theta^{\prime} g(y)\right)}{c(\theta)}$
In the analysis of collaboration networks, the ERGM holds significant importance. Collaboration networks typically involve cooperative relationships among multiple entities such as enterprises, research institutions, and individuals. These relationships are often influenced by a variety of factors, including the similarity and complementarity between entities, as well as their past collaborative experiences. The ERGM is capable of effectively capturing these complex relational patterns. Moreover, by estimating the model parameters, the ERGM can quantify the impact of different factors on the structure of the collaboration network, thereby providing a theoretical basis for optimizing the collaboration network.
4 Evolution of key technologies identification
4.1 Cooperation applicants detection
Figure 2 illustrate that patent applications in IUR Cooperation Applicants. By using the Louvain algorithm, the IUR cooperation network was divided into applicants, resulting in a total of 122 applicants. Among them, two applicants have more than or equal to 1,000 patent applications, seven applicants have patent applications ranging from more than or equal to 5,000 to less than 10,000, 24 applicants have patent applications ranging from more than or equal to 1,000 to less than 5,000, four applicants have patent applications ranging from more than or equal to 100 to less than 1,000, and 85 applicants have patent applications ranging from more than or equal to 1 to less than 100.
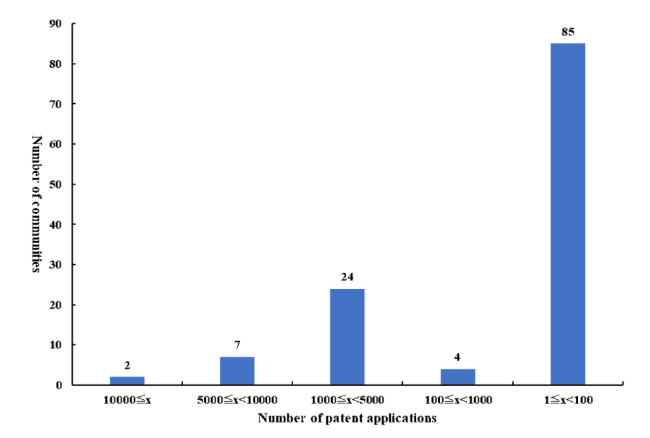
Figure 2. Distribution of Patent Applications in I-U-R Cooperation Applicants. |
4.2 Information entropy
The Table 1 shows the top ten technological nodes and their corresponding entropy values in the IUR cooperation technology network from 2015 to 2024, ranked by information entropy. Information entropy is an indicator that measures the uncertainty and complexity of a system. The higher the entropy value, the greater the uncertainty of the technology in the IUR cooperation network. This may indicate that the cooperation patterns are more diverse and complex. It may also suggest that the development of the technology field is more active, involving more cooperation entities and innovative activities.
Table 1. Key Technology Information Entropy Weights. |
| The Period of 2015-2016 | The Period of 2017-2018 | The Period of 2019-2020 | |||
|---|---|---|---|---|---|
| Node | Entropy | Node | Entropy | Node | Entropy |
| G06F | 7.5617 | G01N | 8.0909 | G06F | 8.5610 |
| G01N | 7.5268 | G06F | 7.9372 | G01N | 8.1527 |
| G06Q | 6.9745 | G06Q | 7.5348 | G06Q | 7.7500 |
| H02J | 6.6634 | H02J | 6.9692 | G06T | 7.4453 |
| G01R | 6.6497 | G01R | 6.8984 | G06K | 7.1600 |
| H04L | 6.3043 | G06T | 6.8715 | G01R | 7.0795 |
| C12N | 6.2971 | G06K | 6.8715 | G06V | 6.9556 |
| G05B | 6.0722 | H04L | 6.6329 | H02J | 6.9385 |
| B01J | 6.0540 | G05B | 6.4766 | H04L | 6.8685 |
| G06K | 6.0449 | C12N | 6.4582 | A61K | 6.5681 |
| The Period of 2021-2022 | The Period of 2023-2024 | ||||
| Node | Entropy | Node | Entropy | ||
| G06F | 9.4506 | G06F | 10.5335 | ||
| G01N | 9.0077 | G01N | 9.8302 | ||
| G06Q | 8.4512 | G06Q | 9.4255 | ||
| G06T | 8.4129 | G06V | 9.3989 | ||
| G06V | 8.1743 | G06T | 9.1705 | ||
| G01R | 7.4942 | H02J | 8.5559 | ||
| G06K | 7.4035 | G01R | 8.3108 | ||
| H02J | 7.3699 | H04L | 8.2822 | ||
| H04L | 7.3504 | B01J | 8.1335 | ||
| C04B | 7.2029 | C04B | 8.1181 | ||
From 2015 to 2024, the ranking and entropy values of the technological nodes have changed. In 2015-2016, G06F (computers, computer systems based on specific computing models) and G01N (measuring, testing) had entropy values of 7.5617 and 7.5268, respectively, ranking first and second. This shows their importance and complexity in IUR cooperation. G06Q (specific configurations for particular computing models) ranked third with an entropy value of 6.9745. These technologies held core positions in the IUR cooperation network at that time, with high diversity and complexity in cooperation. Over time, the entropy values of these technologies continued to rise. For example, the entropy value of G06F reached 9.4506 in 2021-2022 and further increased to 10.5335 in 2023-2024. This indicates a continuous increase in the complexity and uncertainty of G06F in IUR cooperation, with the cooperation network likely involving more entities and broader cooperation patterns. G01N also showed a similar trend, with its entropy value rising from 7.5268 in 2015-2016 to 9.8302 in 2023-2024. This reflects the increasing activity and complexity of this technology field in IUR cooperation.
Other technological nodes, such as G06T (computers specially adapted for specific computational models), G06V (computers specially adapted for specific computational models), G01R (measuring, testing), H02J (circuit arrangements or layouts), and H04L (electric communication technology), also showed relatively high entropy values and fluctuating rankings during different periods. For example, G06T had an entropy value of 6.8715 in 2015-2016, ranking sixth. By 2023-2024, its entropy value had increased to 9.1705, and it ranked fifth. This indicates that the importance of this technology in IUR cooperation has gradually increased, and the complexity of cooperation has also risen. G06V gradually entered the top rankings after 2019-2020, with its entropy value reaching 9.3989 in 2023-2024, ranking fourth. This shows that its position in IUR cooperation has become increasingly important and that cooperation patterns have become more diverse.
Table 2 presents the changes in the number of key technology nodes, applicants, and patents over different periods from 2015 to 2024. From 2015-2016 to 2023-2024, the number of key technology nodes first increased slowly and then gradually stabilized at around 100. The number of applicants involved in the development of key technologies showed a fluctuating upward trend, increasing from 44 to 58. The number of patents applied for also exhibited a clear and continuous growth trend, rising from 9,308 to 46,718, with a more significant increase after 2019-2020, reflecting that the pace of innovation output in this field is accelerating.
Table 2. Applicant Nodes Feature Statistics. |
| Times | Key Technology nodes | Applicants | Patents |
|---|---|---|---|
| 2015-2016 | 87 | 44 | 9,308 |
| 2017-2018 | 94 | 54 | 13,630 |
| 2019-2020 | 94 | 50 | 16,033 |
| 2021-2022 | 100 | 55 | 30,394 |
| 2023-2024 | 100 | 58 | 46,718 |
4.3 The evolution of key technology characteristics
In the evolution of IUR cooperation from 2015 to 2024, the R&D of each applicant mainly focused on key technology areas such as smart grids, data processing, energy management, and image processing. Among them, Applicant 40 and Applicant 26 played the main role in R&D, driving technological innovation and industrial upgrading in the relevant fields.
(1) Key technologies in the 2015-2016 period
Figure 3 shows 2015-2016 IUR cooperation stage. The IUR cooperation in this stage focused on areas such as smart grids, the energy internet, energy-information fusion systems, and energy management for wastewater treatment. Through interdisciplinary collaboration, applicants utilized advanced data processing, power supply, communication protocols, and water treatment technologies to promote improvements in energy efficiency, system stability, and environmental sustainability. A total of 87 key technical nodes were identified in this Period, covering 44 applicants.

Figure 3. The Period of 2015-2016. |
The IUR cooperation in the 2015-2016 period was closely related to and mutually promoted by the industrial development policies of the time. During this period, IUR cooperation focused on cutting-edge fields such as smart grids, energy internet, energy information fusion systems, and energy management in wastewater treatment, which were highly consistent with the development directions of the top ten key areas of the new generation of information technology industry, aerospace equipment, and others in the key areas technology roadmap of the “Made in China 2025” released in 2015. It also echoed the eight major fields of the new generation of information technology, new energy vehicles, energy conservation, and environmental protection in the “The 13th Five-Year Plan for the Development of Strategic Emerging Industries”.
During this period, IUR cooperation, through cross-disciplinary cooperation, utilized advanced data processing, power supply, communication protocols, and wastewater treatment technologies to promote the improvement of energy efficiency, system stability, and environmental sustainability. The key technology nodes identified and the number of applicants covered reflected the width and depth of the cooperation. The cooperation applicants 40, 26, and 10 carried out projects in the fields of smart grids (G01R, H02J, G06F, G06Q), energy information fusion systems (H04L, H02J, H04L), and energy management in wastewater treatment (C02F), which not only conformed to the guidance of national industrial development policies but also provided specific practical paths and technical support for achieving policy goals.
While promoting technological innovation and industrial development, these cooperation projects also received strong support from national policies, including financial investment and policy guidance, which accelerated the transformation and application of technologies. This close combination of policy and practice not only promoted the rapid development of related industries but also provided a solid foundation for the cultivation and development of national strategic emerging industries, and promoted the improvement of the entire society’s innovation capability and industrial competitiveness.
(2) Key technologies in the 2017-2018 period
Figure 4 shows 2017-2018 IUR cooperation stage. As can be seen from the figure, the structure of the IUR cooperation network in this stage is more complex, the technological fields are more extensive, and the cooperation is more closely knit. The connections between applicants are more frequent, and the sharing of resources and complementarity of strengths are more evident. A total of 94 key technical nodes were identified in this Period, covering 54 applicants.
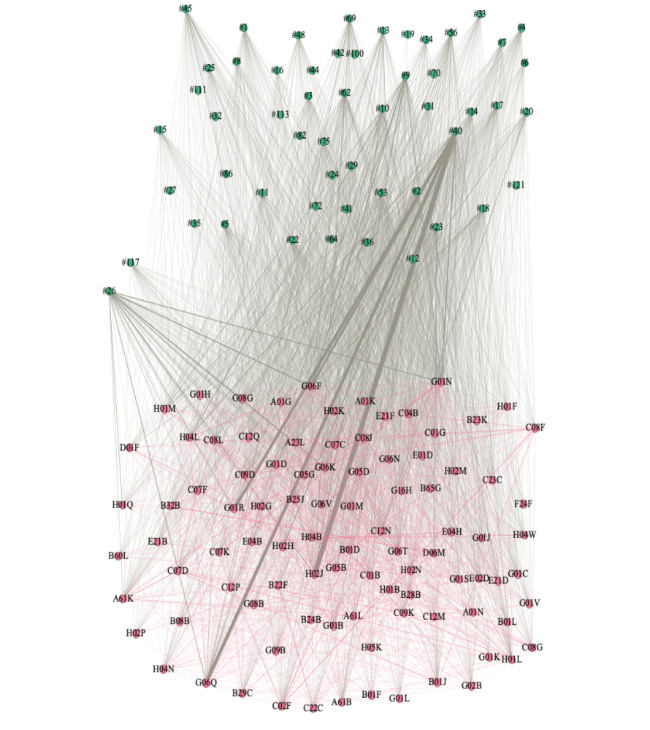
Figure 4. The Period of 2017-2018. |
During the period of 2017-2018, the characteristics of IUR cooperation were closely related to the industrial policy orientation at that time. In terms of technological fields, the technological focus of cooperation applicant 40 was concentrated on G01R, G06Q, H02J, and the newly added H02H. These technological fields were closely related to the key areas mentioned in the “Three-Year Action Plan on Enhancing Core Competitiveness in the Manufacturing Sector (2018-2020)”, such as high-end equipment manufacturing, intelligent manufacturing of the manufacturing industry, and new energy. The key role of G06Q technology in the integration of information technology and business processes coincided with the requirements for promoting the deep integration of the Internet, big data, artificial intelligence, and the real economy in intelligent manufacturing. The application of H02J and H02H technologies in the optimization of power systems and power supply echoed the development needs of the new energy automotive industry and the new energy industry, providing energy security and technological innovation support for these industries.
Cooperation applicant 26 focused on G01R, G06K, G06F, and G01N. G06K and G06F technologies played important roles in data processing and computing, respectively. This was closely related to the development of the new generation of information technology industry as classified in the “Classification of Strategic Emerging Industries (2018)”. The new generation of information technology industry emphasizes the innovation and application of information technology. G06K and G06F technologies are the basic support for the development of this industry and can promote the improvement of data processing, information transmission, and computing capabilities, providing technological support for the digital and intelligent development of the new generation of information technology industry.
Cooperation applicant 20 mainly focused on the technological fields of G06F and C21N. G06F technology provided strong computing and data processing capabilities for the entire technological system and was a common technological support for the development of multiple industries. C21N technology, which focused on chemical processes, was closely related to the development of the new materials industry. The “Strategic Emerging Industries Classification (2018)” listed the new materials industry as one of the nine major fields. The technological support of C21N in the development and application of new materials helped to promote the innovative development of the new materials industry and met the demand for high-performance materials in high-end equipment manufacturing and new energy industries.
(3) Key technologies in the 2019-2020 period
Figure 5 shows 2019-2020 IUR cooperation stage. During this cooperation stage, the network structure and cooperation patterns of technology cooperation applicants exhibited more closely-knit and complex characteristics. The IUR cooperation in this stage showed new features and trends in terms of technological distribution and cooperation patterns. Applicants had closer cooperation in specific technological fields, especially in data processing (G06F) and business methods (G06Q). This cross-applicant cooperation facilitated the sharing of technological knowledge and the collision of innovative ideas. As cooperation deepened, the technological cooperation network became more complex, which might imply more frequent interactions among applicant members and more diversified cooperation projects. A total of 94 key technical nodes were identified in this Period, covering 50 applicants.

Figure 5. The Period of 2019-2020. |
Between 2019 and 2020, the technological research and development (R&D) phase of IUR cooperation was well-matched with industrial policies, showing a positive trend of coordinated development. In 2019, “Notice on Accelerating the Construction of Strategic Emerging Industry Clusters”, focuses on the construction of strategic emerging industry clusters and initially laying out 66 national-level clusters. IUR cooperation applicants actively responded. For example, cooperation applicant 40 carried out close cooperation in technical fields such as power supply/distribution devices (H02J) and data processing (G06F), which were highly consistent with the development needs of smart grid and other industrial clusters. This consistency between the direction of technological R&D and policy orientation enabled cooperation applicants to accurately connect with the national industrial layout, provide key technical support for key industries such as smart grids, promote industrial upgrading, and accelerate the formation and development of industrial clusters.
Entering 2020, the focus shifted to the integrated circuit, software, and new energy vehicle industries. The “Notice on Several Policies for Promoting the High-Quality Development of the Integrated Circuit and Software Industries in the New Era,” released in August, although not directly mentioning cooperation applicants, was closely related to data processing (G06F) technology as a key support. Cooperation applicant 26’s in-depth research in this field and cutting-edge technologies such as big data analysis and artificial intelligence provided strong technical momentum for the integrated circuit and software industries, helping them break through technological bottlenecks and enhance industrial competitiveness, which was highly consistent with the policy goal of promoting high-quality industrial development. In October, “Development Plan for the New Energy Vehicle Industry (2021-2035)”, which listed solid-state batteries as a priority. The technical accumulation of cooperation applicant 40 in the fields of power supply/distribution devices and data processing could provide strong support for optimizing the energy management system of new energy vehicles, developing intelligent charging technology, and industrializing solid-state batteries. This would promote the development of the new energy vehicle industry towards intelligence and efficiency, accurately aligning with policy orientation.
(4) Key technologies in the 2021-2022 period
Figure 6 shows 2021-2022 IUR cooperation stage. In this stage, technology cooperation applicants demonstrated more specialized and segmented characteristics. Each Cooperation applicants, based on its research focus and technological strengths, formed a unique technological distribution and cooperation pattern, especially in data processing (G06F) and image data processing (G06T). A total of 100 key technical nodes were identified in this Period, covering 55 applicants.
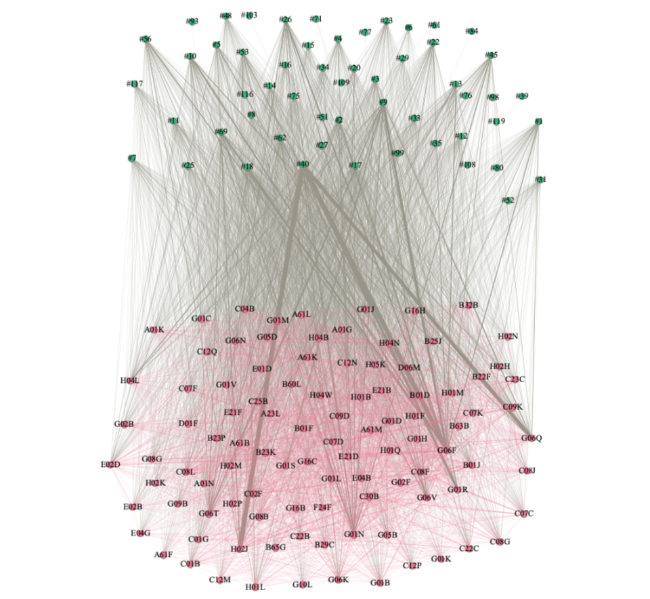
Figure 6. The Period of 2021-2022. |
Between 2021 and 2022, the technological R&D phase of IUR cooperation was closely matched with industrial policies, showing a high degree of synergy and complementarity. In 2021, the “Outline of the 14th Five-Year Plan (2021-2025) for National Economic and Social Development and Vision 2035 of the People’s Republic of China” clearly deployed a series of future industry incubation and acceleration plans in the fields of frontier science and technology and industrial transformation. The R&D direction of IUR cooperation applicants was highly consistent with these plans. For example, cooperation applicant 26 focused on data processing (G06F) and image data processing (G06T), which are key supports for frontier science and technology fields such as brain-like intelligence, quantum information, and future networks. Data processing technology plays an important role in the neural network simulation of brain-like intelligence and the data processing of quantum information, while image data processing technology provides technical support for intelligent monitoring and image recognition in future networks. In addition, the research of cooperation applicant 1 in the fields of catalysts, chemical or biochemical methods, etc., is closely related to the development of frontier science and technology fields such as gene technology, and provides basic support for future industries such as the bioeconomy.
Entering 2022, the “The 14th Five-Year Plan for the Development of Digital Economy” issued the development of new forms of business such as ultra-high-definition television, interactive video, immersive video, and cloud gaming, as well as the integration of technologies such as artificial intelligence, virtual reality, and 8K ultra-high-definition video. The in-depth research of cooperation applicant 26 in the fields of data processing and image data processing provided a strong technical basis for the application and development of these digital technologies. For example, image data processing technology is one of the core technologies of 8K ultra-high-definition video and immersive video, while data processing technology ensures the efficient operation of artificial intelligence and virtual reality. At the same time, the research of cooperation applicant 9 in the field of angle measurement and measuring devices (G01S) also provided support for the precise application of these technologies, such as spatial positioning and interaction in virtual reality and augmented reality.
(5) Key technologies in the 2023-2024 period
Figure 7 shows 2023-2024 IUR cooperation stage. In this period, technology cooperation applicants continued to deepen their expertise in specialized fields, characterized by cross-applicant and multi-technology integration, to adapt to the ever-changing technological development trends and market demands. A total of 100 key technical nodes were identified in this Period, covering 58 applicants. In the IUR cooperation phase from 2023 to 2024, compared with that from 2021 to 2022, the technological R&D has further deepened the characteristics of cross-applicant and multi-technology integration, and the compatibility with industrial policies has also become closer.
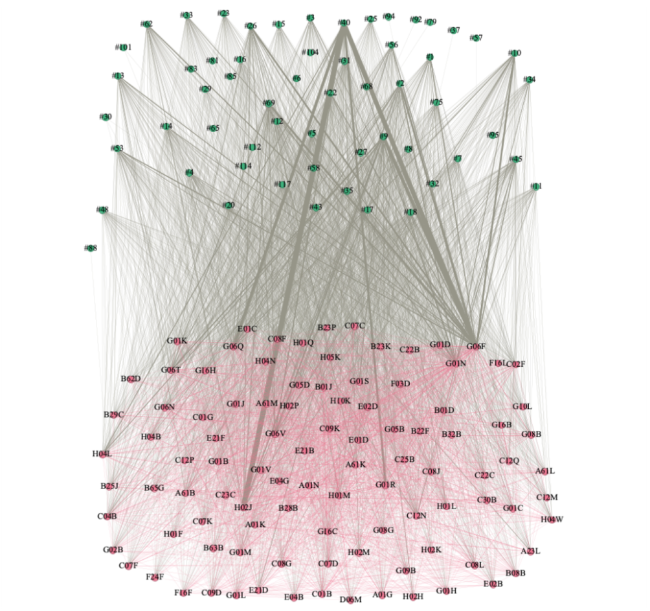
Figure 7. The Period of 2023-2024. |
During the period from 2021 to 2022, the IUR cooperation applicants had already shown a trend of specialization and segmentation in key technical fields such as data processing and image data processing, and the direction of technological R&D was in line with the key areas emphasized in the policies at that time, such as the digital economy and bioeconomy. For example, the research of cooperation applicant 26 in the fields of data processing and image data processing provided support for the application and development of digital technologies, which was consistent with the technological integration emphasized in the “The 14th Five-Year Plan for the Development of Digital Economy”.
Entering the period from 2023 to 2024, with the introduction of the concept of “new-quality productive forces” and the implementation of the industrial structure adjustment guidance catalogue, the technological R&D of IUR cooperation applicants has become more focused on the transformation and upgrading of strategic emerging industries and traditional industries. The research of cooperation applicant 40 in the fields of smart grids and energy management matches the strategic emerging industries emphasized in the new-quality productive forces, and its multi-technology integration model helps to promote the intelligent and green transformation of the energy industry. Cooperation applicants 9 and 10, in the combination of data processing and business methods, not only support the development of emerging industries but also provide impetus for the digital transformation of traditional industries, which is in line with the policy guidance for the transformation of manufacturing industry towards high-end, intelligent and green directions.
5 The endogenous motivation mechanism of key technology characteristics
In this section, we have selected eight key indicators to reveal the intrinsic dynamic changes in the key technology network of IUR cooperation. The independent variables include the knowledge base, knowledge depth, and knowledge combination ability of IUR cooperation applicants in key technology research and development, as well as the degree of knowledge mastery by individuals or organizations in specific fields, which specifically cover the detail, complexity, and systematic nature of knowledge. In addition, to better control the interference of other factors, we have chosen traditional characteristics in the “Technology-Applicant” network as control variables, which specifically include Degree, Betweenness Centrality, and Closeness Centrality.
5.1 Extracting and defining network features
Knowledge Depth is a core indicator for measuring the professional level of IUR applicants in key technology research and development. A higher level of knowledge depth implies stronger professional capabilities and deeper technological accumulation, which can provide a solid technical foundation for IUR cooperation, thereby promoting the breakthrough and development of key technologies. Under the current trend of multidisciplinary integration, the impact of the knowledge depth of a cooperative group on innovation performance is becoming increasingly significant. A broad and balanced knowledge depth helps to facilitate the collision and integration of knowledge from different disciplines, thus generating more cross-disciplinary innovative achievements (Zhang et al., 2021). Research has shown that the deeper the knowledge depth of the main body, the more thorough its members’ understanding of knowledge, and consequently, the higher the innovativeness of the external knowledge received during the cooperative R&D process (Singh et al., 2021). In addition, knowledge value, social capital, and the capabilities of team leaders significantly affect the knowledge-sharing performance of scientific research and innovation teams (Sankaran et al., 2021). Among researchers within and outside the organization, sharing and empathy regarding technical issues and values, as well as mutual trust, are the foundations of knowledge sharing. The development and expansion of such preferences and interactions can promote the deepening and innovation of technical knowledge. Meanwhile, the diversity of knowledge depth and the stability of cooperation among R&D personnel play a moderating role in the relationship between the roles of key inventors (such as gatekeeper roles and bridge roles) and the exploratory innovation changes of the main body (Zhang et al., 2019). The knowledge depth network, as a carrier of knowledge flow, is a prerequisite for the efficient utilization of knowledge. The smoothness of knowledge flow can moderate the impact of the knowledge depth network on innovation performance (Yu et al., 2018).
However, an excessive concentration of knowledge depth in a specific field may also bring negative effects. When knowledge is overly concentrated in one field, it may lead to other potentially innovative directions not receiving sufficient resource support, thereby limiting the overall improvement of innovation performance (Yang et al., 2024). Moreover, there is a threshold effect between knowledge depth and diversification in the impact of knowledge acquisition on collaborative innovation. When knowledge acquisition exceeds a certain limit, it may produce a negative effect. This is because the wider the range of integrated knowledge, the more complex the problems in the creation and management of the integration process, which may ultimately lead to integration costs exceeding the profits brought by new knowledge (Yang et al., 2024).
Knowledge Width is used to describe the coverage and diversity of knowledge that an organization or system has in different fields or topics. By measuring knowledge depth, this study can understand whether IUR cooperation applicants have the ability to integrate knowledge across fields in key technology research and development, which is of great significance for addressing complex technological challenges and promoting interdisciplinary innovation. In IUR cooperation, the positive impact of Knowledge Width on IUR applicants is mainly reflected in its ability to expand the knowledge base of the applicant and increase the diversity of knowledge sources, thereby promoting the improvement of innovation performance (Gkypali et al., 2017). Within the applicant, enterprises, universities, and research institutions each possess different knowledge systems and areas of expertise. When Knowledge Width increases, all parties can access more cutting-edge technological trends, changes in market demand, and innovative achievements in interdisciplinary fields (Zhang & Ba, 2024). For example, enterprises can learn about the latest academic research results and technological development trends through cooperation with universities and research institutions, thus providing strong support for their product innovation and strategic planning. Universities and research institutions can also better adjust their research directions with the market experience and industry insights of enterprises, making scientific research results more practical and market-oriented, and promoting the sharing of resources and complementary advantages among IUR applicants at a higher level (Philbin, 2008). In addition, Knowledge Width also has an important impact on the resource integration capabilities of IUR applicants. In the knowledge economy era, knowledge itself is an important resource. By expanding Knowledge Width, applicant members can better identify and utilize various potential resources, including technology, talent, and funding (Moorthy & Polley, 2010). For example, universities and research institutions can provide high-quality talent support and cutting-edge technological consulting for enterprises based on their profound accumulation in academic research and talent cultivation. Enterprises, on the other hand, can use their financial advantages and market channels to provide funding guarantees and platforms for the transformation of scientific research projects from universities and research institutions (Wright et al., 2014). By enhancing Knowledge Width, all parties can more effectively integrate resources, create a favorable situation for collaborative innovation, and improve the overall operational efficiency of IUR applicants.
Despite the many positive effects of Knowledge Width in IUR cooperation, an excessive pursuit of Knowledge Width can also have some negative impacts. When Knowledge Width is overextended, the innovation resources of IUR applicants may be dispersed across multiple fields, making it difficult to form sufficient technological depth and core competitiveness in key areas, thereby weakening their advantages in specific fields (Xu, 2015). At the same time, as Knowledge Width increases, the amount of information that applicant members need to process and integrate rises significantly, which may lead to information overload, increase the cost of information processing, and potentially reduce the effective utilization efficiency of knowledge, thus diminishing the potential innovative benefits brought by Knowledge Width (Wang et al., 2024). In addition, the expansion of Knowledge Width may also lead to knowledge redundancy. The knowledge obtained by applicant members from different channels may overlap significantly, not only wasting knowledge resources but also reducing innovation efficiency and hindering the rapid flow and effective integration of knowledge (Hongwei & Ludan, 2016). Moreover, the expansion of Knowledge Width is usually accompanied by the complexification of the cooperation network structure. IUR applicants need to coordinate with different types of partners in multiple fields, which may lead to a significant increase in coordination costs, reduce the efficiency of knowledge sharing, and even trigger cooperation conflicts (Gui et al., 2019). Finally, the increase in Knowledge Width may weaken the advantages of structural holes in knowledge acquisition and innovation. The resources obtained by applicant members from both ends of the structural holes may overlap with their existing knowledge, making it difficult to obtain the expected heterogeneous information and thus reducing the ability of applicant members to obtain innovative opportunities through structural holes (Khan, 2019).
Knowledge Combination ability is a key behavioral capability in the innovation process. It reflects the ability of individuals or organizations to establish and alter the connections between knowledge units to form new combinations or change existing ones. This ability not only reflects the dynamism of knowledge but also reveals the efficiency of knowledge flow and integration in IUR cooperation. IUR cooperation networks are characterized by their diversity, encompassing knowledge sources from different disciplines, research teams at various levels, and a wide range of collaborative research projects (Zhang et al., 2025). Knowledge combination can re-integrate the knowledge dispersed among these network elements. As the scale of the cooperation network expands, the volume of knowledge grows, making it increasingly difficult to filter out knowledge relevant to specific innovation goals (Jin et al., 2024). The cost of precisely locating such knowledge continues to rise, thereby affecting innovation performance (Craighead et al., 2009). Secondly, the increase in network scale brings about the diversification and fragmentation of knowledge sources (Yoon et al., 2015). Knowledge from different sources varies greatly in structure, expression, and quality (Wang et al., 2023). Lastly, the expansion of the network scale accelerates the pace of knowledge renewal (Wang & Zhou, 2023). New knowledge continuously emerges while old knowledge is rapidly phased out. Universities need to conduct more meticulous screening of knowledge resources, prioritizing the combination of knowledge with the greatest potential to generate high-value innovation outcomes, which in turn reduces the innovation efficiency of IUR cooperation (Tijssen et al., 2009). This requires universities to continuously re-evaluate and adjust existing knowledge combination plans, adding extra time and resource costs (Vyas, 2024).
This part proposes the following three key hypotheses, which aim to explore the core elements driving the formation and development dynamics of IUR cooperation applicants (Figure 8), with network characteristics serving as control variables (Table 3). These hypotheses reveal the key factors influencing the applicants’ dynamic mechanisms and their interplay from different perspectives, thereby laying the foundation for subsequent empirical research.
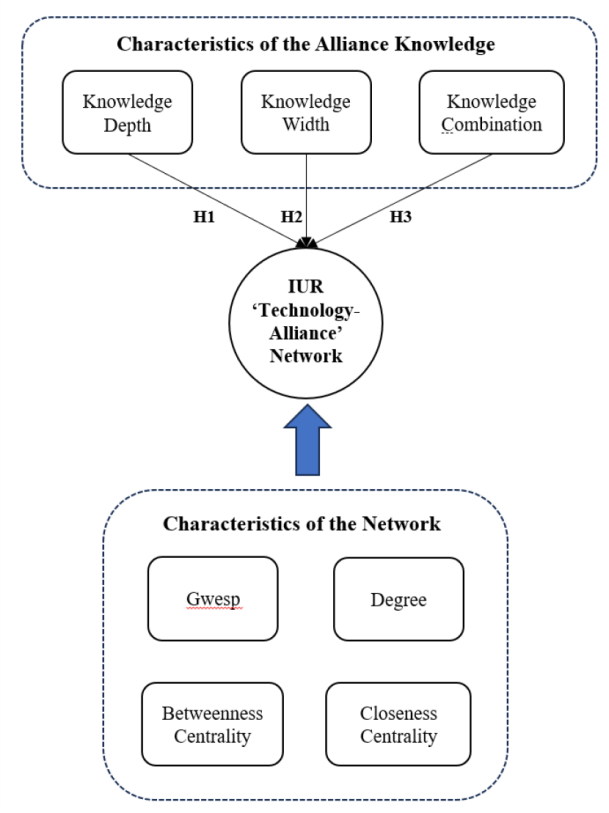
Figure 8. Research Hypotheses. |
Table 3. The concept and formula of characteristic variables. |
| Variable | Feature | Equation | Concept |
|---|---|---|---|
| Control variables | Degree | $\text { Degree }_{i}=\sum_{j} A_{i j}$ | The number of other nodes directly connected to a node, where Aij is an indicator variable representing whether there is an edge between node i and node j (if there is an edge, Aij=1; otherwise, Aij=0). |
| Betweenness Centrality | $B C_{i}=\sum_{s \neq i \neq t} \frac{\sigma_{s t}(i)}{\sigma_{s t}}$ | The measure of a node’s ability to control information flow in the network, where σst represents the number of shortest paths from node s to node t, and σst(i)是represents the number of those shortest paths that pass through node i. | |
| Closeness Centrality | $C C_{c}(v)=\frac{1}{\sum_{u \in V\{V\}} d(v, u)}$ | A measure used to assess the importance of a node, reflecting the degree of closeness between a particular node and all other nodes in the network. | |
| Independent variables | Knowledge Depth | $\text { knowledge }_{\text {depth }_{i}}=\sum\left(\frac{\text { count }^{2}}{N P_{i}}\right)^{2}$ | The extent, complexity, and systematic nature of an individual’s or organization’s knowledge in a specific field. It reflects the professional level and mastery of a person or organization in a particular domain. |
| Knowledge Width | $\text { knowledge } e_{\text {widh }}=1-\Sigma\left(\frac{\text { count }}{N P_{i}}\right)^{2}$ | A measure used to describe the scope and diversity of the knowledge possessed by an organization or system across different fields or subjects. | |
| Knowledge Combination | $\text { Clustering Coefficient }^{-1}=\frac{1}{\frac{2 * \text { triplets }^{*}(k-1)}{k *(k-1)}}$ | The behavior of individuals or organizations in the innovation process of establishing and altering the connections between knowledge units to form new combinations or change existing ones. |
H1: The Knowledge Depth has a differentiated impact on the key technology cooperation in IUR applicants at different stages.
H2: The Knowledge Width has a differentiated impact on the key technology cooperation in IUR applicants at different stages.
H3: The Knowledge Combination has a positive impact on the key technology cooperation in IUR applicants at different stages.
5.2 Model performance
5.2.1 Model regression analysis
This study primarily focuses on the impact of the knowledge characteristics of IUR cooperation applicants on the formation and development dynamics of key technology cooperation networks within IUR collaborations. The analysis covers the characteristics of both IUR cooperation applicants and key technologies in IUR cooperation. The factors related to cooperation applicants specifically include Degree, Betweenness centrality of the applicant, Closeness centrality of the applicant, Knowledge depth of the applicant, Knowledge width of the applicant, and the Knowledge combination capability of the applicant. The factors related to key technologies specifically include Degree of key technologies, Betweenness centrality of key technologies, Closeness centrality of key technologies.
Through a comprehensive analysis of these indicators, this study aims to gain a deeper understanding of how the knowledge characteristics of IUR cooperation applicants influence the construction and development of key technology cooperation networks. In the (ERGM), Estimate, z value, and P-value are important statistics used to assess the model parameters. The Estimate represents the quantified contribution of each network feature to the network structure. The z value is obtained by dividing the estimate by its standard error and is used to measure the significance of the estimate. The P-value is an important indicator in hypothesis testing, indicating the probability of observing the current statistic or a more extreme case under the null hypothesis (that the feature has no impact on the network).
(1) The endogenous motivation mechanism in the 2015-2016 period
When conducting Exponential Random Graph Model (ERGM) analysis on the bipartite network of IUR cooperation applicants, this study focused on the impact of three independent variables—knowledge depth of the applicant, Knowledge Width of the applicant, and knowledge combination ability of the applicant-on network structure, while controlling for the potential influence of other network characteristics. This section focuses on the period from 2015 to 2016 (Table 4). The negative impacts of Knowledge Depth (-0.29) and Knowledge Width (-0.43) indicate that an excessive focus on the depth of a particular field or an overexpansion of knowledge width can both have adverse effects on network formation. In today’s world where the integration of disciplines is increasingly important, such excessive depth may lead to “groupthink” within applicants, restricting the introduction of new knowledge and innovation. Although knowledge width is crucial for cross-domain collaboration, an excessive width may cause applicant members to disperse their efforts across multiple fields, making it difficult to form effective cooperation. However, the applicant’s knowledge combination ability (0.001) has a significantly positive impact on network formation. This indicates that the applicant can effectively integrate knowledge resources from different fields, promote cross-field cooperation, and thereby enhance the stability of the network and the efficiency of cooperation. Against the backdrop of the integration of disciplines, this ability is particularly important. By integrating knowledge resources from different fields, the applicant can introduce new perspectives and methods, promote the rapid development of key technologies, and foster innovation.
Table 4. The parameters of the ERGM for 2015-2016. |
| Variable | Feature | Estimated coefficient | Significance test value | P-value |
|---|---|---|---|---|
| Control variables | edges | -46.21 | -5.27 | < 0.001*** (8.76) |
| Applicant Degree | 0.82 | 5.02 | < 0.001*** (0.16) | |
| Key technology Degree | 0.44 | 0.80 | 0.42 (0.55) | |
| Applicant BC | -0.36 | -2.81 | 0.004** (0.12) | |
| Key technology BC | 0.008 | 0.32 | 0.742 (0.02) | |
| Applicant CC | 23.40 | 3.43 | 0.0005*** (6.80) | |
| Key technology CC | 64.59 | 2.77 | 0.005** (23.24) | |
| Independent variables | Applicant KD | -0.29 | -4.45 | < 0.001*** (0.06) |
| Applicant KW | -0.43 | -3.01 | 0.002** (0.14) | |
| Applicant KC | 0.001 | 0.001 | < 0.001*** (0.001) |
The results of the analysis with controlled variables indicate that the expansion of network size may lead to increased management costs and coordination difficulties, thereby reducing cooperation efficiency. Meanwhile, the number of connections a node has and the close connections between nodes have a significantly positive impact on the stability and cooperation efficiency of the network. In addition, the close connections between key technology nodes also have a significantly positive impact on the stability and cooperation efficiency of the network. These results further support the importance of optimizing network structure and strengthening the connections between key nodes in IUR cooperation.
(2) The endogenous motivation mechanism in the 2017-2018 period
This section focuses on the period from 2017 to 2018 (Table 5). This section focuses on the analysis of the period from 2017 to 2018. Compared with the period from 2015 to 2016, the changes in indicators show certain similarities. The knowledge depth continues to have a significantly negative impact on network formation, indicating that an excessive focus on the depth of a particular key technology field remains detrimental to the stability and cooperation efficiency of the network. The knowledge combination ability shows a significantly positive impact on network formation in both periods, highlighting the importance of the applicant’s ability to integrate knowledge resources from different fields. Regarding control variables, the degree and closeness centrality of the applicant have a significantly positive impact on network formation in both periods, while betweenness centrality continues to show a negative impact. Overall, these results further emphasize the importance of optimizing network structure and strengthening the connections between key nodes in IUR cooperation.
Table 5. The parameters of the ERGM for 2017-2018. |
| Variable | Feature | Estimated coefficient | Significance test value | P-value |
|---|---|---|---|---|
| Control variables | edges | -66.90 | -6.561 | < 0.001*** (10.19) |
| Applicant Degree | 0.89 | 6.55 | < 0.001*** (0.13) | |
| Key technology Degree | 0.12 | 0.23 | 0.81725 (0.56) | |
| Applicant BC | -0.35 | -3.01 | 0.0026** (0.11) | |
| Key technology BC | 0.004 | 0.18 | 0.8527 (0.02) | |
| Applicant CC | 21.74 | 3.42 | 0.0006*** (6.35) | |
| Key technology CC | 116.17 | 4.12 | < 0.001*** (28.17) | |
| Independent variables | Applicant KD | -0.46 | -5.63 | < 0.001*** (0.08) |
| Applicant KW | 0.002 | 0.02 | 0.9815 (0.12) | |
| Applicant KC | 0.001 | 0.001 | < 0.001*** (0.001) |
(3) The endogenous motivation mechanism in the 2019-2020 period
This section focuses on the period from 2019 to 2020 (Table 6). In the context of deepening technological cooperation and research and development, the analysis from 2019 to 2020 shows that the applicant’s knowledge width has a significantly positive impact on network formation. This indicates that moderately expanding the width of knowledge can bring more cooperation opportunities and resources to the network, thereby promoting its formation and development. This contrasts with the period from 2017 to 2018, when knowledge width had a positive but not significant impact, reflecting that as cooperative R&D deepens, the integration of cross-domain knowledge becomes increasingly important.
Table 6. The parameters of the ERGM for 2019-2020. |
| Variable | Feature | Estimated coefficient | Significance test value | P-value |
|---|---|---|---|---|
| Control variables | edges | -75.72 | -6.43 | < 0.001*** (11.76) |
| Applicant Degree | 0.92 | 6.28 | < 0.001*** (0.14) | |
| Key technology Degree | -0.52 | -0.65 | 0.5111 (0.80) | |
| Applicant BC | -0.47 | -3.77 | 0.0001*** (0.12) | |
| Key technology BC | 0.002 | 0.13 | 0.8909 (0.02) | |
| Applicant CC | 27.77 | 4.56 | < 0.001*** (6.08) | |
| Key technology CC | 134.40 | 4.01 | < 0.001*** (33.49) | |
| Independent variables | Applicant KD | -0.40 | -5.03 | < 0.001*** (0.08) |
| Applicant KW | 0.74 | 3.73 | 0.0001*** (0.19) | |
| Applicant KC | 0.001 | 0.001 | < 0.001*** (0.001) |
Additionally, the degree of key technology did not reach a significant level during the 2019-2020 period and had a negative value, whereas during the 2017-2018 period, although it did not reach a significant level, it had a positive value. This indicates that as cooperative R&D deepens, the number of connections of key technology nodes has a decreasing influence on network formation, while the close connections between nodes (such as closeness centrality) become more important.
(4) The endogenous motivation mechanism in the 2021-2022 period
This section focuses on the period from 2021 to 2022 (Table 7). The positive impact of knowledge depth indicates that, against the backdrop of continuous technological convergence, the applicant’s in-depth exploration of specific fields can provide strong support for the stability and cooperation efficiency of the network. Meanwhile, the significant positive impacts of knowledge width and knowledge combination ability further highlight the importance of technological diversification. The applicant’s ability to efficiently integrate knowledge resources from different fields has promoted the formation and development of the IUR cooperation network. This suggests that, in the context of technological convergence, extensive cross-domain cooperation and knowledge integration are crucial for the stability and cooperation efficiency of the network.
Table 7. The parameters of the ERGM for 2021-2022. |
| Variable | Feature | Estimated coefficient | Significance test value | P-value |
|---|---|---|---|---|
| Control variables | edges | -114.40 | -5.17 | < 0.001*** (22.12) |
| Applicant Degree | 1.34 | 6.94 | < 0.001*** (-0.96) | |
| Key technology Degree | -1.92 | -1.145 | 0.2523 (0.18) | |
| Applicant BC | -0.96 | -5.30 | < 0.001*** () | |
| Key technology BC | 0.0031 | 0.20 | 0.8384 (0.01) | |
| Applicant CC | -0.50 | -5.01 | < 0.001*** (0.10) | |
| Key technology CC | -0.77 | -3.81 | 0.0001*** (0.20) | |
| Independent variables | Applicant KD | 0.001 | 0.001 | < 0.001*** (0.001) |
| Applicant KW | 44.12 | 6.37 | < 0.001*** (6.91) | |
| Applicant KC | 224.50 | 3.28 | 0.001*** (68.36) |
Additionally, the significant negative impact of the applicant’s closeness centrality and the closeness centrality of key technologies on network formation contrasts with the significant positive impact observed in the previous stage. This indicates that, as technological diversification and convergence deepen, overly close connections between nodes may have an inhibitory effect on the stability and cooperation efficiency of the network.
(5) The endogenous motivation mechanism in the 2023-2024 period
This section focuses on the period from 2023 to 2024 (Table 8). The significant positive impacts of knowledge depth, knowledge width, and knowledge combination ability on network formation are similar to the results from 2021 to 2022, indicating that under the background of technological diversification, the applicant’s in-depth exploration of specific fields, broad knowledge coverage, and the ability to efficiently integrate knowledge resources from different fields are crucial for promoting the formation and development of the IUR cooperation network.
Table 8. The parameters of the ERGM for 2023-2024. |
| Variable | Feature | Estimated coefficient | Significance test value | P-value |
|---|---|---|---|---|
| Control variables | edges | -141.60 | -4.85 | < 0.001 *** (29.18) |
| Applicant Degree | 2.151 | 7.39 | < 0.001 *** (0.29) | |
| Key technology Degree | -1.807 | -0.84 | 0.4008 (2.15) | |
| Applicant BC | -1.747 | -6.63 | < 0.001 *** (0.26) | |
| Key technology BC | -0.005 | -0.21 | 0.829 (0.02) | |
| Applicant CC | -0.57 | -4.94 | < 0.001 *** (0.11) | |
| Key technology CC | -0.15 | -0.86 | 0.3872 (0.17) | |
| Independent variables | Applicant KD | 0.001 | 0.001 | < 0.001 *** (0.001) |
| Applicant KW | 68.58 | 7.87 | < 0.001 *** (8.70) | |
| Applicant KC | 258.30 | 2.87 | 0.0040** (89.77) |
In addition, the impact of applicant closeness centrality on network formation has shifted from positive to negative. This may indicate that in the context of deepening technological diversification and convergence, overly close connections between nodes may to some extent inhibit the stability and cooperation efficiency of the network, which could be related to the expansion of network scale and the increase in the complexity of cooperation.
5.2.2 Model Goodness-of-Fit test
This part employs the commonly used simulation methods in academia to further examine the goodness of fit of the model, thereby ensuring the reliability and accuracy of the model parameter estimation results. Specifically, based on the model parameters estimated from five time periods, 1,000 simulation runs were conducted and a simulated network was generated. In addition, key indicators such as edge-sharing partners, ROC curves, and PR curves were selected, and boxplots comparing the actual values and the fitted values were drawn. The results are shown in Figure 9.
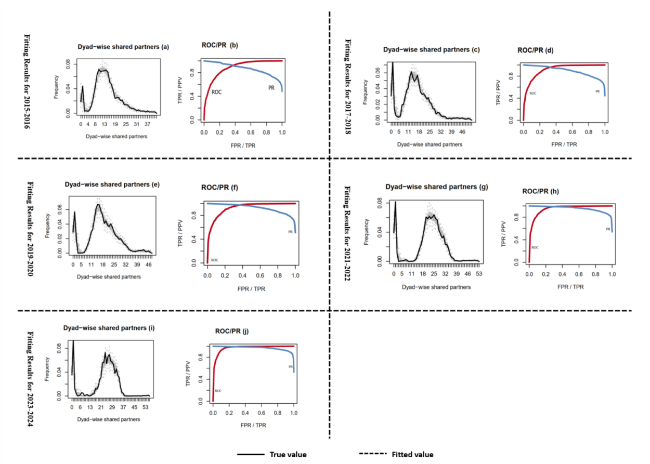
Figure 9. Fitting Results for 2015-2024. |
From the Figure 9, it can be observed that in terms of key characteristics, the curves of the actual values and the fitted values are essentially consistent, with the actual value curves almost all passing through the midpoint of the simulated network interval diagram. Moreover, the ROC curve is located in the upper left corner, indicating a high degree of correspondence between the model fit and the actual network, and a good fitting effect.
5.3 Model in terpretation
Over the decade from 2015 to 2024, the impact of Applicant knowledge depth, Knowledge Width, and knowledge combination capability on the network structure of IUR cooperation applicants has shown distinct stage-specific characteristics. In the early periods (2015-2016 and 2017-2018), the negative impact of knowledge depth and width on network formation was relatively significant, indicating that an excessive focus on knowledge depth in a specific area or an overexpansion of Knowledge Width may weaken the stability and efficiency of the cooperation network. However, the knowledge combination capability showed a significant positive effect in all periods, demonstrating its crucial role in integrating knowledge resources from different fields and promoting network stability and development. As time progressed (from 2019-2020 onwards), the positive impact of Knowledge Width gradually emerged, suggesting that moderately expanding the scope of knowledge can bring more opportunities for cooperation and resource integration to the network. Meanwhile, knowledge depth also showed a significant positive impact in the later periods (2021-2022 and 2023-2024), indicating that in-depth exploration of knowledge in a specific field can provide important support for network stability and cooperative efficiency. This suggests that in the development of IUR cooperation Applicant networks, it is necessary to balance knowledge depth and width in the early stages to avoid negative impacts, while in the later stages, deepening knowledge depth and expanding Knowledge Width can further promote network development. The knowledge combination capability has played a positive role throughout the process and is the core ability to promote the stability and development of IUR cooperation networks. Therefore, when building and optimizing network structures, IUR cooperation applicants should focus on cultivating and enhancing knowledge combination capabilities, and reasonably adjust knowledge depth and width according to the stage of development to achieve efficient operation and sustainable development of the network.
6 Discussion
6.1 Findings
Over the past decade, the evolution of key technologies and their impact on the network structure of IUR cooperation in China have both shown significant dynamic changes.
The high consistency between the evolution of key technologies and industrial development needs. By constructing a “Technology-Applicant” network, this study accurately identified the key technological fields in Chinese IUR cooperation over the past decade, such as G06 (data processing, business methods, image data processing, etc.), G01 (measurement of electrical variables and optical fields), H02 (power supply/distribution devices), and H04 (telecommunication technology). These key technological fields are highly aligned with China’s current industrial development needs, demonstrating the scientific nature and effectiveness of the research method. The IUR cooperation of Chinese “Double-First-Class” universities has shifted from a single technological field to the deep integration of multiple technological fields and expanded from traditional application areas to emerging ones, reflecting China’s competitiveness and influence in global technological competition.
The impact of knowledge characteristics on the formation of IUR cooperation networks. On the one hand, the ability to combine knowledge has always played an important role in promoting the formation of IUR cooperation networks. Applicants can effectively integrate knowledge resources from different key fields, thereby promoting the stability and development of cooperation networks. On the other hand, the dynamic impact of knowledge depth and width is evident. During the periods of 2015-2016, 2021-2022, and 2023-2024, an excessive focus on the depth of a specific key technological field or an over-expansion of knowledge width may weaken the stability and cooperation efficiency of the network. In contrast, during the periods of 2017-2018 and 2019-2020, moderately expanding knowledge width and efficiently integrating knowledge resources from different fields were of great significance to the stability and cooperation efficiency of the network.
The regulatory role of network structural characteristics on cooperation efficiency. Applicant degree and applicant closeness centrality have significant positive impacts on network formation, indicating that these characteristics help enhance the stability and cooperation efficiency of the network. In contrast, applicant betweenness centrality shows a significant negative impact, further demonstrating that the internal structural characteristics of the network play an important regulatory role in network stability and cooperation efficiency.
6.2 Implications for theory and practice
This study constructs a “Technology-Applicant” bipartite network model to analyze the key technologies in IUR cooperation in higher education institutions. It not only enriches the theoretical framework for analyzing IUR cooperation networks and provides a new research perspective and methodology but also has significant practical guiding significance. On the theoretical level, this study deepens the understanding of the mechanisms of IUR cooperation and the process of technological innovation, providing new research materials and theoretical support for fields such as technology management, innovation management, and network theory. By identifying and analyzing key technologies and their driving forces for cooperation, this study reveals the dynamic evolution patterns and underlying driving mechanisms of key technologies in IUR cooperation Applicant networks at different stages. On the practical level, this study provides clear directions and strategic recommendations for cooperation among universities, enterprises, and research institutions. By identifying key technologies, relevant actors can more effectively allocate resources, optimize cooperation models, and improve R&D efficiency. Meanwhile, the analysis of evolutionary paths provides a scientific basis for corporate technology strategy planning and government science and technology policy-making. It helps promote industrial upgrading and technological innovation. In addition, this study also offers references for the transformation of university scientific research results and the docking of enterprise technology needs. It promotes the deep integration of IUR and accelerates the industrialization process of scientific and technological achievements. In summary, this study not only expands the research boundaries of IUR cooperation network analysis in theory but also provides valuable decision-making support for relevant actors in practice. It has important theoretical and practical significance for promoting IUR cooperation and technological innovation.
7 Conclusion
The identification of key technologies in IUR patents serves as a navigation tool for various innovation entities. It not only helps them gain insights into current technological trends and hot areas but also plays a crucial role in promoting the transformation and application of scientific and technological achievements. However, there is currently a certain lag in the screening of hot technologies in IUR cooperative research and development, which restricts its application in real-time guidance of R&D and market layout. Under this backdrop, this study has proposed an analytical framework. This study constructed a “Technology-Applicant” bipartite network and divided the period into stages on a biennial basis. This study systematically identified the key technologies in IUR cooperation at different stages and analyzed the technological evolution. In addition, this study has introduced the Exponential Random Graph Model (ERGM) to compare and analyze the differences in the driving forces of key technology cooperation among IUR applicants at different stages, and to reveal the key factors influencing the formation of IUR cooperative Applicant networks. There are several limitations in this study that need to be further investigated in the future. On the one hand, the scope of the research objects is limited. The study mainly focuses on Double First-Class universities in China and does not cover other types of universities. On the other hand, while the study mainly focuses on the analysis of the IUR technology network, the analysis of the cooperation network between applicants is still insufficient. Future research will pay more attention to the interaction and cooperation patterns between different applicants, reveal broader cooperative dynamics and knowledge flow mechanisms, and further promote the theoretical and practical development of IUR cooperation.
Funding information
This work was supported by the Project on the Construction of the Strategic Research and Decision Support System of the Chinese Academy of Sciences (GHJ-ZLZX-2025-21).
Author contributions
Qining Peng (pengqining24@mails.ucas.ac.cn): Conceptualization, Data curation, Formal analysis, Resources, Writing - original draft;
Xian Zhang (zhangx@clas.ac.cn): Resources, Writing - review & editing;
Zhenkang Fu (fuzhenkang@163.com): Methodology, Validation, Visualization.
Supplementary materials
Appendix access at https://cstr.cn/31253.11.sciencedb.32045