

1 Introduction
The rapid development of information technology has led to significant growth in the number of published papers, researchers entering scientific fields, and new journals across academic disciplines (Birkle et al., 2020; Fortunato et al., 2018). In this context, exploring the scientific impact of various academic entities, such as papers, scientists, and journals, has become increasingly important (Xia et al., 2017). Evaluating the scientific impact of papers can help identify important research works for scientists in different fields and help them point out future research directions, thereby promoting the dissemination and creation of knowledge. Through systematic evaluation of researchers, institutions can efficiently identify a group of excellent scientists to solve complex scientific research problems to promote the development of science and technology. By measuring the impact of scientific journals, researchers can better track high-quality publications and make informed decisions about where to submit their work. Crucially, evaluating paper impact is essential for evaluating scientists and journals. Currently, scientists in various fields have conducted a series of studies to quantify the scientific impact of papers (Bai et al., 2017; Wang et al., 2013; Zeng et al., 2017; Zhou et al., 2024). However, developing the most effective method to evaluate the scientific impact of papers remains an unresolved issue (Vaccario et al., 2024).
Citation-based and network-based methods are the most widely used approaches to evaluate the scientific impact of papers (Zeng et al., 2017). The citation count is the simplest metric for measuring the impact of a paper. However, this index is not robust enough and can be quickly increased by malicious manipulation. It considers only the number, not the quality, of citations. Nevertheless, due to its simplicity and easy understanding, citation count still has a wide range of application scenarios (Waltman, 2016). For example, we can use the citation counts of the papers to calculate the h-index of the scientists used to evaluate their scientific influence and journal impact factors used to measure the influence of the journals (Hirsch, 2005; Glänzel & Moed, 2002). Among paper evaluation algorithms based on complex networks, the PageRank algorithm is the most representative and widely used algorithm (Bai et al., 2017). Compared with the citation count, the PageRank algorithm is more robust because it takes into account both the quantity and quality of citations. The PageRank algorithm was originally proposed to rank web pages (Brin & Page, 1998) and was later introduced into the field of scientometrics (Chen et al., 2007; Fiala et al., 2008; Ma et al., 2008), which greatly promoted the evaluation of scientific papers (Fiala, 2012; Mariani et al., 2016; Walker et al., 2007; Yao et al., 2014; Zhou et al., 2016).
Network-based paper evaluation methods are primarily applied to scientific citation networks, which are single-layer networks that exclusively represent citation relationships among papers. However, these methods only consider citation information and neglect other potential factors, such as the influence of authors and the reputation of journals. To make full use of various relevant information in the evaluation, some studies have considered the influence of other academic entities by constructing heterogeneous scholarly networks to evaluate the scientific impact of papers (Zhang & Wu, 2021; Zhou et al., 2012). For example, Zhou et al. (2007) used a heterogeneous network that contained a social network among authors, a paper citation network, and an authorship network to co-rank papers and their authors. Yan et al. (2011) used a heterogeneous scholarly network that contained a paper citation network, an author-paper network, and a journal-paper network to measure the prestige of papers, authors, and journals. Most constructed heterogeneous scholarly networks are unweighted bibliometric networks that neglect the strength of the relationships among entities, potentially leading to biased ranking results (Zhang, Wang, et al., 2019). Therefore, we still need to explore more reasonable evaluation algorithms that not only fully consider the diverse relationships between nodes, but also take into account the strength of these relationships.
In this paper, to better evaluate the scientific impact of papers, we propose a weighted heterogeneous network-based ranking algorithm, which is abbreviated as WHNR. This method mainly considers the mutually reinforcing relationship between the influence of different academic entities and the strength of the relationships among similar entities. The heterogeneous scholarly network we constructed takes into account the similarity between papers and redefines the weight of links in the author citation network, the weight of links in the author-paper (or paper-author) networks, and the weight of links in the journal-author (or author-journal) networks. We applied the WHNR algorithm to the American Physical Society (APS) dataset and validated the effectiveness of this method. The experimental results show that the WHNR algorithm can more effectively identify highly influential papers and perform well in identifying highly influential authors and journals.
2 Related work
Evaluating the scientific influence of papers can help researchers to quickly identify important papers from a vast amount of literature, thereby promoting the dissemination of knowledge and accelerating the creation of knowledge. The citation count of a paper is easy to calculate and understand, and it is a traditional indicator for measuring influence (Redner, 1998). Although this evaluation method is simple and convenient, its drawbacks are quite obvious. For instance, this indicator is prone to being maliciously manipulated, making it less robust. It is also subject to significant disciplinary biases (Radicchi et al., 2008) (e.g. different citation cultures across fields) and temporal biases (Newman, 2009) (e.g. papers published earlier generally have a higher citation count), which makes it difficult to assess and compare the influence of papers in different academic fields fairly, as well as the influence of newly published papers. To overcome the shortcomings of citation counts, some modified indicators based on citation counts have been proposed, such as c10 (Sinatra et al., 2016) and cf (Radicchi et al., 2008).
The citation count of a paper is actually calculated based on the local information of the paper citation network, and it does not consider the interrelationships among papers in the network. To fully utilize the global information of the citation network of papers to enhance the performance of paper influence evaluation, many evaluation algorithms based on PageRank have been proposed. The PageRank algorithm not only takes into account the popularity of the citation but also the prestige of the citing papers. The PageRank algorithm is an iterative algorithm based on global network information and is more robust than the citation count. However, it also has certain shortcomings. For instance, the algorithm contains a parameter, and the variation in this parameter affects the evaluation results. Moreover, owing to the cumulative advantage of the papers published earlier, the PageRank algorithm ranks the earlier published papers higher, neglecting the aging characteristics of the papers. To address the time bias issue of the PageRank algorithm, modified algorithms such as Citerank (Walker et al., 2007) and Rescaled PageRank (Mariani et al., 2016) have been proposed.
The paper citation network is a single-layer, homogeneous network. The algorithm for evaluating the influence of papers based on the paper citation network only considers the relationships between the influences of papers but does not take into account the mutual influences among other entities. There are already existing studies on ranking papers by leveraging mutual reinforcement within heterogeneous networks. Among these studies, the combination of the PageRank and HITS algorithms is the most frequently used evaluation method. Some studies have only considered the relationship between the two types of entities, authors and papers, to evaluate the influence of a paper (Zhou et al., 2012). For example, Zhou et al. (2007) described the relationship between authors and papers based on social networks, citation networks, and co-authorship networks and utilized the information of this heterogeneous network to evaluate the impact of papers and authors. Some studies have used the relationships among three types of entities, namely, papers, authors, and journals, to evaluate papers. Some representative algorithms, such as TRi-Rank (Liu et al., 2014), P-Rank (Yan et al., 2011), and W-rank (Zhang, Wang, et al., 2019), have been proposed. The performance of these algorithms is influenced by their heterogeneous network structures. Exploring an appropriate network structure to describe relationships among different entities is an important research issue. This study aims to develop a method for evaluating the influence of papers based on heterogeneous academic networks. In addition, with the availability of text content and the development of artificial intelligence technology, some research has also explored the combination of heterogeneous academic networks and text content features to evaluate the influence of papers (Jeon & Jung, 2024; Wang, Zhang, et al., 2024; Xiao et al., 2022; Zhang & Wu, 2021).
3 Methodology
3.1 Weighted heterogeneous scholarly network
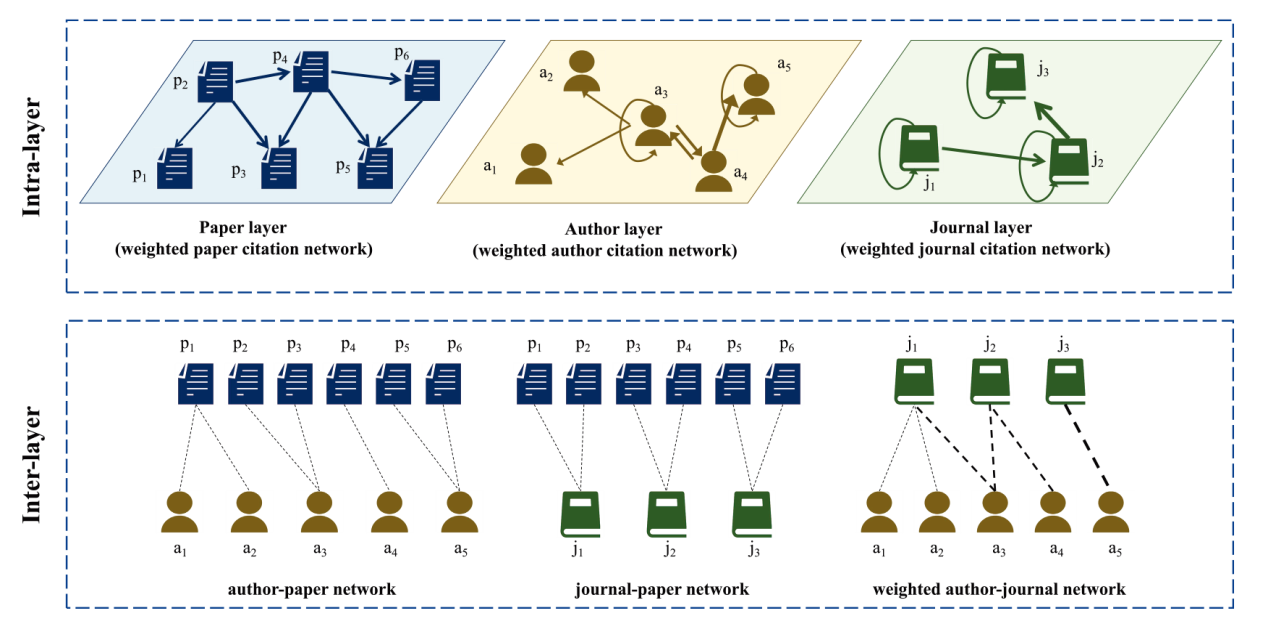
A homogeneous academic network refers to a network that contains only one kind of node and link relationship in the network. However, the heterogeneous academic network constructed in this study is a multilayer network that contains various types of nodes and link relationships. We regard papers, authors, and journals as nodes in this heterogeneous network and treat the relationship between them as links. A schematic diagram of a weighted heterogeneous network is shown in Figure 1. This network consists of two parts: intralayer and interlayer networks. The intralayer networks contain three layers: paper, author, and journal layers. In the paper layer, we regard papers as nodes, and citation relationships between papers as links, that is, the paper citation network. In the author layer, we regard authors as nodes, and the citation relationship between authors as links, that is, the author citation network. In the journal layer, we regard journals as nodes, and the citation relationship between journals as links, that is, the journal citation network. The interlayer networks contain three types of undirected bipartite graphs: author-paper (or paper-author) network, author-journal (or journal-author) network, and journal-paper (or paper-journal) network. For the construction of each bipartite network, we mainly consider the author-paper writing relationship, the author-journal publishing relationship, and the journal-paper publishing relationship. Therefore, the heterogeneous academic network we constructed was composed of three single-layer networks and three bipartite networks. When constructing the heterogeneous network, we consider not only the link relationship but also the link weight. Next, we introduce each network in detail.
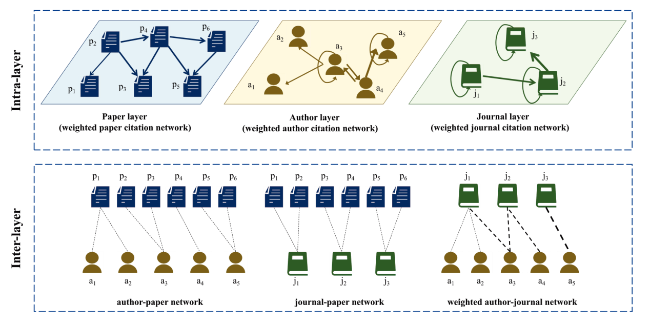
Figure 1. A schematic diagram of a weighted heterogeneous scholarly network. |
3.1.1 Weighted paper citation network
The traditional paper citation network is a directed and unweighted network in which nodes represent papers and links represent citation relationships between papers. The outgoing links of a node are directed by this node to other nodes, indicating that the paper cites other papers. The incoming links of a node are pointed to this node by other nodes, indicating that this paper has been cited by other papers. This network can be described by an adjacency matrix P, where its element $ P_{p_{i} p_{j}}$= 1 if the paper pi cites the paper pj and $ P_{p_{i} p_{j}}$= 0 otherwise. The transition matrix $\bar{P}$ corresponding to matrix P is defined as: $\bar{P}=\left(\frac{P_{p_{i} p_{j}}}{k_{p_{i}}^{\text {out }}}\right)_{N_{p} \times N_{p}}$, where Np represents the number of papers in the paper citation network, $k_{p_{i}}^{\text {out }}=\sum_{p_{j}} P_{p_{i} p_{j}}$ is the outdegree of paper pi. In general, if a paper is more similar in research content or topic to its reference, then this reference will contribute to or help the paper more. However, the traditional paper citation network only considers the citation relationship and does not consider the similarity between papers. Therefore, we obtain a weighted paper citation network by introducing the similarity between papers, and the adjacency matrix of this network is denoted by Pw. Then, for any paper pi and paper pj, the weight of the link between the two papers can be defined as follows.
$w_{p_{i} p_{j}}=\left\{\begin{array}{ll} P_{p_{i} p_{j}}+S_{p_{i} p_{j}} & \text { if paper } p_{i} \text { cites } p_{j} \\ 0 & \text { otherwise } \end{array}.\right.$
where $S_{p_{i} p_{j}}$ represents the similarity between papers pi and pj. In this study, we use cosine similarity to calculate the similarity between nodes. Since nodes in the citation network have outgoing and incoming links, we define the similarity between papers as the sum of their cosine similarity in the outgoing and incoming directions. The $S_{p_{i} p_{j}}$ can be expressed as
$S_{p_{i} p_{j}}=\frac{\left|\tau_{i}^{\text {out }} \cap \tau_{j}^{\text {out }}\right|}{\sqrt{k_{p_{i}}^{\text {out }} k_{p_{j}}^{\text {out }}}}+\frac{\left|\tau_{i}^{\text {in }} \cap \tau_{j}^{\text {in }}\right|}{\sqrt{k_{p_{i}}^{\text {in }} k_{p_{j}}^{\text {in }}}}.$
where $\tau_{i}^{\text {out }}$ and $\tau_{i}^{i n}$ represent the outgoing neighbors and the incoming neighbors of node pi. $\left|\tau_{i}^{\text {out }} \bigcap \tau_{j}^{\text {out }}\right|$ represents the number of common references between papers pi and pj. $\left|\tau_{i}^{i n} \bigcap \tau_{j}^{i n}\right|$ represents the number of papers that jointly cite papers pi and pj. $k_{p_{i}}^{i n}=\sum_{p_{j}} P_{p_{j} p_{i}}$ is the indegree of the paper pi, which represents the number of citations for the paper pi.
The transition matrix corresponding to matrix Pw is denoted by $\overline{P_{w}}=\left(\frac{w_{p_{i} p_{j}}}{w_{p_{i}}^{\text {out }}}\right)_{N_{p} \times N_{p}}$, where $w_{p_{i}}^{\text {out }}=\sum_{p_{j}} w_{p_{i} p_{j}}$ represents the strength of the paper pi in the weighted paper citation network.
3.1.2 Weighted author citation network
A traditional author citation network is a directed and weighted network, where the link weight is the number of citations between authors. This method of network construction does not consider the number of authors in the paper. Therefore, we reconstruct a weighted author citation network based on existing research. Suppose that paper pi has m authors (a1, a2, …, am) and paper pj has n authors (a1, a2, …, an); if paper pi cites paper pj, a directed edge from author as (1 ≤ s ≤ m) to author at (1 ≤ t ≤ n) will be established when building a new author citation network and the link weight between authors as and at is $\frac{1}{m n}$. If author ap cites aq’s papers, then a link is established between
authors ap and aq and the weight of this link is defined as
$w_{a_{p} a_{q}}=\sum_{p_{i} \rightarrow p_{j}} \frac{\delta_{a_{p}}^{p_{i}} \delta_{a_{q}}^{p_{j}}}{N_{p_{i}} N_{p_{j}}} \quad p_{i}=1,2, \cdots, N_{p} ; p_{j}=1,2, \cdots, N_{p}$
where $p_{i} \rightarrow p_{j}$ represents the paper pi cites the paper pj. $\delta_{a_{p}}^{p_{i}}=1$ if ap is one of the authors of pi, $\delta_{a_{p}}^{p_{i}}=0$ otherwise. $\delta_{a_{q}}^{p_{j}}=1$ if aq is one of the authors of pj, $\delta_{a_{q}}^{p_{j}}=0$ otherwise. $N_{p_{i}}$ is the number of authors of the paper pi. $N_{p_{i}}$ is the number of authors of the paper pj. The transition matrix corresponding to the weighted author citation network is denoted by $\overline{A_{w}}=\left(\frac{w_{a_{p} a_{q}}}{w_{a_{p}}^{\text {out }}}\right)_{N_{a} \times N_{a}}$, where $w_{a_{p}}^{\text {out }}=\sum_{a_{q}} w_{a_{p} a_{q}}$ represents the strength of the author ap in the weighted author citation network,
Na represents the number of authors in the dataset.
3.1.3 Weighted journal citation network
For a weighted journal citation network, if a paper pi published in the journal ju cites a paper pj published in the journal jv, a directed link from the journal ju to the journal jv is added to this network. The strength of the link from journal ju to journal jv is the total number of citations that all papers in journal ju cite papers in journal jv and it is defined as
$w_{j_{u} j_{v}}=\sum_{p_{i} \in j_{u}, p_{j} \in j_{v}} P_{p_{i} p_{j}}$
The transition matrix corresponding to the weighted journal citation network is denoted by $\overline{J_{w}}=\left(\frac{w_{j_{u} j_{v}}}{w_{j_{u}}^{\text {out }}}\right)_{N_{j} \times N_{j}}$, where $w_{j_{u}}^{\text {out }}=\sum_{j_{v}} w_{j_{u} j_{v}}$ represents the strength of the journal ju in the weighted journal citation network and Nj represents the number of journals in the dataset.
3.1.4 Author-paper network
The author-paper (or paper-author) network is a weighted bipartite network, where the links represent that the writing relationship exists only between authors and papers. We assign link weights based on the number of authors in a paper. The adjacency matrix for the weighted author-paper network is denoted by AP which is a Na × Np matrix, where its element AP (ap, pi) = $\frac{1}{k}$ if the author ap writes the paper pi with k authors. Then the transition matrix $\overline{A P}$ corresponding to the author-paper network is defined as
$\overline{A P}=\left(\frac{A P\left(a_{p}, p_{i}\right)}{\sum_{p_{j}} A P\left(a_{p}, p_{j}\right)}\right)_{N_{a} \times N_{p}}$
3.1.5 Weighted author-journal network
The author-journal (or journal-author) network is a weighted bipartite network where links only exist between authors and journals. If author ap has published a paper in journal ju, a link connecting author ap and journal ju will be added to the author-journal network. Taking into account the number of published papers by authors and the number of authors in the papers, the strength of the link between the author ap and the journal ju is defined as
$w_{a_{p} j_{u}}=\sum_{p_{k}} \frac{\delta_{a_{p}}^{p_{k}} \delta_{j_{u}}^{p_{k}}}{N_{p_{k}}}$
where $\delta_{j_{u}}^{p_{k}}=1$ if paper pk is published in journal ju, $\delta_{j_{u}}^{p_{k}}=0$ otherwise. $N_{p_{k}}$ is the number of authors of the paper pk. Let the matrix AJ denote the adjacency matrix of the author-journal network and its element $A J\left(a_{p}, j_{u}\right)=w_{a_{p} j_{u}}$. Then the transition matrix $\overline{A J}$ corresponding to the author-journal network is defined as
$\overline{A J}=\left(\frac{A J\left(a_{p}, j_{u}\right)}{\sum_{j_{v}} A J\left(a_{p}, j_{v}\right)}\right)_{N_{a} \times N_{j}}$
3.1.6 Journal-paper network
The journal-paper (or paper-journal) network is an unweighted bipartite network where the links representing the publishing relationship exist only between journals and papers. The adjacency matrix of the journal-paper network is denoted by JP, which is an Nj × Np matrix, where its element JP(ju, pi) = 1 if journal ju publishes paper pi and JP(ju, pi) = 0 otherwise. Then the transition matrix $\overline{J P}$ corresponding to the journal-paper network is defined as
$\overline{J P}=\left(\frac{J P\left(j_{u}, p_{i}\right)}{\sum_{p_{j}} J P\left(j_{u}, p_{j}\right)}\right)_{N_{j} \times N_{p}}$
3.2 The WHNR model
Some studies have shown that evaluating the influence of different entities requires considering not only the citation relationships among homogeneous entities, but also the mutual reinforcement of heterogeneous entities (Jiang et al., 2016; Yu et al., 2017). Therefore, we make the following assumptions.
• Papers tend to be important if they are cited by other important papers.
• Papers tend to be important if they are written by prestigious authors or published in high-authority journals.
• Authors tend to have a high reputation if they publish many high-impact papers or many papers in highly authoritative journals.
• Authors tend to be prestigious if they are cited by other prestigious authors.
• Journals tend to be authoritative if they publish a large number of high-impact papers, have many prestigious authors who have published in them, or are cited by other high-authority journals.
We can find that the evaluation of entities needs to consider the impact of two parts: the same type of entities and different types of entities. For the first part, we mainly used the PageRank algorithm on the intralayer network to measure the effect of the same type of entities on the evaluation. For the second part, the HITS algorithm is mainly used in the interlayer network to measure the effect of different types of entities on evaluation. In particular, considering that the intralayer networks in this study are all weighted networks, we used the weighted PageRank algorithm to evaluate the scientific impact of different entities. The expression for the weighted PageRank algorithm is as follows:
$P R_{i}(t)=d \sum_{j=1}^{N}\left[\frac{w_{j i}}{w_{j}^{\text {out }}}\left(1-\delta_{w_{j}^{\text {out }, 0}}\right)+\frac{1}{N} \delta_{w_{j}^{\text {out }, 0}}\right] P R_{j}(t-1)+\frac{1-d}{N}$
where PRi(t) is the score of node i at the iteration step t. d is a tunable parameter between 0 and 1, and this parameter usually takes a value of 0.85 when simulating. N is the total number of nodes in the network. wji is the element in the adjacency matrix of the weighted network. $w_{j}^{\text {out }}$ is the out-strength of node j. If $w_{j}^{\text {out }}=0$, $\delta_{w_{j}^{\text {out }, 0}}=1$, and $\delta_{w_{j}^{\text {out }, 0}}=0$ otherwise.
Finally, we combine PageRank algorithm and HITS algorithm to evaluate different entities based on the weighted heterogeneous academic network we constructed, which is the mutually reinforced ranking algorithm we designed. In this algorithm, we use the $\operatorname{score}^{p_{i}}(t)$, $\operatorname{score}^{a_{p}}(t)$, $\operatorname{score}^{j_{u}}(t)$ denote the influence scores of the paper pi, author ap, and journal ju at the t time step respectively. Then the influence of paper pi is defined as
$\begin{array}{l} \operatorname{score}^{p_{i}}(t)=\alpha_{1}\left\lfloor d \sum_{p_{j}=1}^{N_{p}}\left[\frac{w_{p_{j} p_{i}}}{w_{p_{j}}^{\text {out }}}\left(1-\delta_{w_{p_{j}}^{\text {out }}, 0}\right)+\frac{1}{N_{p}} \delta_{w_{p_{j}}^{\text {out }}, 0}\right] \operatorname{score}^{p_{j}}(t-1)+\frac{1-d}{N_{p}}\right\rfloor \\ +\left(1-\alpha_{1}\right) \beta_{1}\left[\sum_{a_{p}=1}^{N_{a}} \frac{A P\left(a_{p}, p_{i}\right)}{\sum_{p_{j}}} \operatorname{AP(a_{p},p_{j})} \operatorname{score}^{a_{p}}(t-1)\right] \\ +\left(1-\alpha_{1}\right)\left(1-\beta_{1}\right)\left[\sum_{j_{u}=1}^{N_{j}} \frac{J P\left(j_{u}, p_{i}\right)}{\sum_{p_{j}} J P\left(j_{u}, p_{j}\right)} \operatorname{score}^{j_{u}}(t-1)\right] \end{array}$
where the parameters α1, (1−α1)β1, and (1−α1) (1−β1) represent the effect of paper entities, author entities, and journal entities on the evaluation of the paper pi, respectively. Np, Na, and Nj represent the total number of papers, authors, and journals, respectively. Similarly, the influence of the author ap can be defined as
$\begin{aligned} \operatorname{score}^{a_{p}}(t) & =\alpha_{2}\left\lfloor d \sum_{a_{q}=1}^{N_{a}}\left[\frac{w_{a_{q} a_{p}}}{w_{a_{q}}^{\text {out }}}\left(1-\delta_{w_{a_{q}}^{\text {out }}, 0}\right)+\frac{1}{N_{a}} \delta_{w_{a_{q}}^{\text {out }}, 0}\right] \operatorname{score}^{a_{q}}(t-1)+\frac{1-d}{N_{a}}\right\rfloor \\ & +\left(1-\alpha_{2}\right) \beta_{2}\left[\sum_{p_{i}=1}^{N_{p}} \frac{A P\left(a_{p}, p_{i}\right)}{\sum_{a_{q}} A P\left(a_{q}, p_{i}\right)} \operatorname{score}^{p_{i}}(t-1)\right] \\ & +\left(1-\alpha_{2}\right)\left(1-\beta_{2}\right)\left[\sum_{j_{u}=1}^{N_{j}} \frac{A J\left(a_{p}, j_{u}\right)}{\sum_{a_{q}} A J\left(a_{q}, j_{u}\right)} \operatorname{score}^{j_{u}}(t-1)\right] \end{aligned}$
where the parameters α2, (1−α2)β2, and (1−α2) (1−β2) represent the effect of author entities, paper entities, and journal entities on the evaluation of the author ap, respectively. The influence of the journal ju can be defined as:
$\begin{aligned} \operatorname{score}^{j_{u}}(t) & =\alpha_{3}\left\lfloor d \sum_{j_{v}=1}^{N_{j}}\left[\frac{w_{j_{v} j_{u}}}{w_{j_{v}}^{\text {out }}}\left(1-\delta_{w_{j_{v}}^{\text {out }}}\right)+\frac{1}{N_{j}} \delta_{w_{j_{v}}^{\text {out }}, 0}\right] \operatorname{score}^{j_{v}}(t-1)+\frac{1-d}{N_{j}}\right\rfloor \\ & +\left(1-\alpha_{3}\right) \beta_{3}\left[\sum_{p_{i}=1}^{N_{p}} \frac{J P\left(j_{u}, p_{i}\right)}{\sum_{j_{v}} J P\left(J_{v}, p_{i}\right)} \operatorname{score}^{p_{i}}(t-1)\right] \\ & +\left(1-\alpha_{3}\right)\left(1-\beta_{3}\right)\left[\sum_{a_{p}=1}^{N_{a}} \frac{A J\left(a_{p}, j_{u}\right)}{\sum_{j_{v}} A J\left(a_{p}, j_{v}\right)} \operatorname{score}^{a_{p}}(t-1)\right] \end{aligned}$
where the parameters α3, (1−α3)β3, and (1−α3) (1−β3) represent the effect of the journal entities, paper entities, and author entities on the evaluation of the journal ju, respectively. When simulating the above iterative algorithm, we first apply the weighted PageRank algorithm to the weighted paper citation network, weighted scientist citation network, and weighted journal citation network to obtain the initial scores of the influence of different entities in the algorithm. Then, the iterative algorithm ends when the influence scores of the entities in the iterative algorithm reach a steady state.
3.3 Identification of recognized high-impact papers
A well-performing ranking algorithm should be able to identify recognized high-impact papers. The Nobel Prize in Physics was established to reward scientists who have made outstanding contributions to the field of physics. These Nobel laureates in physics are widely recognized as highly influential scientists. Therefore, if our evaluation algorithm can identify their Nobel Prize-winning papers well, it can show the effectiveness of our evaluation algorithm to some extent. Based on a dataset of publication records for Nobel laureates shared by Li et al. (2019), we collected 110 Nobel Prize-winning papers from 95 Nobel Prize winners in physics from the APS journal dataset.
To further validate the effectiveness of the WHNR algorithm, we conducted a comparative analysis between Nobel Prize-winning papers and control papers to evaluate its superior performance in identifying award-winning papers compared to other algorithms. For each award-winning paper, we matched 20 non-award-winning papers as control papers, among which 9 Nobel Prize-winning papers had fewer than 20 matched non-award-winning papers. These control papers had the same team size, publication time, journal, and approximately equal citation counts (±5) as the corresponding award-winning papers. Finally, 110 Nobel Prize-winning papers were matched with 2,094 non-award-winning papers. We compared the scores of the award-winning papers with those of the control papers. In each comparison, if an award-winning paper’s score exceeded that of a control paper, it was considered a successful identification. We then applied the area under the receiver operating characteristic (ROC) curve (AUC) to evaluate the success rate of identification (Hanley & McNeil, 1982; Wang et al., 2023; Wang, Qiao, et al., 2024). The value range of the AUC is from 0 to 1. The larger the value, the stronger the algorithm’s ability to identify award-winning papers. The calculation of the AUC metric is as follows:
$A U C=\frac{N_{1}+0.5 N_{2}}{N}$
where N represents the number of comparisons between the Nobel Prize-winning papers and the control papers. N1 and N2 represent the number of times the scores of the Nobel Prize-winning papers exceed and equal to those of the matched papers, respectively, across N comparisons. The performance of different ranking algorithms in identifying award-winning papers can be evaluated by comparing their AUC values.
4 Experiments and results
4.1 Data set
In this study, we used the APS dataset provided by the American Physical Society to test our algorithm. There are 482,566 papers, ranging from year 1893 to year 2010, with 236,884 different authors in this dataset. These papers belong to the field of physics, and the list of author names is provided by Sinatra et al. (2016), who conducted a comprehensive disambiguation process in the APS data. The dataset contains a total of 11 journals, namely Physical Review (Series I), Physical Review, Physical Review A, B, C, D, E, Physical Review Letters, Physical Review Special Topics-Accelerators and Beams, Physical Review Special Topics-Physics Education Research, and Review of Modern Physics, and they contain 1,458, 47,941, 56,589, 144,205, 31,000, 59,633, 38,326, 98,865, 1,420, 126, and 3,003 papers, respectively. Based on the dataset we used, we obtained information about publication time, references, authors, and journals for papers, which allowed us to build a heterogeneous scholarly network.
4.2 Experimental setting
4.2.1 Parameter setting
Our algorithm contains six parameters, where parameter α1 represents the contribution of network information at the paper level to the evaluation of the academic impact of the papers, parameter α2 represents the contribution of network information at the author level to the evaluation of the academic impact of the scientists, and parameter α3 represents the contribution of network information at the journal level to the evaluation of the academic impact of the journals. (1−α1) β1 represents the contribution of the interlayer network information between the paper layer and the author layer on evaluating the scientific impact of the papers, (1−α1) (1−β1) represents the contribution of the interlayer network information between the paper layer and the journal layer on evaluating the scientific impact of the papers, (1−α2) β2 represents the contribution of the interlayer network information between the author layer and the paper layer on evaluating the academic impact of the scientists, (1−α2) (1−β2) represents the contribution of the interlayer network information between the author layer and the journal layer on evaluating the academic impact of the scientists, (1−α3) β3 represents the contribution of the interlayer network information between the journal layer and the paper layer on evaluating the prestige of the journals, (1−α3) (1−β3) represents the contribution of the interlayer network information between the journal layer and the author layer on evaluating the prestige of the journals. We believe that intralayer and interlayer network information may play different roles in the evaluation of different academic entities. In this study, we assume that α1 = α2 = α3 = α, β1 = β2 = β3 = 0.5, where α is a number between 0 and 1. It should be noted that when α = 0, our ranking algorithm only considers information about the interlayer networks and does not utilize the information about the intralayer networks. And when α = 1, this algorithm only considers the information of the intralayer networks and ignores the information of the interlayer networks.
4.2.2 Other comparison methods
In the experiment, we compared the WHNR algorithm with the following four mutual enhancement algorithms, which can evaluate the scientific impact of papers, authors, and journals:
• P-Rank. The algorithm was proposed by Yan et al. (2011) and applied to multilayer academic networks. The multilayer academic network they used only includes the paper citation network, the paper-author network, and the paper-journal network. They think that the academic impact of scientists is determined only by the impact of the papers they write and that the impact of journals is determined only by the scientific impact of the papers they publish.
• MutualRank. This algorithm was proposed by Jiang et al. (2016) and was also applied to multilayer academic networks. The multilayer network they used includes six types of networks: paper citation network, author citation network, journal citation network, paper-author network, paper-journal network, and author-journal network, of which the paper citation network, paper-author network, and author-journal network are all unweighted networks. They believe that the calculation of the scientific impact of different entities is a mutually reinforcing process.
• MLMRJR. The algorithm was proposed by Yu et al. (2017) and applied to multilayer academic networks. The multilayer networks they use include time-aware paper citation network, author citation network and co-authorship network, journal citation network, paper-author network, paper-journal network, and author-journal network. The weight of the link in the paper citation network considers the aging effect of the impact of the paper. In addition, the algorithm considers the cooperative effect when exploring the academic impact of scientists.
• TAMRR. The algorithm was proposed by Zhang, Fan, et al. (2019) and applied to multilayer academic networks. The academic multilayer network they use includes the paper citation network, author citation network, journal citation network, paper-author network, paper-journal network, and author-journal network. The algorithm considers the timing of citations and the distribution of the co-authors’ contributions.
4.3 Computational analysis of the scientific impact of papers
We applied our ranking algorithm and the four mutual enhancement algorithms mentioned above to the APS dataset. We first analyzed the influence of the parameter value α in the WHNR algorithm on the evaluation of the scientific impact of papers. We calculated the paper scores of the WHNR algorithm under different parameter values α, and then investigated the Spearman’s rank correlation coefficient between the above paper scores under different parameters α. The results are shown in Figure 2. We can see that for any two parameter values α, as the difference between them increases, the correlation between the paper scores for these two parameters weakens. In particular, the correlation between the paper scores under α = 0 or α = 1 and the paper scores under other parameter values is relatively weak. This indicates that both the intralayer and interlayer structures of heterogeneous scholarly networks have a significant effect on evaluating the impact of papers.
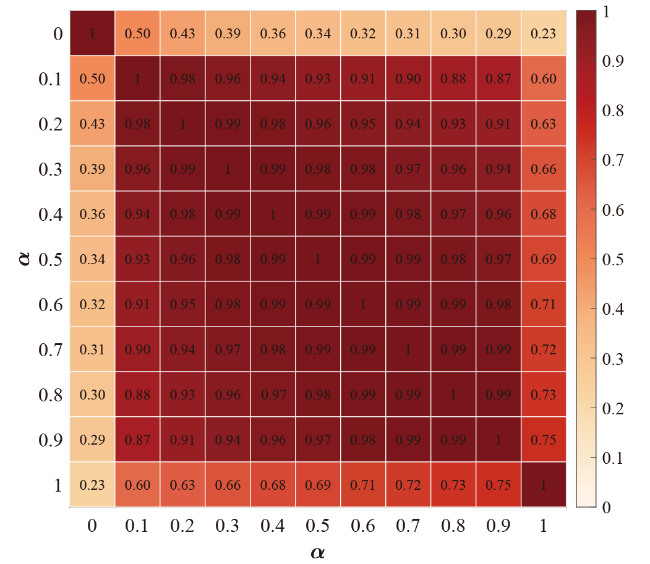
Figure 2. The influence of dynamic parameter values α in WHNR algorithm on the evaluation results of paper impact. |
We then compared the differences of the WHNR algorithm under different parameter values α in identifying highly ranked papers. We first selected the top 1% of the papers identified by the WHNR algorithm with different parameter values α and then calculate their overlap rate among the highly ranked papers. If the overlap rate between them is higher, it indicates that the ranking algorithms under two different parameters are more similar in identifying high-impact papers. The results of the overlap rate are shown in Figure 3. We also observed that when the values of the two parameter α are close, the corresponding ranking algorithms show a high degree of overlap in identifying highly ranked papers, with an overlap rate exceeding 0.9. There is an obvious difference between the evaluation results of the papers under the parameter α = 0 and those under other parameters in identifying the top 1% papers, and all their overlap rates do not exceed 0.1. By comparing the performance of the WHNR algorithm in evaluating all papers and high-ranked papers, it is found that the WHNR algorithm is more sensitive to parameter α in evaluating high-impact papers.
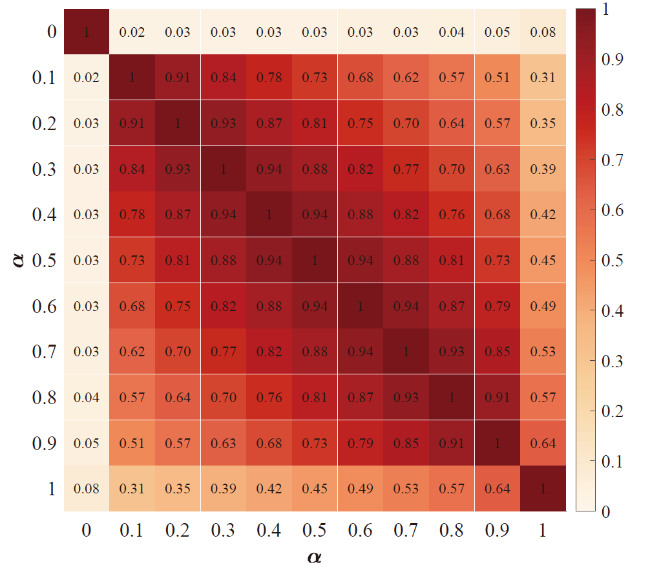
Figure 3. The overlap rate of the top 1% high-impact papers identified by the WHNR algorithm under different parameter values α. |
We also explored the performance of the WHNR algorithms in identifying recognized high-impact papers. We compared the mean rank of these Nobel Prize-winning papers in the WHNR algorithm under different parameters, as shown in Figure 4. The smaller the average ranking value of a paper, the higher its ranking position. We find that the WHNR algorithm achieves the minimum average ranking value for these winning papers when α = 0.3. Therefore, we consider the parameter α = 0.3 as the optimal parameter value of the WHNR algorithm. We then calculated the mean rank of the 110 Nobel Prize-winning papers under the other four mutual enhancement algorithms and compared them with the results of our WHNR algorithm with α = 0.3. The results are shown in Figure 5. We can find that the WHNR algorithm performs the best among these ranking algorithms and is better able to identify recognized high-impact papers. The Prank algorithm, which uses only information from the paper citation, author-paper, and journal-paper networks, performs the worst. In addition, for these mutual enhancement algorithms, we conducted comparative analyses between Nobel Prize-winning papers and control papers to evaluate their performance in identifying award-winning papers. We performed a total of 100 rounds of comparative experiments, and in each round, the AUC value of each algorithm was obtained. Finally, the average AUC values of WHNR, TAMRR, Prank, MutualRank, and MLMRJR are 0.9491, 0.9483, 0.9413, 0.9456, and 0.9367, respectively. We can observe that the WHNR algorithm has the highest AUC value among these algorithms, which indicates that the WHNR algorithm has a greater advantage in identifying award-winning papers.
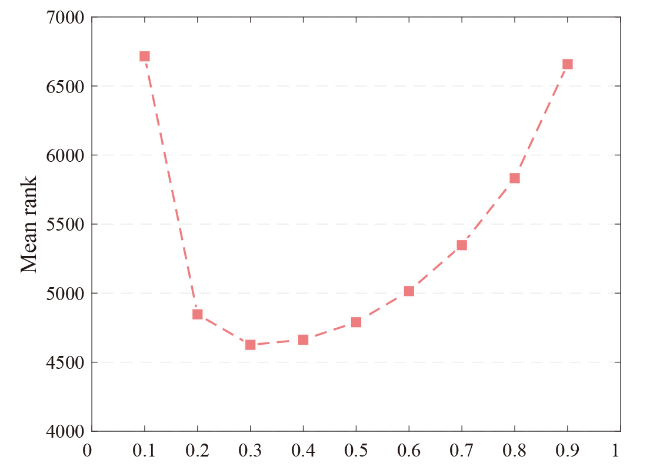
Figure 4. The mean rank of 110 Nobel Prize-winning papers in the WHNR algorithm under different parameters. |
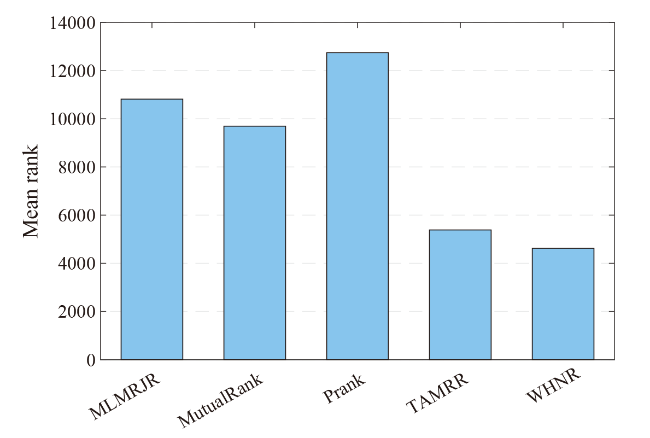
Figure 5. The mean rank of 110 Nobel Prize-winning papers under different mutual enhancement algorithms. |
Next, we investigated the similarities in the performance of the WHNR algorithms (α = 0.3) and the other four ranking algorithms. We calculated the Spearman’s rank correlation coefficient between the paper scores of different ranking algorithms, and the results are shown in Table 1. We can observe that the WHNR algorithm shows a higher correlation with TAMRR, with the correlation coefficient between them exceeding 0.9, but a lower correlation with Prank. TAMRR also shows a lower correlation with Prank but is strongly correlated with the other three mutual enhancement algorithms. The MLMRJR, TAMRR, and MutualRank algorithms are highly correlated with each other, with correlation coefficients above 0.9. Then, we compared the differences of these five mutual enhancement algorithms in identifying high-impact papers. We compared the overlap rates of the top 1% of papers identified under different mutual reinforcement algorithms, and the results are shown in Table 2. It is found that among all algorithm combinations, the WHNR and TAMRR algorithms have the highest overlap rate, close to 0.8, while the MutualRank and Prank algorithms have the lowest overlap rate, which is less than 0.6. By comparing the overlap rate of the top 1% papers identified by different algorithms, we can determine that there are obvious differences in the recognition of high-impact papers by different mutual enhancement algorithms.
Table 1. The correlation between papers’ impact scores under different mutually reinforcing ranking algorithms. |
| Algorithms | WHNR | TAMRR | Prank | MutualRank | MLMRJR |
|---|---|---|---|---|---|
| WHNR | 1 | 0.9277 | 0.7288 | 0.8454 | 0.8972 |
| TAMRR | 0.9277 | 1 | 0.731 | 0.9348 | 0.9777 |
| Prank | 0.7288 | 0.731 | 1 | 0.7836 | 0.7986 |
| MutualRank | 0.8454 | 0.9348 | 0.7836 | 1 | 0.9492 |
| MLMRJR | 0.8972 | 0.9777 | 0.7986 | 0.9492 | 1 |
Table 2. The overlap ratio of the top 1% papers identified by different mutually reinforcing ranking algorithms. |
| Algorithms | WHNR | TAMRR | Prank | MutualRank | MLMRJR |
|---|---|---|---|---|---|
| WHNR | 1 | 0.7911 | 0.6477 | 0.5852 | 0.6254 |
| TAMRR | 0.7911 | 1 | 0.6183 | 0.6803 | 0.7743 |
| Prank | 0.6477 | 0.6183 | 1 | 0.3821 | 0.5178 |
| MutualRank | 0.5852 | 0.6803 | 0.3821 | 1 | 0.6828 |
| MLMRJR | 0.6254 | 0.7743 | 0.5178 | 0.6828 | 1 |
Finally, we give the top 20 papers selected by the WHNR algorithm and their rankings under other mutual enhancement algorithms, and the results are shown in Table 3. We can find that the evaluation results of the WHNR algorithm and the TAMRR algorithm are similar, which they can all rank these papers relatively highly. For the papers selected by our algorithm, the other four mutual reinforcement algorithms also ranked most of the 20 papers higher, with a few exceptions. For example, the paper (DOI: 10.1103/PhysRevLett.77.3865) ranks 1,354 under the Prank algorithm but ranks 6, 6, 3, and 14 under the other four ranking algorithms. The paper (DOI: 10.1103/PhysRev.46.1002) ranks 2,333 under the MLMRJR algorithm but ranks 17, 105, 15, and 16 under the other four ranking algorithms.
Table 3. The top 20 papers identified by different mutually reinforcing ranking algorithms. |
| DOIs | Year | Ranking algorithms | ||||
|---|---|---|---|---|---|---|
| WHNR | MLMRJR | MutualRank | Prank | TAMRR | ||
| 10.1103/PhysRev.81.385 | 1951 | 1 | 88 | 79 | 45 | 24 |
| 10.1103/PhysRev.34.1293 | 1929 | 2 | 59 | 299 | 1 | 4 |
| 10.1103/PhysRev.136.B864 | 1964 | 3 | 60 | 2 | 74 | 3 |
| 10.1103/PhysRev.73.679 | 1948 | 4 | 62 | 43 | 57 | 21 |
| 10.1103/PhysRev.47.777 | 1935 | 5 | 316 | 32 | 42 | 7 |
| 10.1103/PhysRevLett.77.3865 | 1996 | 6 | 6 | 3 | 1,354 | 14 |
| 10.1103/PhysRev.131.2766 | 1963 | 7 | 85 | 40 | 141 | 41 |
| 10.1103/PhysRev.65.117 | 1944 | 8 | 141 | 47 | 8 | 10 |
| 10.1103/RevModPhys.15.1 | 1943 | 9 | 79 | 18 | 51 | 5 |
| 10.1103/PhysRev.125.1067 | 1962 | 10 | 20 | 50 | 104 | 23 |
| 10.1103/PhysRev.106.364 | 1957 | 11 | 65 | 242 | 23 | 27 |
| 10.1103/PhysRev.109.193 | 1958 | 12 | 17 | 41 | 52 | 11 |
| 10.1103/PhysRev.124.1866 | 1961 | 13 | 183 | 8 | 213 | 13 |
| 10.1103/PhysRevLett.19.1264 | 1967 | 14 | 45 | 15 | 65 | 8 |
| 10.1103/PhysRev.109.1492 | 1958 | 15 | 258 | 21 | 64 | 18 |
| 10.1103/PhysRev.43.804 | 1933 | 16 | 98 | 370 | 3 | 15 |
| 10.1103/PhysRev.46.1002 | 1934 | 17 | 2,333 | 105 | 15 | 16 |
| 10.1103/PhysRev.108.1175 | 1957 | 18 | 3 | 4 | 6 | 1 |
| 10.1103/PhysRev.140.A1133 | 1965 | 19 | 35 | 1 | 54 | 2 |
| 10.1103/PhysRevB.23.5048 | 1981 | 20 | 16 | 5 | 392 | 12 |
4.4 Computational analysis of the scientific impact of scientists
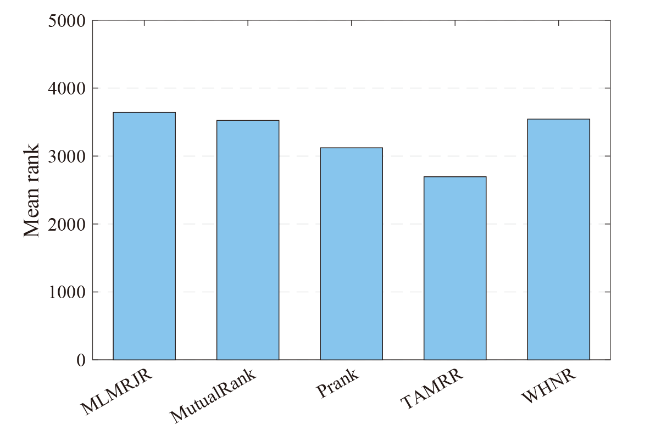
Based on different mutually reinforcing ranking algorithms, we can calculate scientists’ scores and then evaluate their impact by ranking these scores. We first compared the performance of these algorithms in ranking Nobel laureates in physics. We calculated the mean rank of these scientists under different evaluation algorithms, and the results are shown in Figure 6. We find that the TAMRR algorithm can rank Nobel laureates higher. The performance of the WHNR algorithm is similar to that of the MLMRJR and MutualRank algorithms. We then compared the similarities of these algorithms in evaluating scientists. We calculated the Spearman’s rank correlation coefficient between scientists’ scores under different ranking algorithms, as shown in Table 4. In evaluating the authors, we find that the WHNR algorithm exhibits a strong correlation with the MutualRank and TAMRR algorithms compared to other algorithms, but a relatively weak correlation with the Prank algorithm. Furthermore, the TAMRR, MutualRank, and MLMRJR algorithms are also highly correlated with each other in scientist rankings, with correlation coefficients that all exceed 0.94.
Figure 6. The mean rank of 95 Nobel laureates under different mutually reinforcing ranking algorithms. |
Table 4. The correlation between scientists’ impact scores under different mutually reinforcing ranking algorithms. |
| Algorithms | WHNR | TAMRR | Prank | MutualRank | MLMRJR |
|---|---|---|---|---|---|
| WHNR | 1 | 0.8902 | 0.8077 | 0.9118 | 0.8502 |
| TAMRR | 0.8902 | 1 | 0.9372 | 0.9638 | 0.9762 |
| Prank | 0.8077 | 0.9372 | 1 | 0.8808 | 0.9276 |
| MutualRank | 0.9118 | 0.9638 | 0.8808 | 1 | 0.9476 |
| MLMRJR | 0.8502 | 0.9762 | 0.9276 | 0.9476 | 1 |
We compared the differences between different mutual enhancement algorithms in identifying high-impact scientists. We also calculated the overlap rate of the top 1% of authors identified by different ranking algorithms, as shown in Table 5. Compared with other algorithms, the WHNR algorithm has the highest overlap rate with the TAMRR algorithm in terms of identifying high-impact authors, and it has the lowest coincidence rate with the Prank algorithm. Among the TAMRR, MLMRJR, and MutualRank algorithms, the overlap rate in selecting high-impact scientists between any two was relatively high, with each pair exhibiting an overlap rate exceeding 0.8. In contrast, the Prank algorithm shows a relatively low overlap rate with the others, with no pair showing an overlap rate exceeding 0.7.
Table 5. The overlap ratio of the top 1% of scientists identified by different mutually reinforcing ranking algorithms. |
| Algorithms | WHNR | TAMRR | Prank | MutualRank | MLMRJR |
|---|---|---|---|---|---|
| WHNR | 1 | 0.8113 | 0.6180 | 0.7843 | 0.7497 |
| TAMRR | 0.8113 | 1 | 0.6809 | 0.8126 | 0.8472 |
| Prank | 0.6180 | 0.6809 | 1 | 0.5901 | 0.6133 |
| MutualRank | 0.7843 | 0.8126 | 0.5901 | 1 | 0.8691 |
| MLMRJR | 0.7497 | 0.8472 | 0.6133 | 0.8691 | 1 |
Next, we show the top 20 authors selected by the WHNR algorithm and their rankings under other mutual enhancement algorithms, as shown in Table 6. We find that the WHNR algorithm ranks some authors relatively highly, such as John H. Van Vleck, Murray Gell-Mann, Richard Phillips Feynman, and Robert S. Mulliken. However, these authors are ranked relatively lower in the MLMRJR algorithm, MutualRank algorithm, and Prank algorithm. Overall, the WHNR algorithm ranks these 20 authors more similarly to the TAMRR algorithm.
Table 6. The top 20 scientists identified by different mutually reinforcing ranking algorithms. |
| Authors | Paper count | Ranking algorithms | ||||
|---|---|---|---|---|---|---|
| WHNR | MLMRJR | MutualRank | Prank | TAMRR | ||
| John C. Slater | 66 | 1 | 4 | 4 | 1 | 1 |
| G. Breit | 176 | 2 | 3 | 6 | 3 | 3 |
| Chen N. Yang | 105 | 3 | 9 | 8 | 7 | 9 |
| John H. Van Vleck | 63 | 4 | 36 | 24 | 20 | 12 |
| M. Gell-Mann | 38 | 5 | 19 | 25 | 14 | 15 |
| Richard P. Feynman | 34 | 6 | 26 | 20 | 13 | 13 |
| Hans A. Bethe | 101 | 7 | 7 | 7 | 10 | 5 |
| U. Fano | 83 | 8 | 46 | 18 | 183 | 18 |
| S. Weinberg | 133 | 9 | 2 | 3 | 15 | 6 |
| Robert S. Mulliken | 65 | 10 | 60 | 62 | 39 | 33 |
| Philip W. Anderson | 138 | 11 | 1 | 1 | 8 | 2 |
| Eugene P. Wigner | 46 | 12 | 20 | 12 | 2 | 7 |
| Julian S. Schwinger | 104 | 13 | 6 | 5 | 6 | 4 |
| J. Bardeen | 79 | 14 | 15 | 11 | 5 | 10 |
| Taekoon D. Lee | 189 | 15 | 11 | 17 | 16 | 14 |
| C. Kittel | 80 | 16 | 17 | 19 | 19 | 11 |
| James C. Phillips | 195 | 17 | 27 | 28 | 49 | 25 |
| W. Kohn | 115 | 18 | 5 | 2 | 22 | 8 |
| Geoffrey F. Chew | 85 | 19 | 22 | 32 | 36 | 31 |
| Bertrand I. Halperin | 185 | 20 | 13 | 9 | 63 | 16 |
4.5 Computational analysis of the scientific impact of journals
Finally, we analyzed the performance of these mutual reinforcement ranking algorithms in evaluating journals, and the results were shown in Table 7. In the data set we used, Physical Review covers the journal articles published from 1913 to 1969, and Physical Review Series I covers journal articles published from 1893 to 1912. Since these two journals are no longer published, so we only rank existing journals. Physical Review Letters covers journal articles published from 1958 to 2010, Physical Review A, B, C, D cover journal articles published from 1970 to 2010, Physical Review E covers journal articles published from 1993 to 2010, Review of Modern Physics covers journal articles published from 1929 to 2010, Physical Review Special Topics-Accelerators and Beams covers journal articles published from 1998 to 2010, and Physical Review Special Topics-Physics Education Research covers journal articles published from 2005 to 2010. One can see that the WHNR algorithm has the same results as the MLMRJR algorithm and the TAMRR algorithm in journal evaluation. However, it is quite different from MutualRank’s evaluation results. It should be pointed out that Physical Review Letters is the world’s premier physics letter journal, providing the rapid publication of short reports of important fundamental research in all fields of physics. It is precisely because of the reputation and authority of the journal Physical Review Letters that all evaluation algorithms rank it first. Physical Review B is the world’s largest dedicated physics journal, and it mainly covers papers related to condensed matter and materials physics, which all algorithms rank second.
Table 7. Journal rankings based on different mutually reinforcing ranking algorithms. |
| Journals | Ranking algorithms | ||||
|---|---|---|---|---|---|
| WHNR | MLMRJR | MutualRank | Prank | TAMRR | |
| Physical Review Letters | 1 | 1 | 1 | 1 | 1 |
| Physical Review B | 2 | 2 | 2 | 2 | 2 |
| Physical Review D | 3 | 3 | 4 | 3 | 3 |
| Physical Review A | 4 | 4 | 3 | 4 | 4 |
| Physical Review C | 5 | 5 | 6 | 6 | 5 |
| Physical Review E | 6 | 6 | 5 | 7 | 6 |
| Review of Modern Physics | 7 | 7 | 7 | 5 | 7 |
| Physical Review Special Topics-Accelerators and Beams | 8 | 8 | 8 | 8 | 8 |
| Physical Review Special Topics-Physics Education Research | 9 | 9 | 9 | 9 | 9 |
4.6 Hypothesis testing
Our WHNR algorithm is built upon the previously mentioned assumptions. Therefore, after obtaining the algorithm’s calculation results, we need to validate these earlier assumptions. We first formalize each assumption as a testable hypothesis, and the following hypotheses can be obtained: (1) H1: The impact of a paper has no correlation with the average impact of the papers that cite it. (2) H2: The impact of a paper has no correlation with the average impact of its authors. (3) H3: The impact of a paper has no correlation with the impact of the journal in which it is published. (4) H4: The author’s impact has no correlation with the average impact of the published papers. (5) H5: The author’s impact has no correlation with the average impact of the journals where the papers are published. (6) H6: The impact of an author has no correlation with the average impact of their citing authors. (7) H7: The impact of a journal has no correlation with the average impact of its papers. (8) H8: The impact of a journal has no correlation with the average impact of the authors involved in it. (9) H9: The impact of a journal has no correlation with the average impact of the journals that cite it. For each hypothesis, we compute the Spearman’s rank correlation coefficient between the relevant variables. For example, for H1, we calculated the correlation between a paper’s score and the average score of its citing papers. If a significant positive correlation coefficient is obtained, the null hypothesis is rejected, thereby supporting the hypothesized positive relationship. We then use permutation tests (perform 1,000 permutations) to verify whether these correlations are significant and use the Bootstrap method to obtain the confidence interval of the correlation coefficient. The same analytical process is applied consistently across all remaining hypotheses. The detailed results of the hypothesis test are shown in Table 8. We can observe that for all the hypotheses, significant positive Spearman’s correlation coefficients were obtained, which validates the assumptions we previously proposed.
Table 8. Hypothesis testing results. |
| Hypothesis | Correlation Test | ||
|---|---|---|---|
| Correlation Coefficient | P-value | 95% Confidence Interval | |
| H1 | 0.3974 | 0.0010 | [0.3947, 0.4002] |
| H2 | 0.5341 | 0.0010 | [0.5317, 0.5362] |
| H3 | 0.5955 | 0.0010 | [0.5932, 0.5976] |
| H4 | 0.5295 | 0.0010 | [0.5265, 0.5323] |
| H5 | 0.2219 | 0.0010 | [0.2179, 0.2257] |
| H6 | 0.4248 | 0.0010 | [0.4214, 0.4286] |
| H7 | 0.7273 | 0.0130 | [0.0748, 1] |
| H8 | 0.7364 | 0.0140 | [0.1686, 0.9703] |
| H9 | 0.7360 | 0.0150 | [0.1336, 0.9721] |
5 Discussion
To enhance the evaluation of the scientific impact of academic papers, we consider the mutual enhancement between the influence of different academic entities and propose a weighted heterogeneous network-based ranking algorithm that combines the ideas of the PageRank and HITS algorithms. Unlike previous weighted scholarly networks, we constructed a weighted paper citation network by incorporating the similarity between papers. Considering the number of authors in each paper, we constructed a weighted author citation network and weighted networks between the paper layer and the author layer. Taking into account both the number of published papers by the authors and the number of authors per paper, we constructed weighted networks between the author layer and the journal layer. We then applied our proposed ranking algorithm to the APS dataset to show the algorithm’s performance. The experimental results indicate that, compared with other mutually reinforced ranking algorithms, our algorithm can rank Nobel Prize-winning papers higher. In terms of evaluating the authors’ impact, our algorithm’s performance for Nobel laureates in physics is moderate relative to these evaluation methods. In terms of journal impact evaluation, our algorithm performed consistently with most mutual reinforcement-based ranking algorithms. Overall, our proposed ranking algorithm based on weighted heterogeneous scholarly networks demonstrates strong capability in identifying important academic entities.
However, this study has some limitations. First, the intralayer networks of papers, authors, and journals within the constructed weighted heterogeneous network are all fundamentally built based on the citation relationships among papers, which may lead to potential issues such as overlapping effects. If the links in different layers are constructed entirely and directly based on the citation relationships between papers, the overlapping effect will be relatively strong. Therefore, in our research, we consider other factors, such as the similarity between papers and the number of authors in each paper, to redefine the link weights and thereby alleviate the overlapping effect. To address this issue more effectively, in our subsequent research, we will incorporate additional types of entity relationships (e.g. collaboration, co-occurrence, co-citation) beyond direct citation relationships into the construction of the heterogeneous network. Second, the proposed method relies on manually defined rules and fixed parameters, which introduces subjective bias and lacks a principled automated learning mechanism. As a result, when the method is directly applied to new datasets or different domains, their performance deteriorates, and they cannot generalize or transfer effectively without retuning. To address this limitation, we will explore graph neural networks (GNNs) or deep embedding methods to achieve end-to-end vector learning for nodes and relations in heterogeneous networks (Sang et al., 2025), and then achieve node ranking on this basis. Third, in the evaluation of algorithm effectiveness, it is necessary to further enrich the validation methods. We cannot mainly rely on the benchmark of Nobel Prize-winning papers. Instead, a more robust quantitative evaluation method system should be established.
In addition, it is important to emphasize that this study primarily focuses on the academic impact of research papers, which represents only one dimension of research value and does not necessarily reflect their intrinsic scholarly value. As stated in the Leiden Manifesto (Hicks et al., 2015): “Quantitative evaluation should support qualitative, expert assessment.” The method we propose merely enriches the multidimensional scientific influence evaluation indicators, with the aim of assisting expert evaluation rather than using this method to judge the intrinsic academic value of individual papers. Furthermore, this study tends to explore citation-based evaluation methods, but such methods inherently have issues such as disciplinary differences and time biases. With advances in artificial intelligence, it has become increasingly feasible to integrate content-based features derived from scholarly publications into scientific impact assessment frameworks, thereby improving the performance of existing evaluation methods. We will explore integrated methods, such as textual/semantic representations, topic modeling, causal inference to address confounding factors, and time decay/cohort normalization.
6 Conclusion
Under the framework of the initiatives of the San Francisco Declaration on Research Assessment (DORA) and the Leiden Manifesto, we proposed an algorithm called WHNR for evaluating the influence of academic papers, which can assist in identifying highly influential papers from a vast number of academic papers. When measuring the scientific influence of a paper, this algorithm not only takes into account the citation relationship between papers but also considers the enhancing relationship of the influence of two types of entities, namely authors and journals, on the influence of the paper. Experiments on the APS dataset show that the WHNR algorithm outperforms existing algorithms such as P-Rank, MutualRank, MLMRJR, and TAMRR in identifying high-impact papers, and also demonstrates good performance in evaluating the influence of authors and journals. The key contribution of this paper lies in proposing a more fine-grained weighted heterogeneous academic network construction method, which comprehensively considers the strength of the relationships between entities. The experimental performance of the WHNR algorithm fully validated the effectiveness of the constructed weighted network. Therefore, if the structural information of this network can be more fully utilized, more efficient algorithms for evaluating the influence of papers can be designed.
The WHNR algorithm is a network-based evaluation method. Essentially, it relies on the citation relationships among papers and actually measures the influence of papers based on their external features. By analyzing the textual content of a paper, we can access its internal features and thereby uncover the academic value and contributions of the research. Therefore, in our future research, we will prioritize the further development of an integrated method that combines network-based and text-mining approaches to assess the scientific impact of academic papers. Additionally, because the WHNR algorithm contains free parameters, although the setting of these parameters has been optimized, their optimal values may vary across different disciplines. We will also explore the adaptive mechanism of the parameters and develop universal evaluation methods applicable to multiple disciplines.
Funding information
This study was supported by the National Natural Science Foundation of China (Grant No. 72371031), MOE (Ministry of Education in China) Liberal Arts and Social Sciences Foundation (Grant No. 20YJC870015), and the Fundamental Research Funds for the Central Universities.
Author contributions
Jianlin Zhou (jianlinzhou@bnu.edu.cn; ORCID: 0000-0002-3218-8795): Conceptualization (Equal), Methodology (Equal), Formal analysis (Lead), Investigation (Lead), Writing - original draft (Equal), Writing - review & editing (Equal).
Xinyue Dong (xinyuedong@ncepu.edu.cn; ORCID: 0009-0009-4353-6378): Formal analysis (supporting), Investigation (supporting), Writing - original draft (Equal), Writing - review & editing (Equal).
Bin cui (cbin0830@126.com): Formal analysis (supporting), Writing - original draft (Equal), Writing - review & editing (Equal).
Ying Fan (yfan@bnu.edu.cn): Conceptualization (Equal), Methodology (Equal), Supervision (Lead), Writing - original draft (Equal), Writing - review & editing (Equal).
Data availability statements
The data are available upon request from the corresponding author.